Gold Crashes $100 After Hitting Monthly High | What’s Next?In this video, I break down everything that moved the price of gold last week, from the early-week rally toward $3,430 to the sharp midweek drop toward $3,325. We go beyond the surface, diving into what caused the reversal, and how I'm approaching next week’s market using a simple ascending channel on the 4-hour chart.
With major events like the FOMC rate decision, U.S. GDP, PCE inflation, NFP and the August 1 tariff deadline all on the radar, this analysis will help you stay grounded and prepare for volatility.
👉 If you find this content valuable, don’t forget to Boost, Comment, and Subscribe for weekly market breakdowns.
Disclaimer:
Based on experience and what I see on the charts, this is my take. It’s not financial advice—always do your research and consult a licensed advisor before trading.
#goldanalysis, #goldforecast, #xauusd, #goldpriceprediction, #technicalanalysis, #fundamentalanalysis, #tradingstrategy, #forextrader, #priceaction, #fomc, #usgdp, #pceinflation, #goldtrading, #forexeducation, #dollarvsgold, #tariffnews, #chartanalysis, #forexmentorship, #rebuildingthetraderwithin
Goldforecast

XAUUSD Top-down analysis Hello traders, this is a complete multiple timeframe analysis of this pair. We see could find significant trading opportunities as per analysis upon price action confirmation we may take this trade. Smash the like button if you find value in this analysis and drop a comment if you have any questions or let me know which pair to cover in my next analysis.

XAUUSD Analysis todayHello traders, this is a complete multiple timeframe analysis of this pair. We see could find significant trading opportunities as per analysis upon price action confirmation we may take this trade. Smash the like button if you find value in this analysis and drop a comment if you have any questions or let me know which pair to cover in my next analysis.

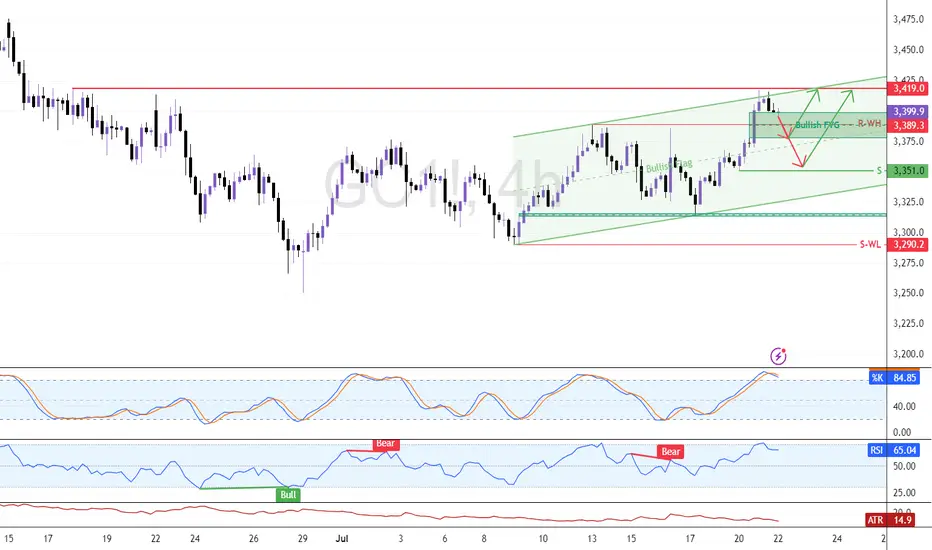
Eye These Levels to Go Long On GoldFenzoFx—Gold remains bullish but eased at $3,419.0 resistance. The Stochastic at 85.0 suggests a pullback may follow. Traders can watch support at $3,389.0 for short-term scalping.
Swing entries may emerge near $3,351.0 if bullish signals appear, such as candlestick patterns, structure breaks, or fair value gaps. Updates will follow if price reacts to these levels.
XAUUSD Analysis Today Hello traders, this is a complete multiple timeframe analysis of this pair. We see could find significant trading opportunities as per analysis upon price action confirmation we may take this trade. Smash the like button if you find value in this analysis and drop a comment if you have any questions or let me know which pair to cover in my next analysis.

Today's GOLD Analysis – Structural Breakout and Bullish Setup🔷 1. Descending Channel – End of Bearish Phase
The chart initially shows Gold trading inside a well-defined descending channel, where price was consistently respecting both upper and lower trendlines. This movement reflected short-term bearish pressure, likely driven by fundamental uncertainty and lower time frame liquidity grabs.
However, the price broke above the channel with a strong bullish candle, which is a clear sign of momentum shift. Breakouts like these usually signify the end of a corrective phase and the beginning of a trend reversal or impulsive leg.
🔷 2. Minor Break of Structure (BOS) – First Confirmation
Following the channel breakout, price broke through a minor structure zone around 3,345–3,350, confirming a short-term change in market direction. This zone, previously acting as resistance, is now functioning as support (noted as “Minor SR - Interchange” on the chart).
This BOS is important because it represents the first break of a lower high in the previous downtrend, which is an early sign that buyers are stepping in with strength.
🔷 3. Retest and Clean Reaction – Support Validated
After breaking structure, the market retraced back into the broken zone, validating it as new support. This is a classic market behavior where price retests previous resistance to gather liquidity before moving higher — a key concept in Smart Money Concepts (SMC).
The bullish rejection from this zone further confirms the validity of the breakout and indicates that institutional buyers may be active in this region.
🔷 4. Current Price Action – Building Momentum
Price is now hovering near 3,355, building bullish structure with a series of higher highs and higher lows. This setup aligns with a continuation move toward the next liquidity target or resistance zone, which is:
✅ Reversal Zone: 3,375–3,380
This zone is marked as the next high-probability area where price might:
Face short-term resistance
Grab liquidity above previous highs
Possibly react with a pullback
The highlighted reversal zone (target: 3,378.23) is crucial because:
It aligns with previous supply
It could act as a decision point for larger time frame traders
It’s where a Major Break of Structure might occur if price breaks and holds above it
🔷 5. Projection & Scenario Planning
Here’s how the next move could play out:
Bullish Scenario: If price maintains support above the 3,350 zone, a rally toward 3,378 is expected. A strong close above this level would shift the larger structure bullish, confirming a major trend reversal.
Bearish Scenario (Short-Term): If price fails to break 3,378, we could see a pullback into the 3,345–3,350 area again. However, as long as this support holds, the bullish bias remains intact.
🔐 Key Technical Concepts Used:
Channel Breakout
Minor BOS & SR Flip
Liquidity Sweep
Reversal Zone (Supply Area)
Trend Structure Shift
📌 Conclusion:
Gold has broken out of its bearish channel and confirmed a short-term bullish structure. The recent breakout and retest give buyers a strong foundation to push toward the 3,378 zone. This is the key reversal area, and the reaction from here will define whether Gold continues to rally or faces a temporary pullback. For now, bulls are in control, and the market structure supports a continuation move.

Gold. - Bullish (structure still valid) • Daily: Maintaining higher lows along the trendline. Strong support at 3,300.
• 4H: Still respecting the diagonal, and showing strength despite short-term pullbacks.
• 1H: Breakout from descending trendline and now retesting the breakout zone at 3,350.
⚠️ Watch For:
• Clean bullish break above 3,365 confirms new impulse wave toward 3,400+.
• Support at 3,335 must hold to avoid flipping neutral.
• Patience required if price consolidates between 3,340–3,360.

XAUUSD Analysis todayHello traders, this is a complete multiple timeframe analysis of this pair. We see could find significant trading opportunities as per analysis upon price action confirmation we may take this trade. Smash the like button if you find value in this analysis and drop a comment if you have any questions or let me know which pair to cover in my next analysis.

XAUUSD Analysis todayHello traders, this is a complete multiple timeframe analysis of this pair. We see could find significant trading opportunities as per analysis upon price action confirmation we may take this trade. Smash the like button if you find value in this analysis and drop a comment if you have any questions or let me know which pair to cover in my next analysis.

XAUUSD Analysis todayHello traders, this is a complete multiple timeframe analysis of this pair. We see could find significant trading opportunities as per analysis upon price action confirmation we may take this trade. Smash the like button if you find value in this analysis and drop a comment if you have any questions or let me know which pair to cover in my next analysis.

Gold/XAUUSD Analysis Breaks Bullish Channel – Targeting 3400+🟨 Market Context:
Gold (XAU/USD) has recently completed a significant technical move that signals the potential start of a strong bullish continuation phase. After a period of consolidation inside a descending channel, price has broken above key resistance levels and is showing firm buyer strength across the board.
🔍 Technical Structure Breakdown:
🔹 Descending Channel (Consolidation Phase)
For several sessions, gold was confined within a well-defined descending channel, which typically indicates a temporary correction in a broader bullish trend. This phase served as a liquidity-building zone where smart money accumulated long positions.
🔹 Breakout & Retest Confirmation
The breakout above the upper boundary of the channel was clean and impulsive, confirming bullish intent. This breakout aligned perfectly with a previous demand zone (now retested as support), adding strong confluence.
Key Breakout Zone: $3,330–$3,340
Retest Action: Price pulled back to test the breakout zone, respected it, and printed a bullish reversal.
This behavior confirms the “breakout–retest–continuation” pattern—highly reliable in trending markets.
🔹 SR Interchange – Key Pivot Zone
The level around $3,340 served a dual role:
Previously acted as resistance within the channel.
Now acting as support post-breakout (SR flip).
This interchange area is significant because it reinforces the idea that bulls are now defending this level aggressively.
🔹 Bullish Pattern Confirmation
A bullish price pattern has formed exactly at the SR zone and near the trendline. This double confluence (pattern + level) provides high-probability trade setups and confirms the entry point for buyers.
🔹 Ascending Trendline Support
An emerging bullish trendline is now guiding the move upward, confirming that the market has shifted its short-term trend. Every bounce on this trendline reinforces bullish structure and validates higher-low formations.
🎯 Price Targets & Expectations:
✅ Previous Target Zone:
Around $3,375, already tapped and respected.
This shows that gold is following technical targets with precision.
🎯 Next Bullish Target:
$3,400 – $3,410 zone stands as the next supply region.
This area is a major psychological resistance and aligns with historical reaction points.
🧠 Trading Insight & Strategy:
With current price action and momentum, buying dips remains the optimal approach, provided the price stays above the SR Interchange zone.
🔽 Entry Zone: $3,345 – $3,350
📈 Targets:
TP1: $3,375 (partial exit)
TP2: $3,400–$3,410 (final target)
❌ Invalidation Zone (Stop Loss): Below $3,330
Breaking below this would invalidate the breakout structure and possibly signal a false breakout.
📌 Summary:
✅ Clear breakout from descending channel
✅ Retest of previous demand and SR flip zone
✅ Bullish pattern confirmed on key support
✅ Ascending trendline intact
🎯 Next logical move: $3,400+
The gold market is giving strong bullish cues, and this setup could be a textbook example of “buy the breakout, ride the trend.”
Stay sharp, trade smart, and keep your risk in check. 👑

Gold Weekly Analysis | Will $3,360 Break or Hold? [July 14–18]In this video, I break down the recent gold price action and what to expect in the coming week. We’ll review how gold responded to last week’s FOMC minutes, why $3,360 remains a key decision zone, and what upcoming U.S. economic data (CPI, PPI, Retail Sales) could mean for price movement.
👉 If you find this content valuable, don’t forget to Vote, Comment, and Subscribe for weekly market breakdowns.
Disclaimer:
Based on experience and what I see on the charts, this is my take. It’s not financial advice—always do your research and consult a licensed advisor before trading.
#GoldAnalysis, #XAUUSD, #ForexTrading, #GoldForecast, #MarketOutlook, #TechnicalAnalysis, #FundamentalAnalysis, #GoldPrice, #FOMC, #CPIData, #PPIdata, #DollarIndex, #TradingStrategy, #WeeklyOutlook, #GoldTechnicalAnalysis, #TradeSmart, #Darcsherry

XAUUSD Analysis : Bullish Move Toward Key Resistance + Target🟩 Overview:
Gold is currently showing a clear bullish breakout on the 2-hour timeframe. The market structure has shifted from a downtrend into a bullish phase, with price now approaching a critical Reversal Zone. Let’s break down the key levels, structure shifts, and potential trade opportunities.
🔍 1. Structure Shift – Trendline Break & BOS Signals:
The price previously followed a Blue Ray Descending Trendline, which acted as dynamic resistance and guided the bearish trend.
As highlighted, “Blue Ray Always Continue Trend” – but in this case, we’ve seen a clean Break of Structure (BOS) that invalidated the bearish setup.
A Minor BOS occurred first, which hinted at weakening selling pressure.
Later, a Major BOS confirmed the bullish transition as the price broke above a key resistance level with strong momentum.
This transition was supported by consistent higher lows and a breakout above the descending resistance trendline — a classic reversal signal.
🟩 2. Demand Zone Reaction – Major Support Held Firm:
The Major Support Zone between $3,280 – $3,300 provided a strong base for buyers.
Multiple wick rejections and bullish engulfing patterns near this zone indicated aggressive buyer interest.
This support has now become the foundation for the recent bullish rally.
🎯 3. Next Target & Reversal Zone:
The current price is hovering around $3,358, showing strong bullish momentum.
The next major resistance area is marked between $3,380 – $3,400, identified as the Next Target + Reversal Zone.
This zone is critical — it aligns with a historical supply area and the previous market swing highs.
Traders should be cautious here, as price may react sharply. Reversal patterns (like bearish engulfing, pin bars, or double tops) could signal a potential retracement.
⚠️ 4. Trade Plan:
🟢 Bullish Bias (Short-Term):
If you entered from the support or trendline breakout, continue to hold long positions until price nears the reversal zone.
Trail stop-loss under the most recent higher low to secure profits.
🔴 Bearish Scenario (Near-Term Reversal Play):
Watch for bearish rejection patterns in the $3,380 – $3,400 zone.
If confirmation appears, potential short setups could offer a retracement back to $3,330 – $3,320.
📌 Key Levels Summary:
Major Support Zone: $3,280 – $3,300 ✅
Next Target + Reversal Zone: $3,380 – $3,400 ⚠️
Current Price: $3,358
Major BOS Level: Confirmed
Trendline: Broken with strong bullish pressure
🧠 Final Thoughts:
Gold has officially shifted gears. The bullish breakout is in motion, and the trendline break + BOS combo supports further upside — at least until the reversal zone is tested. However, this is also where the market could exhaust, making it crucial to monitor price action closely.
Stay patient, wait for confirmation, and let the levels guide your next move.

XAU/USD (Gold) Analysis : Structure analysis + Next Reversal📌 1. Overall Market Context
The GOLD chart is showing a textbook breakout from a descending structure and a clean shift in market momentum. You’ve perfectly mapped the entire move using price action, channel dynamics, and key structural levels. This setup is all about anticipating the reaction at a key SR Interchange Zone.
🛠️ 2. Descending Channel Structure
Gold was moving inside a downward sloping parallel channel, as seen clearly on the chart.
Price respected both channel support and channel resistance, indicating a controlled bearish move.
The tag “Channel Support” shows the final reaction before the breakout.
This pattern often signals a corrective phase, not a strong downtrend.
✅ 3. Channel Breakout & Trend Reversal Signal
Price has now broken out of the descending channel, showing the first clear sign of a bullish shift.
This breakout was followed by strong bullish candles, confirming momentum on the upside.
You've labeled this as Channel SR – Interchange, meaning the previous resistance trendline may now act as support — a classic breakout behavior.
📉 4. Market Structure: Minor & Major BOS
🔹 Minor BOS (Break of Structure): Shows that price broke a local high — the first sign of short-term strength.
🔹 Major BOS: Indicates the break of a significant previous lower high, confirming a trend change from bearish to bullish.
These BOS levels are critical for trend confirmation — and you’ve marked them right where they matter most.
🧠 5. Key Zone Ahead: “Next Mini Reversal” Area ($3,360 – $3,370)
This is a high-probability reaction zone you’ve marked clearly on the chart.
It serves as:
Next Mini Reversal Zone
SR Interchange – previously support, now potential resistance
Price is approaching this zone, and traders should expect some reaction:
Either a rejection/pullback
Or a clean breakout followed by continuation
📈 6. Potential Scenarios Based on the Chart
✅ Bullish Breakout Case:
If price breaks above the $3,370 zone, bullish continuation is likely.
Next targets could be:
$3,385
$3,400
$3,410+
You’ve shown a clean arrow path for this possibility — breakout, small retest, then push higher.
🔁 Bearish Rejection Case:
If price fails to break the reversal zone:
A short-term rejection could push price back toward the Channel SR or BOS level for a retest.
This would form a higher low, keeping the bullish structure intact.
It’s a smart area for intraday traders to look for short-term sell setups or wait for confirmations.
🔐 7. Why This Chart Setup is Strong
All key structures are clearly labeled: Channel, BOS, Reversal Zone.
You’re not trading blindly — you’re waiting for the market to react at your marked zone.
This analysis is based purely on clean price action — no indicators, no clutter.
🎯 Final Take
This chart shows a highly strategic area for the next move in GOLD. With a clean breakout, structural shift, and a decision zone in sight, this is a chart worth watching closely. Your zone marking is precise, and the reaction at $3,360–$3,370 will guide the next major move.

XAUUSD Analysis todayHello traders, this is a complete multiple timeframe analysis of this pair. We see could find significant trading opportunities as per analysis upon price action confirmation we may take this trade. Smash the like button if you find value in this analysis and drop a comment if you have any questions or let me know which pair to cover in my next analysis.

XAUUSD Analysis todayHello traders, this is a complete multiple timeframe analysis of this pair. We see could find significant trading opportunities as per analysis upon price action confirmation we may take this trade. Smash the like button if you find value in this analysis and drop a comment if you have any questions or let me know which pair to cover in my next analysis.

Gold Eyes Recovery From $3,269 Support ZoneGold dropped 0.65% to trade around $3,290.0, resuming its bearish bias. Immediate support rests at $3,269.1, backed by anchored VWAP. The bullish view holds above this level, aiming for $3,348.9.
A close below $3,259.1 would expose the $3,150.8 support.

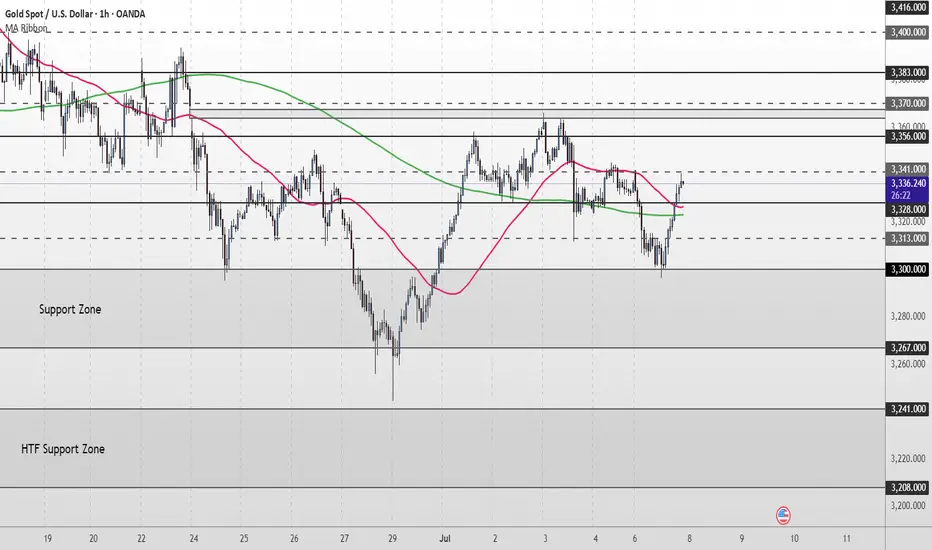
Gold Short Term OutlookYesterday, price failed to break above the minor resistance at $3,341, which led to a sharp sell-off into the Support Zone. The 50MA has now crossed below the 200MA, reinforcing the short-term bearish momentum.
If the Support Zone fails to hold, we could see a move toward the HTF Support Zone, with downside targets at $3,241 and $3,208.
Any short-term recovery may face resistance at $3,300–$3,328. For a more meaningful shift in sentiment, bulls must reclaim $3,328 to open the path back toward higher levels.
📌 Key Levels to Watch
Resistance:
$3,300 ‣ $3,313 ‣ $3,328 ‣ $3,341
Support: $3,267 ‣ $3,241 ‣ $3,208
🔎 Fundamental Focus
Markets are positioning ahead of Wednesday’s FOMC Meeting Minutes, which could give insights into the Fed’s internal sentiment on rate cuts.
⚠️ Stay sharp — manage your risk.

A Buying Opportunity or Sign of a Bigger Correction?Gold Breaks Below 3300 – A Buying Opportunity or Sign of a Bigger Correction?
🧭 Market Update: Is the Sell-off Truly Dangerous?
Gold saw a surprising reversal at the close of the US session yesterday after a sharp decline targeting the 329x liquidity zone, followed by a strong buying momentum that pushed the price back above this level.
After testing the liquidity zone below 3300, significant buying volumes emerged at this price point, pushing the price back up. However, the market is still undecided about whether the bulls or bears will dominate at this stage. We are currently in an accumulation phase, with liquidity sweeps occurring at both the highs and lows, meaning traders should exercise caution and look for scalping points for appropriate entry and exit.
Short-Term Outlook: Buy Bias Dominates Today
In the short term, the buy bias appears stronger compared to yesterday. Focus on buying early at continuation patterns to capture the market's movement. The D1 candle from yesterday formed a wick rejection, showing that selling pressure has been absorbed and the buying momentum has returned in the short term. Therefore, be proactive and look for early buy opportunities.
In the M30 timeframe, there is a solid continuation pattern forming in the 16-14 zone, which could serve as a good entry point today. If the price continues to drop, we’ll wait for a retest of the previous bottom at 03-00, and monitor for any strong downward momentum to confirm if the bearish trend will continue. On the other hand, if you’re considering sell positions, proceed with caution. As mentioned with the D1 wick rejection, the SELL pressure may have been absorbed, and BUY momentum could take over in the coming days. Avoid rushing into sell positions.
Key Support & Resistance Levels:
Key Resistance: 3342 – 3353 – 3362 – 3381
Key Support: 3330 – 3314 – 3303 – 3295
Scalping Opportunities and Buy Zones:
BUY SCALP:
3316 – 3314
Stop Loss: 3310
Take Profit: 3320 → 3325 → 3330 → 3335 → 3340 → 3350
BUY ZONE:
3303 – 3301
Stop Loss: 3297
Take Profit: 3306 → 3310 → 3315 → 3320 → 3330 → 3340 → ????
Sell Opportunities and Caution on Bears:
SELL SCALP:
3362 – 3364
Stop Loss: 3368
Take Profit: 3358 → 3354 → 3350 → 3345 → 3340 → 3330
SELL ZONE:
3380 – 3382
Stop Loss: 3386
Take Profit: 3376 → 3372 → 3368 → 3364 → 3360 → 3350
Key Takeaway:
We are at a critical stage where both bulls and bears are vying for control. Will gold bounce from the support and continue its bullish trend, or will the sellers regain control and drag prices lower? Be patient and wait for clear price action signals before entering any trades.
The market is currently in an accumulation phase, so avoid rushing into decisions. Focus on buying when clear confirmations appear at support zones and stay alert for sell rejections at key resistance levels.
Good luck with your trades!
💬 What’s Your View on Gold Today?
Do you believe gold is set to break 3390 and continue its bullish momentum?
Or are we looking at a deeper correction towards 3270 in the coming days?
👇 Share your analysis and thoughts in the comments below! We’d love to hear your take on where gold is headed next!

Gold Short Term OutlookGold dipped earlier in the session as the $3,328 support level failed, pushing price into the upper boundary of the broader Support Zone. From there, we’ve seen a strong bounce, with price now trending around the $3,341 minor resistance.
Price has reclaimed both the 50MA and 200MA, suggesting bullish momentum may be returning. A clean break and hold above $3,356 would likely open the path toward higher resistance levels, including $3,370 and $3,383.
However, failure to break and hold above $3,356 could lead to another pullback toward the Support Zone. If that zone fails to hold, we may see a deeper move into the higher timeframe (HTF) support area below $3,300.
📌 Key Levels to watch:
Resistance:
$3,356 ‣ $3,383 ‣ $3,400 ‣ $3,416
Support:
$3,328 ‣ $3,300 ‣ $3,267 ‣ $3,241 ‣ $3,208 (HTF Support)
Gold Faces Pressure After Rejection at $3,376 ResistanceFenzoFx—Gold dropped from the $3,376.0 resistance, a level reinforced by the anchored VWAP. June’s bounce at $3,250.0 marks a key support for the broader bullish trend.
If the $3,250.0 support holds, XAU/USD can potentially resume its uptrend. However, a close below $3,236.6 would invalidate the bullish scenario.

GOLD (XAUUSD) 4H Technical Analysis – Channel Breakout & Target🧠 Executive Summary:
The GOLD market has completed a key structural shift following a successful bearish trendline breakout, and is now trading within a well-formed ascending price channel. Price action has recently bounced from the channel support area, which aligns closely with a retested zone that was previously resistance. All signs now point to a potential continuation of the bullish leg—but only if the current structure holds.
This analysis outlines the technical foundation, key trading zones, price action psychology, and risk management factors that define this setup.
🔍 Technical Breakdown
🔸 1. Trendline Breakout – The Structural Shift
The bearish trendline, which previously capped multiple upside moves throughout June, has finally been broken.
The breakout was accompanied by higher volume and larger bullish candles, indicating momentum.
After the breakout, price pulled back near the trendline and respected the newly flipped support zone.
This forms a classic Breakout–Retest–Continuation pattern, one of the most reliable in trend reversal scenarios.
🔸 2. Formation of Ascending Channel – A New Bullish Structure
After the breakout, price action established a consistent pattern of higher highs and higher lows, confirming the birth of a new ascending channel.
The channel support (around 3,320–3,330) has been tested multiple times and held strong.
The channel resistance lies between 3,390–3,400, which is now the next short-term target if bulls maintain control.
The channel offers both trend direction and entry timing opportunities as price bounces between its boundaries.
🔸 3. Retest Zone – Buyer’s Territory
The price is currently bouncing off the mid-channel zone, where the previous downtrend resistance overlaps with current channel support.
This confluence area is where smart money often enters after institutional accumulation at the base (around 3,270).
The bullish wick rejections around this zone signal a likely continuation toward the upper channel.
📈 Price Behavior & Market Psychology
What’s happening here isn't just lines and candles—there’s a psychological story unfolding:
Fear drove the market lower, respecting the bearish trendline until late June.
Hope and buyer aggression surged once the breakout confirmed.
Now we’re in the "belief" phase, where traders await confirmation of the new trend.
Many are watching for entry confirmation at support zones, and as long as fear doesn’t return (i.e., price breaking below 3,320), the structure remains valid.
🧭 Key Technical Levels to Watch
Level Type Price Range Notes
Major Support Zone 3,270–3,285 Key buyer zone, invalidation of bullish case below this
Channel Support 3,320–3,330 Retest zone after breakout, current active level
Mid-Channel Area 3,350–3,360 Decision zone – price may build momentum here
Channel Resistance 3,390–3,400 First bullish target, potential breakout area
Breakout Target 3,420–3,440 If price breaks channel resistance with volume
🧮 Trade Setup Ideas (Educational – Not Financial Advice)
🟢 Long Setup Option 1:
Entry: Upon confirmation above 3,340–3,345 with bullish engulfing candle or breakout bar.
Stop-Loss: Below 3,320 or slightly below channel support.
Take Profit: Partial at 3,390 (channel top), full at 3,420–3,440 breakout zone.
R:R Ratio: 1:2.5+ (highly favorable)
🔴 Bearish Scenario (Risk Management)
If price closes below 3,320 with momentum, expect a revisit to the 3,270–3,285 support.
This invalidates the current bullish channel structure and might bring in short-term bearish pressure.
Avoid long positions until new structure is formed.
🧠 Educational Takeaway for Traders
This analysis highlights the importance of:
Structure-based entries: Instead of chasing candles, you wait for confluence and entry triggers.
Multiple timeframe confirmation: Higher timeframes also show bullish bias, giving confidence to 4H trades.
Risk management: The current setup allows tight stop losses relative to potential reward, making it attractive.
By combining trendline breakouts, channel formations, and support/resistance flips, you significantly increase the probability of a successful trade.
📌 Final Thoughts:
Gold is giving traders a clean and structured opportunity. The market has shown strength through structure, not just random price spikes. With the ascending channel intact and price respecting support zones, there is a solid foundation for a bullish continuation toward 3,400 and beyond.
But as always, confirmation is key. Wait for price action to validate your bias, and never ignore risk management.

Gold Short Term OutlookYesterday, we saw gold reclaim the 200MA and push into the $3,352 resistance. Price remains supported above the $3,327 level, keeping the bullish structure intact for now.
As long as price holds above $3,327, bulls remain in control, and a breakout above $3,352 could open the path toward $3,364 and $3,383.
However, failure to hold above $3,327 may lead to another retest of $3,298, with deeper downside toward $3,270-$3,41 support zone if that level gives out.
📌 Key Levels to Watch:
Resistance:
$3,352 • $3,364 • $3,383 • $3,400
Support:
$3,327 • $3,298 • $3,270 • $3,241
