Technical analysis update: Gold (5th January 2022)On 3rd January 2022 gold dropped to 1798.380 USD which coincides with price retracement towards its 20-day SMA. Price halted its decline slightly above this technical indicator and then reversed back up. In our view this is very bullish and odds for a bullish breakout above the neutral zone (between 1750 USD and 1835 USD) are increasingly growing. We still remain bullish on gold and await resumption of a bullish trend once breakout above 1835 USD occurs. We would like to set a short-term price for gold to 1835 USD and medium-term price target to 1850 USD.
Technical analysis - daily time frame
RSI continues to develop a bullish structure. MACD is bullish too; indeed, it performed a bullish crossover on 27th December 2021. This strongly bolsters the bullish case for gold. Stochastic oscillates within the upper area which is bullish as well. DM+ and DM- show mixed conditions. ADX contains low value which suggests that the prevailing trend remains neutral.
Illustration 1.01
Picture above shows the daily chart of XAUUSD. It also shows that volume has been increasing since 27th December 2021. In our opinion, this signals that a bullish breakout is impending.
Technical analysis - weekly time frame
RSI is neutral. Stochastic is bullish and MACD is also bullish. Indeed, MACD performed bullish crossover above 0 points, similarly like on a daily time frame. DM+ and DM- are both declining and show mixed conditions. ADX has low value which further supports that prevailing trend is neutral.
Illustration 1.02
Chart above shows the weekly graph of MACD on XAUUSD. Recent crossover is clearly visible.
Support and resistance
Short-term resistance lies at 1835 USD and it acts as the upper bound of the neutral zone. Short-term support lies at 1750 USD and it acts as the lower bound of the neutral zone. Another important support lies at 1721 USD while the major support level lies at 1676 USD. Other important resistance levels are at 1916 USD, 1959 USD, and 1965 USD. Major resistance level lies at an all time high of 2075 USD.
Our most recent idea that shows possible setups on gold:
Bullish area is indicated above 1835 USD while bearish area is indicated below 1750 USD.
DISCLAIMER: This analysis is not intended to encourage any buying or selling of any particular securities. Furthermore, it should not serve as a basis for taking any trade action by an individual investor. Your own due diligence is highly advised before entering trade.
Goldfutures

Gold (XAUUSD) Weekly OutlookGold is holding above $1800 on the weak US dollar. The yearly inflation surged by 7%, the highest level since June 1982. The US dollar index hits multi-week lows at 94.62 despite the hawkish Fed. It regained above 95 level due to catch up in US treasury yields. Gold hits an intraday high of $1822.91 and is currently trading around $1822.
Global stock market- Bearish (Positive for gold)
US dollar index –Bearish (positive for gold)
US10-year bond yield- Bullish (Negative for gold)
DISCLAIMER: ((trade based on your own decision ))
<>

$XAUUSD #Gold To Breakout or Not - Full AnalysisOn higher timeframe Gold XAUUSD is consolidating and is reaching a point of possible breakout. Gold (XAUUSD) has been consolidating and has been trying to breakout of 1828-1830 level bit last week it failed to do that. Now because there is a lot of liquidity above 1830, Gold can try to create a fake breakout to the upside. So make sure you watch this level and also wait for a proper confirmation before taking a huge long position.
In this analysis we are revising higher time frame structure covering all bearish and bullish scenarios.
Trade what you see and ignore any hypes. Stay objective.
Rules:
1. Never trade too much
2. Never trade without a confirmation
3. Never rely on signals, do your own analysis and research too
✅ If you found this idea useful, hit the like button, subscribe and share it in other trading forums.
✅ Follow me for future ideas, trade set ups and the updates of this analysis
✅ Don't hesitate to share your ideas, comments, opinions and questions.
Take care and trade well
-Vik
____________________________________________________
📌 DISCLAIMER
The content on this analysis is subject to change at any time without notice, and is provided for the sole purpose of education only.
Not a financial advice or signal. Please make your own independent investment decisions.
____________________________________________________

GOLD FUTURES -Gold Tests Higher LevelsHey trades today I want to talk about GOLD FUTURES chart
Gold has made another run for hgihs, but is facing resistance
I think meybe going up to 1820.7
This is an article, not financial advice, always do your own research.
If you have any questions, you can write it in comments below, and I will answer them.
And please don't forget to support this idea with your like and comment, thank you

Don't Miss XAUUSD Breakout , You will Regrate LetterDon't Miss XAUUSD Breakout, You will Regrate Letter
Don't Miss XAUUSD Breakout, You will Regrate Letter
Don't Miss XAUUSD Breakout, You will Regrate Letter

Gold MCX setupOn hourly chart you can see double bottom formation.
Breakout levels are mentions in the chart.

Technical analysis update: Gold (21st December 2021)During the summer 2021 we expressed our belief that gold would end up trading within the range between 1750 USD/oz. and 1835 USD/oz. for an indefinite amount of time. We also noted that the bullish trend of higher degree was weakening and becoming neutral. Currently, gold trades slightly below 1800 USD/oz. Despite gold's sideways moving price action we continue to maintain a bullish view on gold, especially in the long-term. We expect an eventual bullish breakout from the neutral zone; and, at the same time, we assume such breakout will coincide with resumption of the bullish trend of higher degree. Additionally, we think this resumption of uptend will culminate in a new all time high for gold in 2022. Our view is supported by a combination of fundamental and technical factors.Main bullish drivers for gold are persistent high inflation in the U.S. and decrease in quantitative easing program (by the FED) which poses substantial threat to further rise in the general stock market. Additionally, we think the FED will be unable to raise interest rates three times in 2022. Instead, we expect the FED to backpedal on its current plans (as it did in its latest hiking cycle between 2015-2018).
Illustration 1.01
Illustration above shows the daily chart of XAUUSD. It also shows 20-day Simple Moving Average (blue) and 50-day SMA (red). Many false crossovers are observable which is indicative of the neutral trend.
Technical analysis - daily time frame
MACD remains in the bearish area. However, it points to the upside. We will observe it closely in the following days and we will watch out for bullish crossover above 0 points. We expect such a phenomenon to be accompanied by further rise in price. Stochastic oscillates in the upper area which is bullish but it currently points to the downside. RSI started to rise recently which is bullish. DM+ and DM- show bearish conditions. Though ADX remains relatively low.
Illustration 1.02
Illustration above shows the daily chart ADX based on XAUUSD. It shows relatively low value which suggests the prevailing trend is neutral.
Technical analysis - weekly time frame
MACD, RSI and Stochastic are all neutral. DM+ and DM- show bearish conditions but ADX contains low value.
Support and resistance
Closest support of tremendous importance sits at 1750 USD and breakout below this price level would force us to reassess our bullish notion. Next important support lies at 1721 USD while the major support level lies at 1676 USD. Closest resistance of high importance sits at 1835 USD. Other important resistance levels are at 1916 USD, 1959 USD, and 1965 USD. Major resistance level lies at an all time high of 2075 USD.
Illustration 1.03
Picture above shows the daily graph of XAUUSD. It depicts two alternative scenarios that current gold's setup allows.
DISCLAIMER: This analysis is not intended to encourage any buying or selling of any particular securities. Furthermore, it should not serve as basis for taking any trade action by individual investor. Your own due dilligence is highly advised before entering trade.

Weekly, Daily And H4 Analysis Bearish Momentum Coming.Weekly, Daily And H4 Analysis Bearish Momentum Coming . OANDA:XAUUSD Stronge Sell

gold futures chart , showing breakout gold futures chart, showing breakout
gold futures chart , showing breakout
gold futures chart, showing breakout
gold futures chart , showing breakout
gold plnbuy tp : 19200.00
follus me ....
i do my best to be able to suggest the best idea to you ....
there is a possibility of eror in all analyzis. but from the result of total trades, the level of success of the traders can be measured.

BUY GOLD AT 1446This is my next update on GOLD,which is consolidating for its 4 th wave,3rd Leg.(FLAT CORRECTION)
3 or C wave will bring this yellow metal to 1446 levels before MAY2022

Graphical analysis of gold in H1-Bullish after Breakout ResistanOnce the great ressistance of 1868.80 has broken, be prepared for a rise in gold which may surpass that month's 1888. currently the market is encompassed in an ascending triangle and we are waiting for the resistance to break to take a position in BUY, We are in H1 and we still have to wait to see what the price will do before defining our type of order

GC.1: Gold COMEXGold ready to up? We are waiting for a break the support with the volume, we are buying, to target the next resistance


XAUUSD Downside anticipated today into fibo extension / support!Price is holding the 0.236% fibo level as resistance, and we are looking for the downside to continue into the -27% extension support at 1750. The RSI is also holding below the 50% level, and we anticipate the downside to continue.

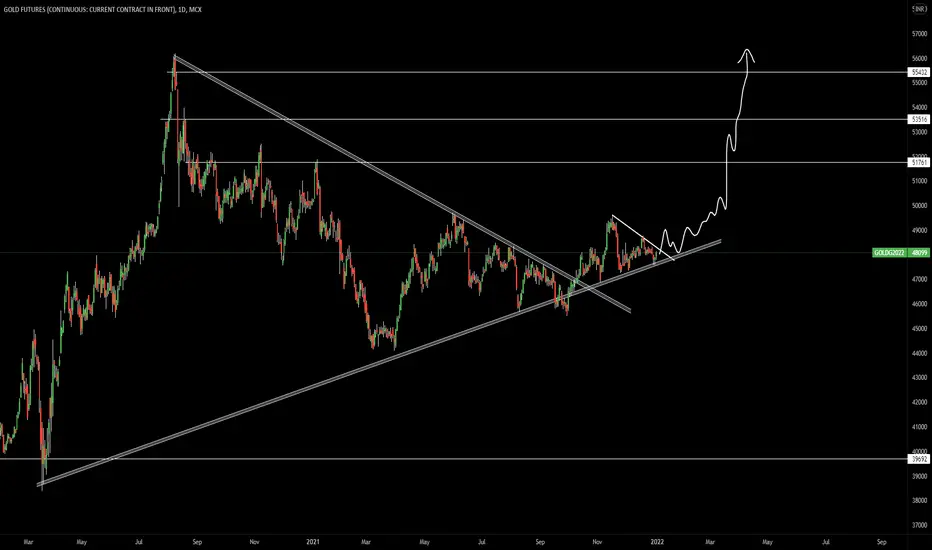
Gold Futures - Technical Levels
Gold tops out after printing a ATH back in August 2020 and then
Trades within a descending channel printing Lower highs and respecting the top and
bottom of the channel to contain the price action .
A strong break outside of the channel in August 21 followed
by a back test of the top of the channel in Sept and a healthy break
to the upside after Inflation reports at 30 year highs .
This leaves PA currently sitting at the POC, close above this region and we may test the next
resistance or close below and we have the marked supports in chart .
See my other chart on the DXY index ..linked below
Know your Invalidation and Trade your Plan , I hope this gives you some insight .


the destiny of gold for looong !$! Hi investors and traders !
i recomand to sell the gold in the next months (2 or 3 years) , so i made my decision based on fondamental analysis because we have many facts to support that decision , moreover it based also on tecnicale analysis which gave me a global vision for the next months
best wishes

Gold bears HOLDGold has correlated a lot with DXY in the past weeks. Expecting price to head back down from the daily trendline bounce

Technical analysis update: XAUUSD (25th August 2021)Gold took some step back after its breakout above 1800 USD. It currently trades around 1792 USD. We think upper bound of downward moving channel should be closely observed in the following days as it currently acts as immediate support for gold. Plunge below this level could lead to short term weakness. Although, we expect 1750 USD (previous support/resistance) to hold in case of further selling pressure. Stochastic is bullish. RSI continues to change back and forth from neutral to bullish on daily timeframe. MACD has bullish direction and we expect it to perform crossover above 0 points. We expect this to be very bullish for gold. In the big picture we remain bullish on gold with medium term price target of 1850 USD and long term price target of 1875 USD. Though, our price target for next 12 months is much higher at 2100 USD.
Prior developements from 10th August 2021:
Here we noted that price of gold was attractive for long entry. We also announced that we believe gold is near end of its struggle to move higher.
Disclaimer: This analysis is not intended to encourage any buying or selling of any particular securities. Furthermore, it should not serve as basis for taking any trade action by individual investor. Your own due dilligence is highly advised before entering trade.


Gold Near Bear MarketIf we get a break below the daily support level as we did with the H4 broken zone. The market is expected to decline below 1600.
Comment Like Share Follow
