Why are there "golden" times for gold now?Gold at the start of 2020 provides a lot of opportunities for earning. Jerks at $30-40 per day, which are also accompanied by almost equivalent corrective movements - this is the dream of any market speculator. So now the gold trade provides a real opportunity to "get rich."
We already wrote that buying gold in 2020 can become one of the best and most promising trading ideas.
In today's review, we would like to continue the thought and add a few additional arguments. The times in which we live here and now are quite interesting and unique. Negative interest rates of the Central Banks turn the situation in the economy upside down: you give money in debt, but they return to you a lower total. The yield curve on German government bonds is negative, on deposits in Switzerland - negative, and there are already dozens and hundreds of such examples.
For gold, this opens a new era in existence. After all, what is the main “Achilles heel” of gold as an asset? - the inability to bring guaranteed income, as they do, for example, stocks (in the form of dividends) or bonds (in the form of coupon income). So now, 0% of guaranteed profitability is no longer a disadvantage, but an advantage. At least an advantage over instruments with negative returns.
Moreover, the situation continues to develop in the direction of the growth of gold quotes. This week, real yields on US government debt (10-year treasury bonds) went into the negative zone. By the real rate of return, we mean the actual rate of return adjusted for inflation.
What do we have in total? We have a period of maximum favor for gold when its strengths against the background of geopolitical instability and the threat of a global recession are stronger than ever, and the weaknesses are practically nullified by the prevailing reality.
Finally, we note that one of the main generators of demand for physical gold in the world is China. Moreover, this demand is seasonal with a peak falling on the Chinese New Year, which, as you know, comes on the lunar calendar. In 2020, Chinese New Year will come on January 25th. That is, in the near future, gold is waiting for increased physical demand.
Thus, taking into account all the above and earlier, buying gold in 2020 is an excellent trading idea, the potential of which amounts to tens of percent. Recall that we consider the target of the current upward movement mark $1800.
Goldfutures

XAUUSDNicely done longs; of course, you got help from your friendly "Fed" (click on 1 yr tab to see what I mean www.federalreserve.gov) .
And this will help too:
Just sharing my view; not a trading call.. GL

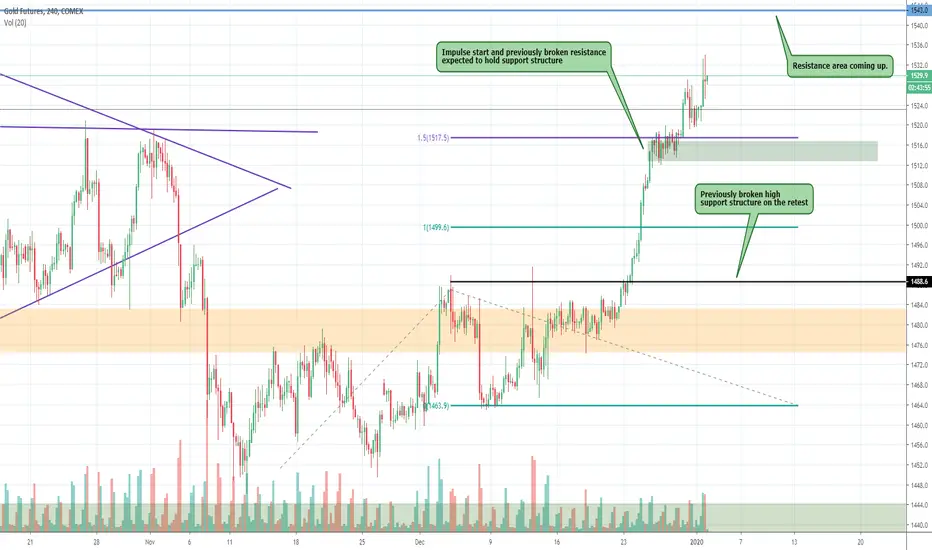
Gold get through target! next stop $1550? Pullback first...Gold has taken a shine to the holidays, while equities were strong, gold was not shy on the upside in the slightest. We were targetting the next resistance level at $1543 then $1550 ultimately. However on the rise up we saw that the volume through resistance levels was pretty weak so that cements our pullback idea a little more. The drop could bring price down to two main levels, based on the current $1530 stall area and $1543 resistance.
The first pullback area is $1510-1512 based on fibs and also the market structure impulse support. This is the more likely scenario of the two.
The next pullback level is at $1500-$1505 this is a little less likely, based on the cluster of fib levels. Ultimately we expect the upside to continue throughout the beginning of the year.
We are looking for a short term short idea, while a medium-term move higher on the commodity.
This idea is for educational purposes, it does not constitute as investment or trading advice. TRADEPRO Academy is not responsible for any market activity.
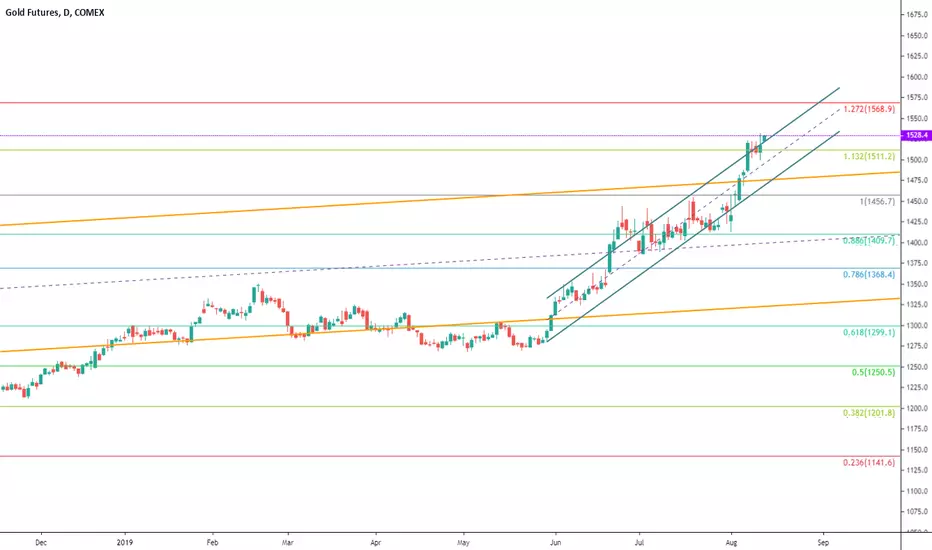
GOLD Near Term ProspectsLooks like we are having a nice rally in GOLD to finish out the c-wave of a multi-month (b)-wave.
Fundamentally, GOLD is in a correction, so expect tops to be spikers and bottoms to form over time. Thus, once this (b)-wave rally completes somewhere over 1520, expect price to get Monkey Hammered down in the following (c)-wave.

GC1! ANALYSIS (short term)Hi traders :) I'm Guario and this is a forecast about Gold Futures possible price action. As you can notice from the chart the metal is moving in a very tiny range along with a Stochastic divergence which gives us a bearish signal. This could be a very low risk and profitable operation although I suggest to place any entry order under the volumetric zone of 1479.8. Look at the chart for possible stop and target levels. Write me in the comments for any question, thought or critic. Good luck :)

Gold target up to $1500-1505. Market structure changing.Gold manages to hold support structure at $1464 which means that a higher low was made and the recent higher high suggests a change in bull structure. The upside seems to be opening up and the buyers are holding the structure. Buy volume has come in on swings higher. At this point we need to see the channel that we've drawn hold well on the support end and break through the resistance part.
Based on the Fib extension, the target for the upside move is $1500-1503 and for that to happen we need to see a new high occur in the coming week. So that means a move into $1490-95 on good volume then hold another higher low support point around $1480.
The rotations that have occurred at the $1464 support level were expected, based on the 4-hour chart that is where the impulse for the move into a new recent high started. So that is the last chance for the buyers to come in and move price higher.
Disclaimer: This trading idea is for educational purposes only, this does not constitute as investment or trading advice. TRADEPRO Academy is not responsible for any market activity.

Gold up to $1500? Trade war seems to think so...Gold was recently looking really bearish as trade news started to flush out of the US that did not look to good for the remainder of the year and the schedule they had planned. A double bottom formed on Gold at $1447-1450 where price rallied and nearly hit $1490 on its way up. The idea here is that there is strong resistance at $1485-1490 based on the low volume node from the year to date volume profile and the previous structure support that is going to act as resistance this time through. Should that level break we can see a move into the year to date POC and ultimately the $1500, the $1490 area will act as support on the retrace lower as well. This upside can be further opened on gold if the trade talks continue to deteriorate over the next few weeks and it puts downside pressure on the US equity markets. If this area holds resistance and there are intraday rotations at the level then we could see another move down to $1445-1450.
Disclaimer: This idea is for educational purposes only, this does not constitute as investment or trading advice. TRADEPRO Academy is not responsible for any market activity.


Gold: Technical & Fundamental SHORT to $1420Gold recently held the broken support as resistance at $1475 and moved lower well. There is an indication that it could slide through the support structure immediately at $1457 and then $1445.
Both Fundamentals and Technicals show a weaker gold market.
The wicks that formed at the $1475 resistance mean that the sellers are strong and not to mention the volume on the swings lower was strong than any rally. The market has recently formed a month-long downward channel that we expect to hold and break to the downside. The bottom end of the channel and target is $1420, below that a slip through could bring gold down to $1380.
From a fundamental standpoint, the gold price is correlated inversely to the USD. The USD price movement is based on the Federal Reserves Monetary Policy.
The Fed no longer has a mega dovish stance, and just because of that in the short term we can see a stronger USD into the new year. This puts downside pressure on the gold market. Helping the bears come in on strong volume.

Homerun 2020 Trade - Long $ALTAI continue to sit on the bid in $ALTA and smelling jackpot any 'day' in the Juruena gold belt. The focus with this is Brazil and those following in the Telegram will know I am very bullish on Brazil economy and BRL:
A lot of progress on all fronts, however, the thesis is threefold:
(1) ...Firstly updates coming from contracts which have been signed with a local Brazilian gold mining group, these are the guys who install plants and expectations are now by mid 2020 ALTA will be drilling 700,000 oz at a grade of 1.2 g/t. This is obviously great for revenue and will bring ALTA at least another $2m.
(2) ...On the Western part of the belt they have another project on the belt with one of the largest gold mining producers in the belt, from early reports I have access to from mapping show 4x1km in size, with an average grade of 1.5 g/t. Permits coming in H120, and drilling starts in H220.
(3) ...While the last leg to the stool is coming from another 60km project with Gold and Copper. Again mapping and surface samples show a lot of Copper with trenching in 2020. Fundraising here is the key to take this last leg into production.
For those tracking the previous idea and levels, we are sitting at the lows right on time for a next round of funding and a key volatility event at the 0.50 level. With that in mind I will adjust the exits lower to allow breathing room as we pass through the noise in this funding chapter and extend targets for the after the fact announcement;
On the Gold front the flows I have previously covered here:
Three fantastic products which has potential of a portfolio of 15m oz, smart money smells the change and is time to start pricing.
Best of luck all those tracking $ALTA and mining exposure Brazil; as usual keep the likes coming and feel free to jump in with any questions or comments on this one.

GOLD, Where to open Sell?..The price comes to the lower border of the Range Channel.
It's a huge probability that it will be hitten.
I will open the Sell position only if the H4 candle will cross the border and close under Mirror Level 1480.8.
Potential profit will be in 3...5 times bigger than risk.
Before to trade my ideas make your own analyze.
Write your comments and questions here!
No need to write it in PM.
Thanks for your support!

GOLD (Prj.Y19.P2.E1).Downtrend.There is TA and there is the Global Market.
It seems those central banks are stocking up on Gold stealthily and probably have obtain enough gold for the time being.
Who knows what their 6 months plans. Having said that, here is TA based on some key fib.levels, etc.
Downtrend heading for the Daily 200 EMA.
0.5 or 0.618 fib retracement will play a key role. Just like BTC, the golden zone, 06.18 is to be watched.
If you been watching Bitcoin, this chart looks very similar in terms of the top and its decent to the middle level where BTC burst back up (at the 0.618 level)>


Gold more Likely to be ShortMarket Makers
as we see gold has risen since a bounce off support in Aug. We see peak A sell off
a bit to make peak B which was followed by two bear candles that seemed to hit our
support from peak A making a large green candle closing above peak A. Therefore
a natural reaction to Buy thinking its a strong side to the upside.
Bullish upside was rejected and fell past the previous low.
Seeing candle D with a long top wick going above the previous low
tells us the move downward was unexpected and price was forced
upwards on Candle D to cover loses. thus bears can continue down
in a fashion that can be projected by support and resistance.
Now to determine the length and actual confirmation of
our short position we will use the 100 Range chart. To
determine which way our position will go we will use the
predetermined length of the Range Bar. seeing as how our
bar doesn't have much left to move before a new one forms
and is red. we will draw a red perpendicular bar from the
high to the predetermined length. This will give us a confident
look at what price may fall too. Now before we enter our
short forsure we must check all options including the possibility
of an upside move. Draw a perpendicular line from the bars low
to the predetermined high giving us another good price range if
our short was wrong.
-LNP Investmemts

NICE GOLD BUY OPPORTUNITYFORECASTING THAT GOLD MOVES UP FROM HERE AS WE ARE NOW AT THE BOTTOM OF THE ASCENDING PARALLEL CHANEL AND JUST OUTSIDE THE REGRESSION TREND (BUY SIGNAL). A MOVE BELOW TODAY'S LOWS MAY INVALIDATE THE THESIS. LOOKIG FOR GOLD FUTURES CONTRACT TO HIT INITIAL TARGET PRICE OF $1613
AMEX:JNUG AMEX:NUGT AMEX:GDX AMEX:GDXJ AMEX:GLD OANDA:XAUUSD FX_IDC:XAUUSD OANDA:XAUEUR TVC:GOLD NYSE:GOLD

GOLD GLD XAU - Monthly Chart - worst case scenario for bulls!I'm bullish on gold long term, so here's some high time frame analysis while Peter Schiff rattles off on Bitcoin again.
Bullish scenario - Price pumps up to 1600 and then finds support on 1575 (price has to close above 1575)
Bearish target - momentum and volume slows down bringing price to supports at 1425 and even as low as 1330. Excitement will increase at the discount and buyers will take charge again.

FAKE GOLD BARS FOUND! JP MORGAN..BUY STOCKS, SELL GOLD!After reading the fraud taking place within the GOLD market with fake GOLD bars being found with possibly thousands or maybe even millions more yet to be found, in our opinion, you are playing a very dangerous game buying GOLD now!
Read Story...JP Morgan gets hit with Fake GOLD bars...
Exclusive: Fake-branded bars slip dirty gold into world markets
www.reuters.com
TO BE ON THE SAFE SIDE, WE WOULDN'T TOUCH GOLD RIGHT NOW...NOBODY KNOWS HOW MANY FAKE GOLD BARS ARE FLOATING AROUND
THESE BARS ARE NOT ONLY FAKE, THE GOLD WITHIN THE BARS IS DIRTY GOLD, NOT PURE...THIS IS EXTREMELY ALARMING IN ITSELF!
CHINA IS PROBABLY TRYING TO TANK THE GOLD MARKET JUST LIKE THE WAY THE DIRTY COUNTRY MANIPULATES THEIR CURRENCY...AND CORRUPT DEMOCRATS, DIRTY POLITICIANS AND DUMB LIBERALS DON'T WANT TARIFFS ON CHINA..???? STUPID FOOLS...!!
IN 2012, A GUY WAS PRINTING FAKE BILLS. HE WAS PRINTING SO MANY, IF HE CONTINUED AND DIDN'T GET CAUGHT, HE COULD HAVE CRASHED THE WORLD ECONOMIES...READ..
www.businessinsider.com
THIS IS WHAT WE SEE HAPPENING NOW WITH FAKE DIRTY GOLD BEING DISCOVERED...CHINA IS FLOODING THE GOLD MARKET WITH FAKE GOLD BARS ...
JUST LETTING EVERYONE ON THIS BOARD KNOW...
BEST OF LUCK WITH YOUR TRADES!
DISCLAIMER
This website and our posts are for general information only. No information, forward looking statements, or estimations presented herein represent any final determination on investment performance. While the information presented in this website and our posts has been researched and is thought to be reasonable and accurate, any investment is speculative in nature. StockKid, and/or our agents cannot and do not guarantee any rate of return or investment timeline based on the information presented herein.
By reading and reviewing the information contained in this website and our posts, the user acknowledges and agrees that StockKid, and/or our agents do not assume and hereby disclaim any liability to any party for any loss or damage caused by the use of the information contained herein, or errors or omissions in the information contained in this website or our posts, to make any investment decision, whether such errors or omissions result from negligence, accident or any other cause.
Investors are required to conduct their own investigations, analysis, due diligence, draw their own conclusions, and make their own decisions. Any areas concerning taxes or specific legal or technical questions should be referred to lawyers, accountants, consultants, brokers, or other professionals licensed, qualified or authorized to render such advice.
In no event shall StockKid, and/or our agents be liable to any party for any direct, indirect, special, incidental, or consequential damages of any kind whatsoever arising out of the use of this website, our posts or any information contained herein. StockKid, and/or our agents specifically disclaim any guarantees, including, but not limited to, stated or implied potential profits, rates of return, or investment timelines discussed or referred to herein.

Bull trap or legit? More down Gold Will Like THIS CHARTIs this recovery a bull trap? or are we still going to drop? If you say you know- hell maybe you do because I don't. All I know is Gold is Gold and could run if the price goes up lol.


GOLD Futures | 1HOUR - Potential BUY | Classic GartleyNIce trading opportunities in GC 1 60 minute chart.
Potential Classic Gartley 222 BUY pattern.
254Pips of Profit Potential
1.91 Reward/Risk Ratio.

GOLD Fututres |1Hour |Classic Gartley SELL PatternClassic Gartley SELL pattern formed in GC1 1HOUR Chart.
143 pips of profit potential.
1.56 Reward/Risk Ratio
Wait for an entry confirmation inside the highlighted zone, because pattern is counter to the trend.
