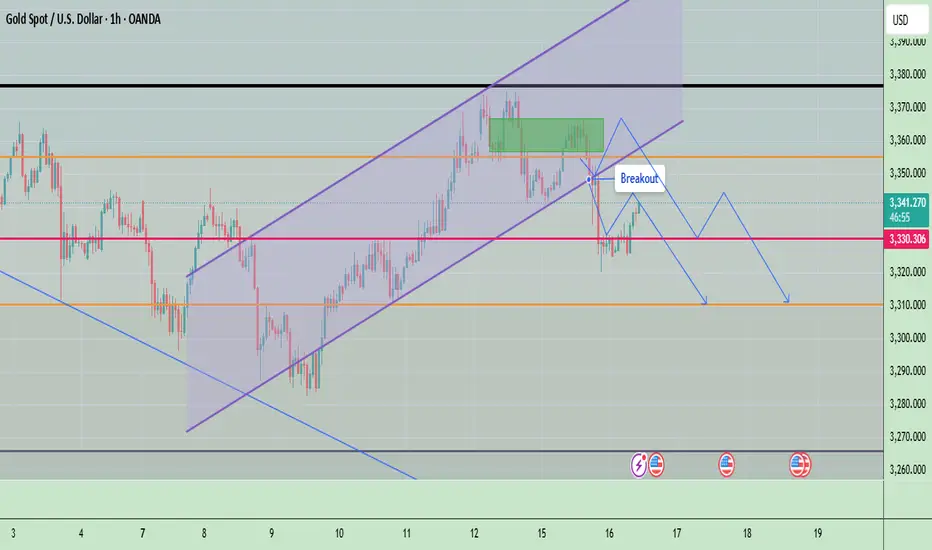
Gold Rejected Post-CPI – Bearish Momentum Building Below $3,365Gold is currently trading near $3,338, continuing to show signs of rejection after testing the key $3,365–$3,392 resistance zone. The market has reacted to the July 15 U.S. CPI release, and despite initial volatility, gold failed to break above its major diagonal trendline, forming a lower high, a strong technical sign of weakening bullish momentum.
If price breaks below $3,330, it could trigger a wave of selling pressure down to $3,303 and $3,248 in the coming days. Traders should monitor price behavior around these zones for short-term entry opportunities.
📌 Technical Breakdown
Resistance Zone:
- $3,365–$3,392 remains the critical ceiling where gold got rejected for the third time in recent sessions.
- This zone aligns with the top of the descending wedge, long-term black trendline.
Bearish Structure Forming:
- After multiple attempts, gold could not sustain above the resistance.
- A series of lower highs and a weakening bullish push suggest a bearish continuation is likely.
Support Levels to Watch:
- Immediate: $3,337
- Mid: $3,320
- Strong: $3,303 (0.382 Fib) and $3,293
- Final Target: $3,248 → $3,220 → $3,193
🔺 Bullish Invalidation Scenario
If gold manages a clean breakout and close above $3,392, this bearish setup will be invalidated. In that case, upside targets would include:
- $3,412
- $3,434
- $3,490 (macro trendline)
But at the moment, that seems unlikely unless driven by unexpected fundamentals.
Note
Please risk management in trading is a Key so use your money accordingly. If you like the idea then please like and boost. Thank you and Good Luck!
Goldideas
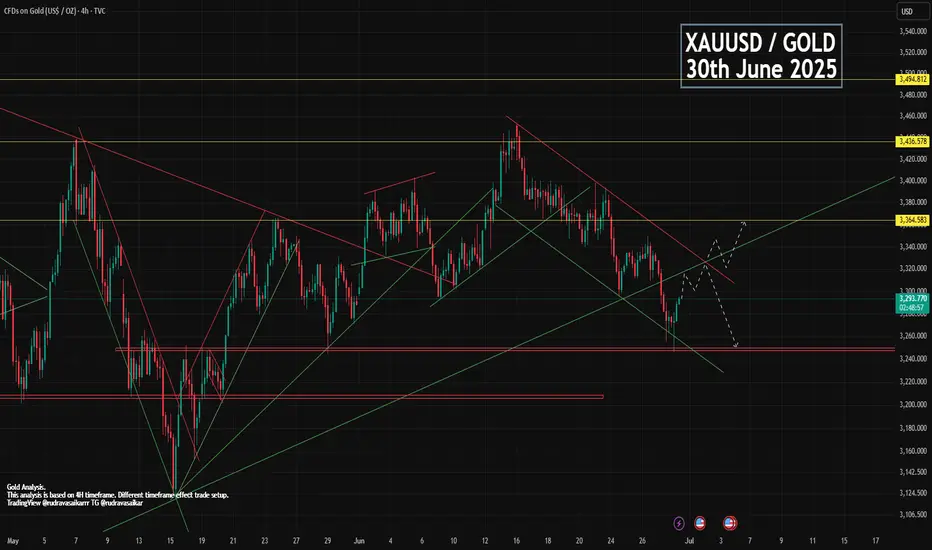
GOLD 30th JUNE - MONTH-END BULLISH OR BEARISHDue to war no update on gold, gold made bolt move downward. Slowly war has been becoming calm but no good news about it has been stopped completely. But you can see some great and correct structure in gold chart where you can find amazing entry and exit points. Gold lower was 1246 since then. Now gold is trading in bullish flag and expecting to breakout. And after breakout we can expect a big move upward.
Key point.
Support - 3248, 3272, 3289
Resistance - 3298, 3313, 3332, 3349
Comment and like for analysis. Love it then follow
Any Query Reach Us or comment down.
Follow for more updates.
Rudra Vasaikar Wishes You A Great And Very Amazing Trading Life. Trade Safe, Trade Right.
RISK WARNING 🔴 🔴 🔴
There is high risk of loss in Trading Forex, Crypto, Indices, CFDs, Features and Stocks. Choose your trade wisely and confidently, please see if such trading is appropriate for you or not. Past performance is not indicative of future results. Highly recommended - Information provided by Rudra Vasaikar/Pro Trading Point are for Educational purpose only. Do your investment according to your own risk. Any type of loss is not our responsibility.
HAPPY TRADING.
GOLD IS MOVING UPWARD.#xauusd #gold
Hello friends, very busy this days and also no well, had little health issue. But I was watching gold closely in that days too, caught some great moves. In previous analysis I mentioned gold will move upward, unfortunately gold breaked the pattern and moved down to 3394 after that we see again upward movement started. Again a bearish flag pattern is formed but due to tension in geopolitics gold is strongly bullish also yesterday was CPI news where dollar news was negative and dollar move down due to which gold pushed upward. Today gold opening was in gap in upward.
Today I am expecting to move upward and later on it will definitely come down to fill the gap near 3355. So our main target is now 3380-3391-3402.
Comment and like for analysis. Love it then follow
Any Query Reach Us or comment down.
Follow for more updates.
Rudra Vasaikar Wishes You A Great And Very Amazing Trading Life. Trade Safe, Trade Right.
RISK WARNING 🔴 🔴 🔴
There is high risk of loss in Trading Forex, Crypto, Indices, CFDs, Features and Stocks. Choose your trade wisely and confidently, please see if such trading is appropriate for you or not. Past performance is not indicative of future results. Highly recommended - Information provided by Pro Trading Point are for Educational purpose only. Do your investment according to your own risk. Any type of loss is not our responsibility.
HAPPY TRADING.
#gold #xauusd #xauusdtrading #goldtrading #goldanalysis #forextrading #forex #trendline #goldsignals #goldnews goldlatestanalysis #xauusdtradesetup #forextradingguide #fxgold
beyong technical analysis, chart patterns, gold, goldanalysis, goldideas, goldlong, goldsignals, goldlatestanalysis, goldtrading, goldtradingview, technical indicators, xauusdanalysis,

Gold Updates - XAUUSD May 15 ahead of news🔥 XAUUSD MARKET OUTLOOK – MAY 15, 2025
🧠 MACRO CONTEXT – CHAOS COOKING AT GMT+3
Today is a high-impact fundamental day with U.S. Unemployment Claims and Powell’s speech at 15:30. After CPI surprised to the downside yesterday, the market is recalibrating fast. Gold dropped aggressively into discount zones, but no clean structural reversal is confirmed.
This is a textbook trap environment. Expect:
– Fakeouts before confirmation
– Aggressive sweeps around equilibrium
– Delayed real moves until after NY volatility settles
No guessing. No chasing. Structure only.
📉 STRUCTURAL BIAS – MULTI-TF OUTLOOK
Daily Bias: Bearish – No BOS reclaim. Market remains under macro OBs.
4H Bias: Bearish – BOS confirmed below 3220. Price now reacting at lower OBs.
1H Bias: Neutral – Price is consolidating after tapping demand. No clean shift yet.
Conclusion: No bullish confirmation across major timeframes. Every bounce is suspect unless proven otherwise.
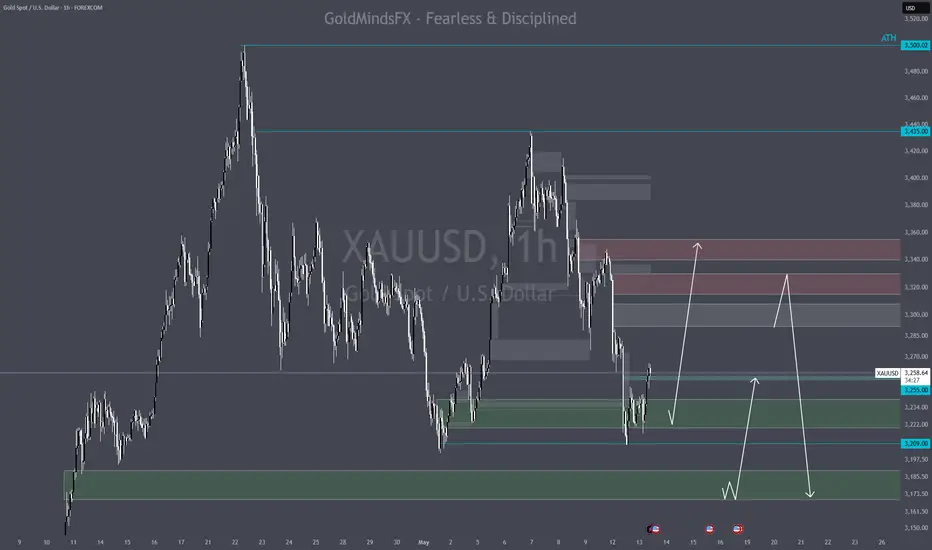
📍 GOLDMINDSFX REACTIVE ZONE MAP
🟢 DISCOUNT ZONES (For Confirmed Longs Only):
– 3120-3130 → Current active OB – reacting but unconfirmed
– 3100-3110 → Sweep + OB + EMA100 area
– 3050-3065 → Deep macro demand. Only valid on structural breakdown
🔴 PREMIUM ZONES (Watch for Trap Rejections):
– 3140–3155 → Internal breaker block – possible trap
– 3175–3190 → 1H supply zone + FVG – key reversal zone
– 3235–3255 → Premium OB – only valid post-news spike
🎯 STRATEGIC OUTLOOK
If price reclaims and holds 3176 → short-term structure may shift bullish
If 3110 is swept with CHoCH → buyers may attempt recovery
During news – we do nothing. Wait for confirmation, not confusion.
🔒 FINAL NOTE
Today is about reactive precision, not predictive bias.
Let Gold show its hand — then act. The second move is the real one.
“Structure is the setup. News is the trap.” 🎯
Patience is your profit today.
Drop a 🚀 Follow, comment, and share with your trading crew — if this helps your trading; let’s build a sharp Gold team
📌 Important Notice!!!
The above analysis is for educational purposes only and does not constitute financial advice. Always compare with your plan and wait for confirmation before taking action.

Gold Ideas - Tuesday May 13 ahead of CPI🧠 GOLD (XAUUSD) – Reaction Zones & Ideas – May 13, 2025
🔹 Bias: Bearish with Corrective Bounce - potential flip to bullish
Gold is currently retracing after reacting off the 3220 liquidity sweep zone. While price is moving upward intraday, the overall structure remains bearish on the higher timeframes. This is a corrective bounce unless we break decisively above 3297.
Today’s CPI release brings volatility risk. Price may spike into premium zones before reversing. Stay reactive — not predictive.
📊 Key 4H Reaction Zones
These are zones of interest where price may reverse or accelerate, depending on behavior inside.
🔴 Potential Sell Zones
• 3272–3287
Lower premium trap zone. Strong confluence area ahead of CPI.
Watch for early rejection if price spikes here.
• 3292–3308
HTF OB + FVG combo. If price drives here quickly, high probability of overextension fade.
• 3315–3330
Final upper sweep zone. Only valid if price breaks above 3300 aggressively during NY.
🟢 Potential Buy Zones
• 3220–3240
Confirmed sweep base. If price calmly retests, may provide second entry opportunity.
• 3170–3190
Deep HTF demand zone. Only in play if CPI triggers heavy downside movement.
⚠️ CPI Volatility Alert
CPI releases at 12:30 GMT / 15:30 GMT+3.
This event can trigger unpredictable price action — fakeouts, long wicks, and rapid reversals. Wait for structure. Let the market reveal the plan.
🧠 Final Note
The zone is never the trade.
The behavior inside is.
Drop a 🚀 Follow, comment, and share with your trading crew — if this helps your trading; let’s build a sharp Gold team
📌 Important Notice!!!
The above analysis is for educational purposes only and does not constitute financial advice. Always compare with your plan and wait for confirmation before taking action.
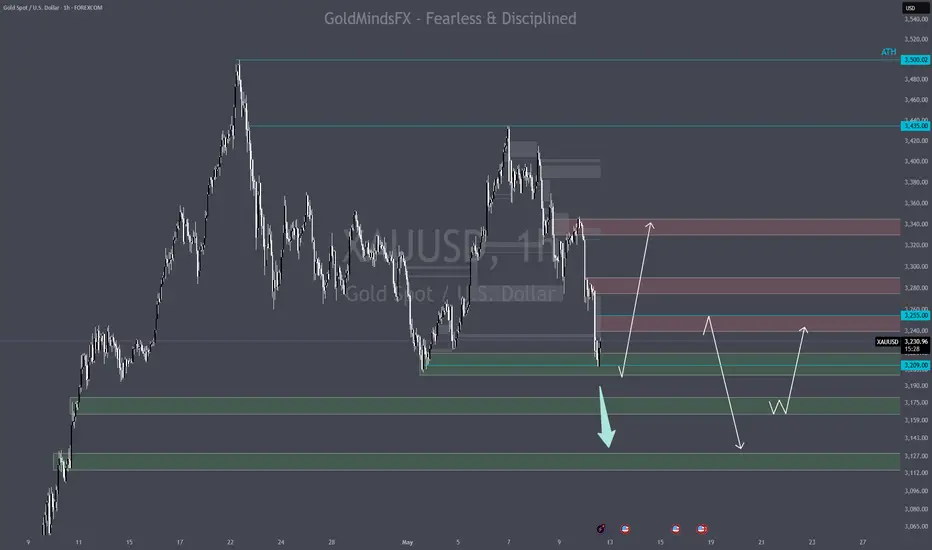
Gold Sniper Zones - XAUUSD May 12 Monday🔍 Key Intraday Demand Zones (Potential Bounce Areas)
🔵 3220–3200
Current area of interest with short-term absorption signs
May serve as temporary reaccumulation base if bulls defend this area
Ideal zone for intraday reaction → confirmation required before acting
🔵 3180-3165
Strong historical reaction level
Previously held structure before rally
If price breaks below 3209, this is likely where buyers will re-enter aggressively
🔺 First Major Intraday Resistance Zones
🔴 3240–3255
First clean lower high zone
Recent bearish pressure originated here
Any bounce toward this area may face sharp rejection
🔴 3275 - 3290
Former structure base, now flipped
Watch for potential NY spike into this region → rejection likely without a confirmed breakout
🧠 Final Words:
Gold isn’t in freefall. It’s moving between precision zones that traders either recognize — or get wrecked by.
At this stage:
Below 3209 = bearish pressure likely continues toward 3170s
Above 3255 = watch for liquidity sweeps and false confidence
🎯 Stay with structure. Ignore the noise. Let the market earn your entries.
Drop a 🚀 Follow, comment, and share with your trading crew — if this helps your trading; let’s build a sharp Gold team
📌 Important Notice!!!
The above analysis is for educational purposes only and does not constitute financial advice. Always compare with your plan and wait for confirmation before taking action.
Gold Daily Sniper Plan - XAUUSD May 5th 💥 May 5 XAUUSD Sniper Plan – "Bulls Bounce, Bears Breathe – Who Takes the Next Shot?" 🎯📉
Gold is caught in a battlefield. After a textbook bounce from 3204, price is pushing into premium zones — but momentum is limping, and ISM Services PMI (4:00pm) could trigger the next major move.
Forget guessing. This is where levels speak louder than noise.
🧭 Market Overview
HTF Bias (D1–H4): Bullish macro trend, but pullback in play after rejection from 3500 ATH
LTF Flow (H1–M15): Bullish relief structure, but losing steam below key supply at 3315+
EMA Confluence (H1): EMA5 climbing above EMA21, but flat near 3260 — indecision zone
Liquidity: Sell-side liquidity rests below 3200. Buy stops are stacking above 3300.
🔥 Monday News Catalyst
🕔 4:00pm ISM Services PMI (USD)
Volatility expected. Strong data = dollar strength = possible Gold drop. Weak data = relief rally toward premium.
🎯 Sniper Entry Zones (With Logic)
🔻 Sell #1 – 3315–3325
📍 H1–H4 OB + FVG + equal highs above
🧠 Ideal for post-ISM spike rejection setup
🔻 Sell #2 – 3345–3355
📍 Final OB before last lower high + clean imbalance
🎯 SL: 3360 | TP1: 3315 | TP2: 3292 | TP3: 3268
🧠 Swing rejection setup if bulls overextend
🟢 Buy #1 – 3210–3220
📍 M15 OB + EQ + May 2 internal HL
🎯 SL: 3190 | TP1: 3244 | TP2: 3265 | TP3: 3290
🧠 Structure-based bounce zone with clean PA reaction
🟢 Buy #2 – 3175–3185
📍 LTF demand + FVG + RSI oversold sweep
🎯 SL: 3155 | TP1: 3210 | TP2: 3240 | TP3: 3268
🧠 Reactive area if NY flushes price before recovery
🗺 Key Levels to Watch
Level Meaning
3268–3275 Internal resistance + imbalance zone
3292–3300 Liquidity magnet pre-sell zone
3315–3325 Major rejection area
3345–3355 HTF supply & final trap
3210–3220 Primary bounce zone
3175–3185 Trap setup + liquidity sweep zone
3050–3075 HTF OB → swing buy only
👁🗨 Eyes On:
Rejection from 3315 = sniper short entry zone
Rejection from 3275 = continuation risk
Break below 3210 → 3175–3185 becomes critical
Weak ISM = gold spike toward 3300+ (fade setup)
💬 Final Thought:
This isn’t “buy now, sell now” nonsense. It’s about structure, timing, and logic.
The cleanest setups come to those who wait — not those who chase.
🙏 Like this breakdown? Boost and follow us for sniper setups all week.
📌 Important Notice!!!
The above analysis is for educational purposes only and does not constitute financial advice. Always compare with your plan and wait for confirmation before taking action.

Gold 1H Outlook - XAUUSD May 4th 2025🔥 XAUUSD – H1 Outlook | May 4, 2025
Bias: ⚠ Short-term neutral to bearish — price reacting from a weak CHoCH + premium rejection.
Flow: Intraday trapped between 3240 demand and 3280–3300 supply. Next move decides the breakout.
🔎 Market Structure:
❗ Clean CHoCH + BOS sequence from 3285 → confirms bearish LTF momentum
🟠 Current HL attempt rejected off imbalance around 3268–3275
🔹 Structure still building under H4 LH (3315), supply remains in control unless flipped
🗝 Key H1 Levels (with confluence):
🔵 3233–3244 → Micro OB + FVG Support
🔄 Key short-term HL zone
⚡ RSI oversold bounce last touch
EMA5/21 zone → bounce risk
🟡 3268–3275 → FVG + OB + Last CHoCH Zone
🚩 This is the first sell POI
💧 Liquidity just above (equal highs)
Ideal for LTF short scalp if price rejects again
🔺 3288–3302 → H1–H4 Confluence Supply
🔥 Strong bearish OB + liquidity sweep area
🧱 Reaction zone for swing shorts (supply locked)
Confluence with premium fib retracement
🔻 3190–3200 → Extreme Demand Zone
🧲 Weak low + imbalance + discount OB
🔑 Watch for possible NY reversal trap if price collapses
💡 Plan:
We’re in the battlefield between weak HLs and greedy supply zones.
If 3275 rejects again → scalp sells back to 3240.
If 3240 fails → 3200 could be the "trap long" to flip everything.
🧠 Final Note:
Patience beats precision. Let the chart show its cards — no need to guess when liquidity does the talking.
🙏 Like this breakdown? Boost and follow us for sniper setups all week.
📌 Important Notice!!!
The above analysis is for educational purposes only and does not constitute financial advice. Always compare with your plan and wait for confirmation before taking action.
#XAUUSD #GoldOutlook #SMC #LiquidityHunt #SmartMoneyFlow

Gold Daily Outlook - XAUUSD May 4thXAUUSD Daily Outlook – May 5, 2025
Structure doesn’t lie. Gold is cooling off – but the real game might just be starting.
📊 Trend & Structure:
HTF Bias: Bullish (intact), but showing signs of exhaustion.
Daily Market Flow: Strong rejection from 3500 ATH → bearish correction underway.
Latest Daily Candle: Bearish with large upper wick – confirms aggressive selling after liquidity grab.
🔹 Key Daily Levels:
🔻 Premium Rejection Zone
Zone: 3475–3500
Confluence: Previous ATH + liquidity sweep + FVG + overextension
Note: Reversal confirmed. Sellers aggressively stepped in.
🔻 Active Imbalance Zone
Zone: 3375–3400
Context: Unmitigated bearish FVG formed after ATH rejection
What to expect: Intraday bounces possible, but mostly mitigation unless reclaimed.
🔹 Current Reaction Zone
Zone: 3220–3255
Structure: Micro CHoCH + fresh demand reaction + FVG fill
Note: Bulls defending here. Breakdown = lower retracement likely.
🔻 Key Mid-Term Support
Zone: 3050–3080
Reason: Daily demand + OB + prior BOS
Expectation: Strongest support if price breaks 3200 – ideal HTF reentry.
🔢 Fibonacci Extension Targets (if 3500 breaks)
Using impulse leg 2970 → 3500 with retrace to 3204.50:
Extension Level
Target Price
Commentary
1.0
3500
ATH (already hit)
1.12
3558
First extension zone, minor reaction possible
1.272
3610
Institutional TP1 zone
1.414
3660
Premium FVG / liquidity target
1.618
3730
Strong continuation target, reversal zone
1.786
3785
Final blow-off area, low probability without macro push
📊 Summary:
Gold reached a major milestone at 3500, swept liquidity, and is now in correction mode. As long as 3220–3255 holds, bulls may stage a short-term defense. However, failure to hold opens the door to 3050–3080, the next major structure zone.
Above 3500, use extension zones to track sentiment traps and profit-taking waves.
🧠 Final Thought:
From greed at 3500 to fear at 3200 — markets reset sentiment before the next move. Smart money isn’t emotional. Stay with structure, not ego.
🙏 Like this breakdown? Boost and follow us for sniper setups all week.
📌 Important Notice!!!
The above analysis is for educational purposes only and does not constitute financial advice. Always compare with your plan and wait for confirmation before taking action.
#XAUUSD #GoldOutlook #SMC #LiquidityHunt #SmartMoneyFlow

Gold Potential Ideas - April 23, ahead of Unemployment Claims📉 Macro Snapshot – April 24, 2025
Gold is currently trading at 3337, stuck in mid-structure between supply at 3384–3414 and demand stacked between 3255–3260 and 3224–3233.
🕒 Key time today: Unemployment Claims and Durable Goods Orders hit. High-impact potential.
Expectations:
🔺 Strong data → possible spike down into buy zones
🔻 Weak data → potential liquidity grab into sell zones first
No confirmed shift unless 3344 is broken or 3220 is reclaimed. This is a reaction day, not a breakout day. Let price come to levels — and strike with confirmation.
🔴 SELL ZONES
🔴 Sell Zone 1: 3384 – 3393
🧱 Confluences: HTF imbalance + OB + structural trap zone
🛡 SL: 3398
🎯 TP1: 3365
🎯 TP2: 3341
🎯 TP3: 3310
🔴 Sell Zone 2: 3410 – 3415
🧱 Confluences: Premium OB + liquidity grab zone
🛡 SL: 3421
🎯 TP1: 3384
🎯 TP2: 3362
🎯 TP3: 3330
🔴 Sell Zone 3: 3450 – 3457
🧱 Confluences: Untouched HTF OB + psychological stop hunt
🛡 SL: 3465
🎯 TP1: 3410
🎯 TP2: 3380
🎯 TP3: 3341
🟢 BUY ZONES
🟢 Buy Zone 1: 3274 – 3282
📍 Strong support pocket — demand + Asia low
🛡 SL: 3264
🎯 TP1: 3300
🎯 TP2: 3330
🎯 TP3: 3350
🟢 Buy Zone 2: 3250– 3260
🧠 Confluences: Deep OB + liquidity grab + structural base
🛡 SL: 3245
🎯 TP1: 3272
🎯 TP2: 3300
🎯 TP3: 3313
🟢 Buy Zone 3: 3224 – 3233
📍 HTF EQ + reactive demand
🛡 SL: 3218
🎯 TP1: 3255
🎯 TP2: 3280
🎯 TP3: 3303
📌 Important Notice!!!
The above analysis is for educational purposes only and does not constitute financial advice. Always compare with your plan and wait for confirmation before taking action.
📣 If this strategy sparked clarity, hit that like button and follow. 💛

Gold Ideas for April 23 ahead of Flash Manufacturing PMI News📉 XAUUSD Trade Plan – April 23, 2025
Market Overview:
Current Price Action: Gold is in a bearish corrective phase within a higher time frame bullish structure. The recent price action confirms a short-term bearish flow with CHoCH and BOS.
🔻 SELL ZONES
🔴Sell Zone 1: 3330–3341
✅ Valid: Previous support turned resistance
Structure: CHoCH origin on 1H
Watch for: NY spike into zone + LTF rejection
🔥 Most likely short setup today
🔴Sell Zone 2: 3362–3372
⚠️ Still valid, but far from price
Use only on aggressive NY volatility or PMI spike
Risk of price flipping bullish if broken
🔴Sell Zone 3: 3384–3393
❄️ Inactive for now – requires major news catalyst
HTF OB + imbalance, but distant unless price surges
Lower probability unless full reversal structure forms
🔴Key Level: 3410–3414
🔒 Reserved for extreme sweep/reversal
Only valid if all upper zones are taken out + price reaches premium zone with liquidity grab
🟢 BUY ZONES
🟢Buy Zone 1: 3290-3303
✅ Played perfectly – Price tapped and bounced
Structure: M30 OB base + liquidity sweep
Still valid for retests with M1–M5 confirmation
Primary intraday buy
🟢Buy Zone 2: 3272–3282
🟡 Valid but less likely today unless 3291 breaks
Stucture: FVG fill + minor OB
Good for continuation if NY fakes out into discount
🟢Buy Zone 3: 3224–3233
🧱 Strong HTF EQ zoneReactive demand with imbalance
Use for NY deep pullback + structure reclaim
🟢Buy Zone 4: 3150–3190
⚠️ HTF only – not expected to trigger today
Long-term reversal zone, use with caution unless major drop happens
🔍 FINAL STRATEGY NOTES
Watch 3318–3330: Mid-structure, key battle zone → avoid entries here
Best plays:
→ Sell from 3330–3341 if rejection forms
→ Buy retest of 3291 ONLY with clean confirmation
Avoid counter-trend limit orders — wait for BOS/CHoCH on LTF
📌 Important Notice!!!
The above analysis is for educational purposes only and does not constitute financial advice. Always compare with your plan and wait for confirmation before taking action.

Gold Ideas April 16 ahead of Retail sales & Powell's speech🟡 XAUUSD – 16 April 2025 Trading Ideas
Timeframe: 1H (with 5m-15m confirmation)
Bias: Cautiously Bearish – Waiting for retrace or trap setup
Market Context:
Gold exploded during Asian session—currently hovering above 3280, showing early weakness
Price is extended deep into premium, with key resistance around 3290–3298
A retracement into 3,261–3,245 is likely, especially ahead of NY news
Lower timeframes showing slowdown & FVG gaps waiting to be filled
🔻 Sell Zone (Riskier Pre-News Entry)
Entry: 3288 – 3292
SL: 3300
TP1: 3270
TP2: 3250
TP3: 3240–3235
Reasoning:
Price swept 3280s liquidity
Frankfurt may fake breakout highs before NY data
Heavy imbalance and clean downside path to 3245 if structure breaks
Look for M-pattern / bearish engulfing on 5m
🔼 Buy Zone (Healthier Pullback Setup)
Entry: 3261 – 3245 (watch for reaction)
SL: Below 3230
TP1: 3280
TP2: 3292
TP3: 3300–3310 (if news aligns)
Reasoning:
Untapped demand + FVGs on 1H/5m
Clear signs of previous breakout zone
Needs bullish confirmation—no blind buys
📌 Important Notice!!!
The above analysis is for educational purposes only and does not constitute financial advice. Always compare with your plan and wait for confirmation before taking action.

Gold Ideas for 14th of April📊 Market Structure Overview
Trend Analysis: Price has reached premium levels, suggesting a potential for short-term pullbacks within the broader bullish trend.
Key Levels: Monitoring for breaks below 3025 to signal a shift in macro bias.
🔑 Key Technical Zones & Confluences
Premium Sell Zone: 3248–3268, characterized by unmitigated order blocks and potential liquidity traps.
Internal Demand Zone: Around 3180, aligning with trendline support and Fibonacci retracement levels.
Strong FVG & Order Block: 3137–3145, indicating a significant area of interest for potential reversals.
📝 Plan of Action
🔻 Sell Scenario 1
Entry: 3242 – 3248
Stop Loss: 3255
Take Profits: TP1: 3215 | TP2: 3188 | TP3: 3160
Rationale: Anticipating rejection from fresh M15 order block with liquidity sweep above 3242. RSI divergence noted as additional confluence; confirmation required on M5.
🔻 Sell Scenario 2
Entry: 3260 – 3268
Stop Loss: 3275
Take Profits: TP1: 3235 | TP2: 3200 | TP3: 3165
Rationale: Targeting final premium order block with unmitigated H1 zone and imbalance. Ideal for NY session traps; look for bearish engulfing patterns.
🟢 Buy Scenario 1
Entry: 3180 – 3172
Stop Loss: 3165
Take Profits: TP1: 3205 | TP2: 3230 | TP3: 3250
Rationale: Confluence of trendline and M30 order block with internal structure support. Requires bullish price action and CHoCH on M5 for confirmation.
🟢 Buy Scenario 2
Entry: 3137 – 3142
Stop Loss: 3129
Take Profits: TP1: 3180 | TP2: 3205 | TP3: 3240
Rationale: Major imbalance and H1 order block with RSI confluence. Look for bullish engulfing or aggressive CHoCH on lower time frames.
📌 Key Zones Recap
Premium Sell Zone: 3248–3268
Internal Demand Zone: 3180
Strong FVG & OB: 3137–3145
Critical Support: 3025 (break indicates macro bias shift)
📌 Important Notice!!!
The above analysis is for educational purposes only and does not constitute financial advice. Always compare with your plan and wait for confirmation before taking action.
📣 If this strategy sparked clarity, hit that like button and follow our community for more in-depth ideas. 💛

Gold Ideas April 11th - Brand new ATH 3220 & PPI✨ MARKET CONTEXT:
Gold is currently testing the 3220 supply ceiling after a massive bullish leg. Liquidity has been swept above March highs, and PA is now in a highly reactive zone. If price rejects here, we look for imbalances to be mitigated below before continuation.
🙌Wait for clear PA confirmation on all entries (5-15m structure shift, engulfing candles, liquidity grabs).
If PPI news hits hard, we might see manipulation — trade after the first 15–30 min.
Don’t overtrade. Let the levels come to you.
Goldie loves the drama. You love the sniper entries. 💅🏽🎯
🎯 Key Reversal Zones for Friday (Potential Pullback if News Hits or Profit Taking Begins):
1. 3190–3195: Minor mitigation zone for continuation longs.
2. 3183–3189: Ideal for sniper entries on a juicy dip.
3. 3170–3175: Key mid-structure retest + liquidity zone.
4. 3148–3155: Full pullback area if market turns bearish post-news.
Keep these levels on your radar, especially if Friday gets volatile. Don’t chase the hype—let price come to you.
🧵 Key Imbalance Refill Zones:
- 3195–3203: First scalp area, high confluence.
- 3178–3184: Strong impulse base.
- 3162–3169: Ideal sniper entry with bullish PA.
- 3148–3154: Big daddy support (but news sensitive!).
📌 Important Notice!!!
The above analysis is for educational purposes only and does not constitute financial advice. Always compare with your plan and wait for confirmation before taking action.
📣 If this strategy sparked clarity, hit that like button and follow our community for more in-depth ideas. 💛

Gold ideas/scenarios for Tuesday April 8th
📉 Intraday Bias: Bearish below 2980–3000 supply
🔻 SELL SCENARIOS
🟥 SETUP 2: Liquidity Spike Short
📍 Entry: 3010–3015
🧠 Why: Liquidity hunt above 3000 + bearish FVG
🎯 TP1: 2975
🎯 TP2: 2940
🛑 SL: 3019
🟥 SETUP 3: EMA Fade Shot
📍 Entry: 3035–3040
🧠 Why: EMA50 touch + trendline confluence on H1
🎯 TP1: 2990
🎯 TP2: 2950
🛑 SL: 3046
🟩 BUY SCENARIOS
🟩 SETUP 1: Discount OB Bounce
📍 Entry: 2945–2955
🧠 Why: M30 OB + FVG + golden fib (0.618)
🎯 TP1: 2990
🎯 TP2: 3030
🛑 SL: 2938
🟩 SETUP 2: Demand Retest Play
📍 Entry: 2905–2915
🧠 Why: H4 OB + prior bounce structure
🎯 TP1: 2960
🎯 TP2: 3000
🛑 SL: 2895
🟩 SETUP 3: Deep Demand Sweep
📍 Entry: 2885–2895
🧠 Why: HTF demand zone + imbalance + psych level 2900
🎯 TP1: 2950
🎯 TP2: 2980
🛑 SL: 2878
⚔️ Key Levels to Watch
🔸 2980–3000 → OB resistance
🔸 2960–2950 → Reaction zone
🔸 2915 / 2890 → Liquidity pools
🔸 3045 → Bearish bias invalidation
🔸 2880 → Final boss demand
🧠 Execution Tips
Let price come to you — snipers don’t chase.
Watch M1–M5 for CHoCH or clean PA shift.
Trade the setup, not your FOMO.
💬 Gold might throw tantrums, but your plan doesn’t have to.
📌 Important Notice!!!
The above analysis is for educational purposes only and does not constitute financial advice. Always compare with your plan and wait for confirmation before taking action.
📣 If this strategy sparked clarity, hit that like button and follow.
Let’s build a community that doesn’t gamble — we execute.
No panic. No rush. Just structure, strategy, and savage entries. 💛

Gold chart - Daily ideas for April 7th🔸 Market Snapshot
📉 Gold pulled back sharply on Friday after a surprisingly strong U.S. NFP report, which added 303,000 jobs — well above forecasts. This cooled immediate expectations for aggressive Fed rate cuts and pushed Treasury yields and the dollar higher, triggering a short-term correction in gold prices.
📊 After printing a fresh all-time high at $3168 last week, this drop is seen as a technical retracement, not a trend reversal. Powell’s speech echoed a cautious stance, reiterating a data-dependent path, which leaves room for renewed upside if inflation softens or geopolitical tensions escalate.
🌍 With Middle East tensions still brewing and demand for safe havens intact, many traders now eye 3015–2975 as a key demand zone for potential reaccumulation — setting the stage for the next leg toward 3200 and beyond.
🟩 BUY SCENARIO 1
📍 Entry: 3020–3015
🧠 Confluences: Bullish M15 FVG + Trendline Support + RSI Reversal
TP1: 3086
TP2: 3130
SL: 3008 (below swing low + OB invalidation)
📌 Look for bullish M5 CHoCH or strong reaction wick for sniper entry
🟩 BUY SCENARIO 2
📍 Entry: 2975–2965
🧠 Confluences: Untapped M30 OB + Imbalance Zone + D1 Demand
TP1: 3050
TP2: 3086
SL: 2958 (below OB + psychological 2960 level)
⚠️ Only valid if 3010 breaks and flushes into this zone. Let the price come to you.
🔻 SELL SCENARIO 1
📍 Entry: 3107–3115
🧠 Confluences: M15 OB + Unmitigated FVG + CHoCH after LH
TP1: 3030
TP2: 3010
SL: 3119 (above OB + intraday wick room)
📌 Look for M1–M5 bearish confirmation or rejection wick at OB
🔻 SELL SCENARIO 2
📍 Entry: 3135–3142
🧠 Confluences: Strong OB Zone + Premium Liquidity Grab + Equal Highs
TP1: 3086
TP2: 3020
SL: 3148 (above liquidity + OB invalidation)
⚠️ Still valid if price rallies fast – bonus confluence if RSI shows divergence
📌 Key Levels Recap:
🔹 3142 – Premium OB Zone
🔹 3115 – Intraday LH Rejection
🔹 3020 – Bullish FVG + Trendline Support
🔹 2965 – Deeper Demand Zone
🔹 2958 & 3148 – Final SL Protection Areas
📌 Important Notice!!!
The above analysis is for educational purposes only and does not constitute financial advice. Always compare with your plan and wait for confirmation before taking action.
If you find the ideas contribute to your views on the market be kind to press boost🚀/like button. Your support is appreciated.

Snipper plan ideeas before NFP and Powell Speech - April 4th📌 Macro & Market Context
Gold remains in a strong HTF bullish market structure, with recent highs around $3,160 acting as a key resistance.
NFP data, Unemployment Rate and Powell's speech will add increased volatility later today.
The market is currently correcting after liquidity grab above $3,160, showing signs of distribution.
📊 Market Structure Overview (4H & 1H)
Bullish/Sell bias remains neutral, but a temporary retracement is underway.
Premium supply zones are positioned above $3,140–$3,160.
Discount demand zones are around $3,080–$3,050.
📍 Setup 1 SELL
Scenario: Bearish retest to this zone
Entry: $3,135 - $3,145 (if price returns to this zone).
Confirmation: Rejection wick + Bearish Engulfing on 15M or 5M.
Stop Loss: Above $3,153
TP1: $3,125
TP2: $3,110
TP3: $3,090
📍 Setup 2 SELL
Scenario: Wait for price to push back into 3,091–3,095 zone (M5 imbalance retest).
Entry: 3091-3095
Confirmation: Entry on rejection + BOS or CHoCH M1/M5.
Stop Loss: Above 3,096
TP1: 3066
TP2: 3054
TP3: 3040
📍 Setup 2 BUY
Scenario: If price retraces to key demand zones $3,080–$3,070, look for a long entry.
Entry: Buy at $3,080–$3,075.
Confirmation: Liquidity grab + Bullish engulfing on LTF (1M, 5M).
Stop Loss: Below $3,070.
TP1: $3,100
TP2: $3,120
TP3: $3,135
📍 Setup 3 BUY
Scenario: Bounce/reversal confirmation near 3,054 (last demand block + imbalance edge).
Entry: Buy at 3048-3055
Confirmation: Entry only if M1/M5 shows CHoCH + volume.
Stop Loss: Below 3048
TP1: 3085
TP2: 3115
TP3: 3128
📌 Important Notice!!!
The above analysis is for educational purposes only and does not constitute financial advice. Always compare with your own plan and wait for confirmation before taking action.
If you find the ideas contribute to your views on the market be kind to press boost🚀/like button. Your support is appreciated.

Waiting for a healthy pullback or FOMO push to 3150+?🔸 News Update: Geopolitical Turmoil Boosts Gold’s Appeal 🔸
The Russian Ministry of Defense reported missile strikes on Ukrainian SBU and special operations units, further escalating tensions in Eastern Europe. This, combined with China’s continued gold hoarding and a weaker USD, has kept gold’s bullish momentum intact.
🟥 Sell Setup (Liquidity Trap Short)
Entry Zone: $3,121 – $3,125 (Liquidity Grab + HTF Supply)
Trigger: M5/M15 Bearish CHoCH + Weak Bullish Reaction
SL: Above $3,130 (Invalidation Level)
TP1: $3,100 (First Target)
TP2: $3,085 (Deep Profit Zone)
TP3: $3,074 (Full Breakdown)
📌 Why?
Liquidity Hunt Potential → Market may fake out longs before reversal
Bearish Order Flow Zone → Major supply area where sellers are active
HTF Expansion Exhaustion → Price needs to cool off before further gains
🟥 Sell Setup 2 (Momentum Reversal – Only If Confirmed)
Entry Zone: 3,150 – 3,155 (Extreme Supply Zone)
Trigger: Bearish CHoCH + FVG reaction
SL: Above 3,160
TP1: 3,120
TP2: 3,100
TP3: 3,073
📌 Reasoning:
Extreme premium level where HTF supply could react
Only valid if price extends to this level without pullback
Ideal for a larger reversal if bullish momentum fades
🟢 Buy Setup 3 (Intraday Continuation Play – If $3,100 Rejects)
Entry: $3,092 – $3,094 (LQ sweep + minor demand zone)
Trigger: M1/M5 CHoCH + bullish rejection wick
SL: Below $3,090
TP1: $3,100
TP2: $3,108
TP3: $3,117
📌 Why This Zone?
If NY sweeps $3,100 liquidity and retraces, $3,092 – $3,094 could be a quick buy-the-dip area.
Only valid if the previous demand structure remains intact.
Ideal for short-term scalps rather than a deep retrace buy.
⚠ If price drops aggressively below $3,090, don’t force the buy—$3,083 – $3,087 is the next stronger zone.
🟢 Next Fresh Buy Setup (If Price Dips Again)
Entry Zone: $3,067 – $3,070 (Untapped demand + imbalance fill)
Trigger: M1/M5 CHoCH + bullish confirmation
SL: Below $3,064 (Liquidity protection)
TP1: $3,090 (Reaction level)
TP2: $3,108 (Liquidity grab target)
TP3: $3,120+ (Continuation move)
📌 Why This Zone?
Previous NY session left unmitigated demand here.
If price pulls back, smart money will likely buy from this area.
Gold still bullish – this is the next potential buy-the-dip zone.
⚠️ If $3,067 fails, deeper support at $3,055 – watch for a strong reaction there!!
✅ Key Takeaways
✔ Gold remains bullish above $3,074 – buy dips, but avoid FOMO.
✔ A liquidity grab below $3,080 could be the next major long opportunity.
✔ Sells are scalps only – favor longs unless $3,067 breaks.
📌 Important Notice!!!
The above analysis is for educational purposes only and does not constitute financial advice. Always compare with your own plan and wait for confirmation before taking action.
Good luck on the market today.

GOLD 12H CHART ROUTE MAP ANALYSIS FOR THE WEEK12H GOLD Chart: Updated Analysis and Strategic Outlook (10the Feb 2024)
Hello Traders,
Here’s the latest 12H GOLD chart update, featuring a detailed review of recent movements and actionable insights for the upcoming market sessions. Our diligent tracking since October 2023 has consistently delivered 100% target accuracy, as evidenced by the marked Golden Circle areas on the charts. Let’s dive into the highlights and what lies ahead.
Previous Chart Review
* Entry Level 2814: ✅ DONE
* TP1 2858: ✅ DONE
* The price broke above the resistance level 2858 and reached a new ATH at 2886 last week.
* EMA5 held above 2858, which fueled the strong bullish push during Friday’s NFP release.
What’s Next for GOLD? Bullish or Bearish?
The price is currently consolidating around 2858, with EMA5 playing a crucial role in determining the next trajectory.
Resistance Levels: 2903, 2948, 2993
Support Levels (Activated GOLDTURN Levels):
2813 (Critical Weighted Level)
2770 (Critical Weighted Level)
2710 (Critical Weighted Level)
2664 (Major Support Level)
2599 (Lower Major Demand Zone and Retracement Range)
EMA5 Behavior (Red Line):
* Currently sitting below TP1 (2858) but indicating sustained bullish momentum.
* EMA5’s crossing and locking above or below key levels will signal the next move:
Bullish Scenarios:
Scenario 1: If EMA5 crosses and locks above TP1 (2858), expect a bullish rally toward 2903.
Scenario 2: If EMA5 crosses and locks above TP2 (2903), the next target is 2948.
Scenario 3: A further cross and lock above 2948 could drive the price to 2993.
Bearish Scenarios:
If EMA5 fails to sustain above TP1 (2858) and resistance levels hold, expect a pullback toward support zones:
Scenario 1: A cross and lock below Entry (2813) could lead to a decline toward 2770.
Scenario 2: A further drop below 2770 may target 2710 as the next support level.
Scenario 3: Continued bearish momentum could push the price toward 2664 and, ultimately, 2599 (Retracement Range).
Short-Term Strategy:
Anticipate possible reversals at weighted GOLDTURN levels 2813 and 2770.
Leverage 1H and 4H timeframes to capture pullbacks around these levels.
Target 30–40 pips per trade, focusing on shorter positions for effective risk management.
GOLDTURN levels provide reliable bounce opportunities, allowing you to buy at dip levels.
Long-Term Outlook:
Maintain a bullish bias while using pullbacks as buying opportunities.
Buying near key support levels ensures better entry points and mitigates risks, avoiding the pitfalls of chasing tops.
Final Thoughts:
Trade with precision, discipline, and confidence. Our accurate, multi-timeframe analysis equips you to navigate the market effectively. Stay updated with daily insights to remain ahead of market trends.
We appreciate your support! Don’t forget to like, comment, and share this post to help others benefit.
Best regards,
📉💰 The Quantum Trading Mastery Team

GOLD TRADING POINT UPDATE > READ THE CHAPTIAN Buddy'S dear friend 👋
SMC Trading Signals Update 🗾🗺️ Gold Traders SMC-Trading Point update you on New technical analysis setup. Gold Traders Gold Ready for Down 👇 ⬇️ List day take a breakout up trand line. 4H Time Frame. Today 💪 test supply rejected point below 👇 trend 📉 FVG) level. 2892 close below 👇 2864 - 28833
Key Resistance level 2920
Key Support level 2892 - 2864 - 2833
Mr SMC Trading point
Pales support boost 🚀 analysis follow)

GOLD TRADING POINT UPDATE > READ THE CHAPTIAN Buddy'S dear friend 👋
SMC Trading Signals Update 🗾🗺️ Gold traders SMC trading point update you on New technical analysis setup for Gold 🪙 Gold still holding rejected Resistance level 2956 2943 Gold Traders SMC-Trading Point ☝️ want to Short trend 📉. Close below 👇 ⬇️ up trand that weekend expect it Short Trade 2834
Key Resistance level 2943 + 2955
Key Support level 2876 - 2864 - 2833
Mr SMC Trading point
Plaes support boost 🚀 analysis follow)

GOLD TRADING POINT UPDATE > READ THE CHAPTIAN Buddy'S dear friend 👋
SMC Trading Signals Update 🗾🗺️ Gold traders SMC trading point update you on New technical analysis update on gold 🪙 Gold still going to bullish trend 📈 Gold Traders Gold Ready for a new ATH 3010$. This weekend. I'm going to bullish trade on Gold. Today 💪 Take a Strong breakout Resistance level 2947 2954 back 🔙 Tast diamond zone support level. 2923 Now Gold. Don't wait more Sell Good luck 🤞🤞
Key Resistance level 2954 + 2961 + 2987 3010
Key Support level 2940 - 2930 - 2924
Mr SMC Trading point
Pales Support boost 🚀 analysis follow)

GOLD TRADING UPDATE >READ THE CHAPTIANBuddy'S dear friend 👋
SMC Trading Signals Update 🗾🗺️ Gold traders SMC trading point update you on New technical analysis setup Gold take a oderbolk going to back up trand 😜 (SMC) Gold today test diamond 💎 zone 2730 support level akvite buying padding orders I will see again for buying higher level 2785 )
Key Resistance level 2763+ 2771 + 2785
Key support level 2730 + 2720
Mr SMC Trading point
Support ✨ My hard analysis setup like And Following 🤝 me that star ✨ game 🎮
