GOLD SELLHello, according to my analysis of the gold market, we notice the formation of an ascending channel. However, despite that, it is only a corrective wave. We may see a decline from the 2080 area, which is a correction to the Fibonacci golden ratio of 61%. Good luck to everyone
Goldintraday

GOLD SELLWelcome . Analysis of the gold market. On the clock frame. Everything is explained in the analysis. Please comment if there is ambiguity in the analysis. Or you didn't understand anything. I will be happy to respond. Good luck everyone
Anouare

The opportunity to go long gold is here againDear friends, gold’s short-term rebound has reached a maximum of around 2394, approaching the 2400 mark again. Then gold seemed to feel a little exhausted, so it failed again and chose to fall back. Gold is currently trading around 2381, so does gold still have room to conquer 2400 or even higher?
Although gold has stopped below the 2400 level many times in the short term, gold has shown great resilience during the decline. And as gold continues to step back to test support, the lows below are gradually moving upwards, continuously consolidating and building up the support strength below. With continuous testing, short-term support has now moved up to the 2380-2375 area. Therefore, I feel that the short-term pullback of gold happens to be a relatively healthy trend, laying a solid foundation for sprinting to the 2400 position, and it is even possible to hit a higher position.
Therefore, in terms of trading, I still believe that the short-term pullback of gold will be a good opportunity to go long on gold. I still maintain the main trading rhythm of going long on dips. In the short term, I will mainly focus on the support of the 2380-2375 area below. I share detailed trading ideas and trading strategies every day, hoping to help all my followers continue to make profits in the market! If you are worried about missing trading opportunities, you can follow the channel at the bottom of the article to get detailed trading signals, trading strategies, trading lots, and TP and SL in the first time.

Gold’s 13th consecutive victory, continue to short goldDear friends, today gold has been in a retracement situation. Although there have been several symbolic struggles, in the end the bears have the upper hand. The current lowest gold price has been around 2324. Of course, our short gold order around 2360 also successfully hit TP: 2349. We gained a lot of profits from this.
At present, gold maintains a volatile and weak situation. In the short term, I still maintain the view of being weak on gold, and gold is likely to fall into a continued retracement, and the target below is the 2320-2310 area. But if the short position is established, gold will also rebound to a certain extent after the breakthrough, and the technical level below will also give the bulls some support. Then gold will give us the opportunity to short gold again after it rebounds.
Therefore, in terms of trading, we can now first consider shorting gold in the 2355-2360 area, with the target looking at the 2340-2338 area. I share detailed trading ideas and trading strategies every day, hoping to help all my followers continue to make profits in the market! If you are worried about missing trading opportunities, you can follow the channel at the bottom of the article to get detailed trading signals, trading strategies, trading lots, and TP and SL in the first time.

Gold prices rise strongly
Friends, what I have been suggesting in the past few days has been to go long at the right price. After the release of non-agricultural employment data, the price of gold was suppressed and there was a certain downward adjustment.
However, the trend of gold prices is upward, so after the impact of the news, the gold price surged, and now the gold price remains above $2,320.
It is consistent with my previous prediction, and it is also very important to grasp the rhythm of trading.
I wish you all good profits in your trading!

Gold has a 9-game winning streak, continue to short goldToday’s gold trading conditions are as follows:
1. Xauusd:@2340-2342 Sell, TP:2328 Profit: + $3708
2. Xauusd:@2341-2345 Sell, TP:2336 Profit: + $8609
Today in gold trading, I relied on the resistance area of 2340-2345 to short gold many times, and hit my expected target positions of 2328 and 2336 respectively.As of today, I have made more than FWB:12K in short-selling transactions and successfully won 9 consecutive victories.
Judging from the current structure of gold, the recent lows of gold have continued to move downwards, and the short-term rebound has been blocked. Gold has been under heavy selling pressure near the upper trend line.Even with the help of news support in the short term, it was difficult to finally reach the previous wave high point of 2347. Compared with the previous rebound amplitude and intensity, it will obviously be much weaker now.
Therefore, even if gold is testing the 2350 mark again in the short term, if gold does not retrace to test support to confirm that gold continues its upward trend, then gold may fall back again after touching the 2350-2355 area. Therefore, in gold trading, you can try to short gold near 2350 in small batches, TP: 2342-2340.
I share detailed trading ideas and trading strategies every day, hoping to help all my followers continue to make profits in the market! If you are worried about missing trading opportunities, you can follow the channel at the bottom of the article to get detailed trading signals, trading strategies, trading lots, and TP and SL in the first time.

Already profited over $11K, continue to short gold at high levelToday’s gold trading conditions are as follows:
1.Xauusd:@2358-2360 Sell, TP:2347 Profit: + $6618
2.Xauusd:@2364-2366 Sell, TP:2347 Profit: + $8615
3.Xauusd:@2338-2340 Sell, SL:2347 Loss: - $3973
The trading profit so far today is: $11,260. Gold hit a new high today again, hitting a maximum of around 2,365. Gold still maintains a strong upward trend. But in actual trading, I will not easily chase gold above the 2360 level. Because gold is currently in a dangerous position, even if I am bullish on gold, I will not easily pursue long gold during the operation. On the contrary, I will continue to look for high levels to appropriately short gold.
In fact, as long as you are careful, it is not difficult to find that during the strong rise of gold, gold will still sweep back and forth in a wide range in the short term. Although it will add a lot of difficulty to our transactions, it also shows that in fact, proper participation in short transactions will still make good profits . So in order to prevent the market from falling due to accelerated shipments of long positions, I will look for more suitable opportunities to short gold.
At present, gold has rebounded to above the 2360 position again. I have tried to participate in shorting gold again. I hope that gold can fall back as scheduled, allowing us to obtain more profits. I share detailed trading ideas and trading strategies every day, hoping to help all my followers continue to make profits in the market! If you are worried about missing trading opportunities, you can follow the channel at the bottom of the article to get detailed trading signals, trading strategies, trading lots, and TP and SL in the first time.

Profit 18K, sell first and then buy goldDear friends, today after gold opened lower and fell back to the 2305-2300 area, it rebounded again and hit a new high near 2353. At present, gold has fallen back and remains near the 2338 position.
Today’s transaction can be roughly divided into two parts. First, we ended our short position in the 2305-2300 area and captured good short profits;Secondly, I went long on gold with the short-term support of the 2330-2320 area, but I have closed the long position again near the 2330 position. Although our profit in this transaction is not good, as long as we can continue to make profits in the transaction, it can be regarded as a Not a bad result.
Gold is currently trading near the 2338 position. Overall, gold is still in a strong upward trend, but for short-term fluctuations, I think gold may still continue to pull back in the short term. From the perspective of the form period,when gold is always below the 2340 position, then gold is likely to test the support in the 2315-2310 area again.
Therefore, in terms of current trading, I may first short gold in small batches at an appropriate position, and then consider going long gold after gold pulls back to the target area of 2315-2310. I share detailed trading ideas and trading strategies every day, hoping to help all my followers continue to make profits in the market! If you are worried about missing trading opportunities, you can follow the channel at the bottom of the article to get detailed trading signals, trading strategies, trading lots, and TP and SL in the first time.

Extension Bull Fibs on Gold show 2250 Target In ReachGold: 60 Minute, Fibonacci . . . I have much better bearing as to where and why this market is moving. All Month of March we have been trading an extension at the 38.2% line. We hit it's target on March 20th. Extension rules generally mean we trade the same anchor to new highs to get the retracement. We traded the retracement on March 23-24 and have been going up ever since. The objective for this new anchor is still higher, 2254.30.

Already earned 10K, target to earn another 10K todayToday’s gold trading situation is as follows:
1.Xauusd: @2292-2294 Sell, TP:2292, Profit: +$564
2.Xauusd: @2295-2300 Sell, TP:2291 Profit: +$ 9318
Today is the fourth consecutive day of profit in this week's trading. The profit so far today is $9882, which is an increase in profit compared to yesterday's profit. I think it is very meaningful to be able to make a little progress every day.
If you read my last article, you should know that I still hold a long position in gold in the 2285-2287 area. In fact, according to the current gold trend, if gold has tested the support near 2285 many times and confirmed that the support is effective, then gold will rise again to 2300 points or even higher. At present, gold buying support is strong. In the absence of major bad news, gold will not easily change its trend for the time being. Then gold will maintain a complete long pattern, so this is why I can always hold a long position in gold. If gold tests the 2285 area support again during its decline, it will still be an opportunity to go long gold.
I share detailed trading ideas and trading strategies every day, hoping to help all my followers continue to make profits in the market! If you are worried about missing trading opportunities, you can follow the channel at the bottom of the article to get detailed trading signals, trading strategies, trading lots, and TP and SL in the first time.

Opportunities to go long appear againDear friends, gold has pulled back to the 2288-2286 area as expected. First of all, congratulations to everyone. Our short position finally touched our target position, TP: 2288. At present, gold is under pressure to adjust downward after hitting the highest position of 2305. So where will gold fall?
According to the current gold trend, gold is currently setting new highs every day, and there is no obvious peaking signal. Therefore, even if gold experiences a short-term correction, do not imagine that it will turn into a downward trend.
We can currently find that gold is currently supported at 2285 and 2275. If nothing unexpected happens, I think gold will most likely rebound at these two positions. If gold pulls back to around 2285 and stabilizes, then there is a high probability that it will break through 2300, or even touch around 2320. If gold pulls back directly to 2275, then the strength of the counterattack may not be so strong. The probability will continue to be maintained in the 2310-2290 area.
So in terms of trading, next I suggest that you enter the market in batches to do long gold around the two positions of 2285 and 2275. I share detailed trading ideas and trading strategies every day, hoping to help all my followers continue to make profits in the market! If you are worried about missing trading opportunities, you can follow the channel at the bottom of the article to get detailed trading signals, trading strategies, trading lots, and TP and SL in the first time.

XAUUSD: 2/4 Enter Gold Analysis and StrategyThe price of gold fell back on Monday. Earlier, as the market's expectations for the Federal Reserve's interest rate cut in June increased after the PCE data last Friday, gold once refreshed its all-time high to 2265, but then the price of gold gave back part of the gains. On the one hand, bulls took profits. On the other hand, the U.S. ISM only returned above the 50 mark after a year and a half of PMI data. Market expectations for an interest rate cut in June fell again, and the U.S. dollar and bond yields rose, causing spot gold to narrow its late gains to 0.8%. , closing at $2,251
Gold prices continue to climb this week. Gold cash hit an intraday high of $2,265, a record high. It is expected that under multiple factors such as the slow global de-inflation process, global central bank gold purchase demand will remain strong in the long term, which will also form strong support for the gold price center.
In the short term, the U.S. dollar index is still biased towards strength in the short term, while the gold price has risen too much in the short term. We need to beware of the risk of a short-term shock correction in gold prices. On this trading day, you need to pay attention to the monthly rate of U.S. factory orders and February JOLTs job vacancies in the U.S., pay attention to the speeches of New York Fed President Williams, Cleveland Fed President Mester, and San Francisco Fed President Daley, and pay attention to the market's expectations for the Federal Reserve to cut interest rates. Changes in the performance of the U.S. dollar and U.S. bond yields will also affect the short-term gold price trend.
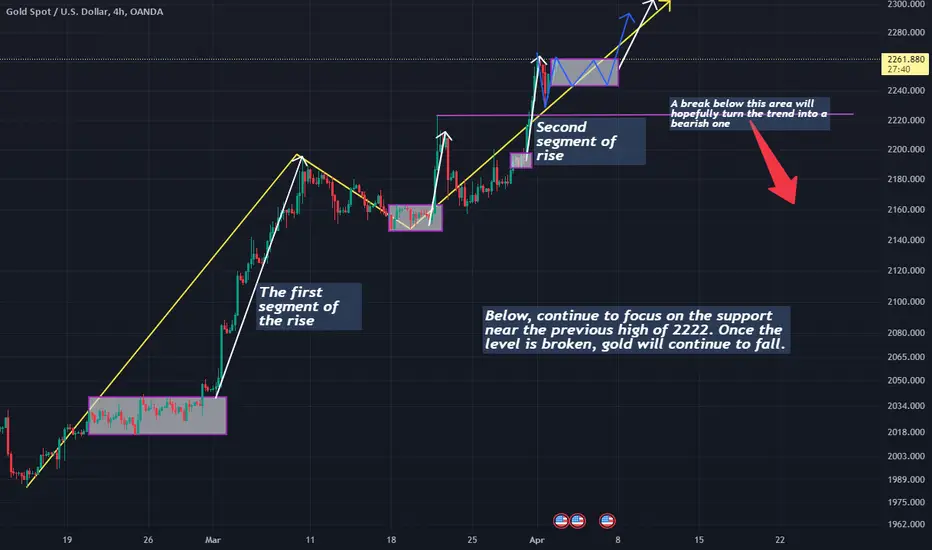
Daily resistance is 2270, support below is 2200
Four-hour resistance is 2265, support below is 2217-2222
Yesterday, the technical side of gold rose first and then fell. The opening of the Asian market opened with a rapid rise based on the 2243 line. Later, it accelerated and broke through the 2265 mark and then fell back under pressure. It fell into a volatile consolidation. The US market pulled back for a second time and came under pressure at the 2257 mark, and then fell back and hit the downward trend. Crossing the 2240 mark and reaching around 2228, the overall price stepped back at the 2230 mark for a second time to test the effective support. In the short term, this position will become a watershed between bulls and bears. The daily level stabilizes above 2230 and continues to maintain the bullish strong rhythm.
Judging from the daily analysis, the lower support today is still focused on the 2222-35 area, and the upper pressure is focused on the 2260-65 area that opened yesterday.
SELL: 2265~2270
BUY:2222~2217
BUY:2235~2240
Technical analysis only provides trading direction!
Contact Jiesse for trading support
The price of gold is about to continue its phased decline,
Gold in the Asian market rose again to the 2060 level, which is similar to my expectations. The current digestion period of the news is almost over, and intraday trading is mainly selling at high levels. 2060-2057 is a good position.
There is currently no significant news boosting the market, which is not conducive to gold's rise. In terms of trend, the gold price rise is weak, so focus on it during the day. Can the positions of 2255-2254, 22482247, and 2240-2241 be stabilized smoothly? If not, you can mainly sell at high levels.
Related Products: MCX:GOLD1! COMEX:GC1! COMEX_MINI:MGC1! TVC:DXY BINANCE:BTCUSDT BINANCE:ETHUSD

Gold refreshes record high, where is the upper end?Dear friends, due to the escalation of geopolitical conflicts in the Middle East due to the Israeli air strike on the Iranian consulate, gold once rose and set a new historical high again, with the current highest reaching 2266.8.
Judging from the current trend of gold, the position of 2267 is very extreme, because from a technical perspective, this position should be a stage high point, but stimulated by endless news, there is still a probability of refreshing this position. However, one thing that is certain is that I will definitely not chase long gold above 2260, even if gold really continues to rise. Because 2267 is actually a dangerous zone for me.
From the perspective of gold structure, gold may reach the top in the 2265-2268 area many times to form a top structure, and then gold is likely to start falling from there. From a structural perspective, I predict that the highest gold top position can reach around 2278, almost close to 2280.
So in terms of trading, first of all, I do not recommend chasing long gold above 2260; secondly, you can try to short gold in small batches in the 2263-2265 area. If it remains relatively stable, you can also wait for gold to rise to the 2275-2280 area before shorting gold.
I will share detailed trading ideas and trading signals every day to help everyone grasp the rhythm of market trading. If you are currently losing money, I am confident that I can help you turn losses into profits in a short period of time; if you are currently making profits, I am more capable of helping you increase profits. If you want to seize more trading opportunities and profits, you can follow the channel at the bottom of the article to get detailed trading signals and trading strategies in the first time.

Continue to short gold below the 2258 positionDear friends, gold hit a high of 2265 overnight and then fell back. Then gold stopped falling near 2229 and rebounded slightly again. As of now, gold is trading near 2251.According to the current gold trend, there is no doubt that gold still maintains a trend upward trend, so overall gold still maintains a intact upward pattern. But in the short term, today's 2256-2258 area will be a very critical position. If gold cannot break through this area during the local rebound, then gold will still need to continue its correction.
So in terms of short-term trading, I will try to short gold in small batches in the 2253-2258 area. If gold can build a local double-top structure, the demand for a gold correction will be clearer; on the other hand, when gold is near and above 2260 , I personally will avoid chasing long gold, and I will still look for suitable opportunities to short gold to avoid funds being trapped at high levels.
So relatively speaking, when others were extremely crazy about chasing gold, I changed the trend and began to insist on shorting gold at high levels; I share detailed trading ideas and trading strategies every day, hoping to help all followers to be successful in the market. Keep making profits! If you are worried about missing trading opportunities, you can follow the channel at the bottom of the article to get detailed trading signals, trading strategies, trading lots, and TP and SL in the first time.

Continue shorting gold and reap good profitsDear friends, today we shorted gold in the 2263-2265 area and set TP: 2245, making a profit of 18 points and successfully making a profit of 10K, which is a good gain. After touching 2245TP, I used small batch trading lots to chase short gold at 2246 and 2237 respectively, and set TP: 2225. Because gold only touched the lowest position near 2228, these two transactions have not ended yet.but overall there is still a floating profit of 1K.
According to the current trend, although gold has strongly touched a new high of 2265, relatively speaking, I do not advocate continuing to chase long gold at high levels. At present, the hourly and 4-hour graphics show that gold has not yet been adjusted in place, and there is still room for adjustment. This is why I set 2225TP above. Moreover, the sustainability of the risk-off market remains to be considered. Once gold confirms a short-term top, the magnitude of the decline cannot be underestimated.
So relatively speaking, I still insist on shorting gold at high levels; I share detailed trading ideas and trading signals every day to help everyone grasp the rhythm of market trading. If you are currently losing money, I am confident that I can help you turn losses into profits in a short period of time; if you are currently making profits, I am more capable of helping you increase profits. If you want to seize more trading opportunities and profits, you can follow the channel at the bottom of the article to get detailed trading signals and trading strategies in the first time.

Gold will also test the 2180 area, don’t rush to chase long goldDear friends, there must be only one question for everyone now, and that is, will gold continue to fall?
I think gold will continue to fall, because gold fell back immediately after touching 2198, and the candlestick body still closed below 2195, once again showing a long upper shadow line, so the pressure above is still relatively obvious. In addition, gold only touched around the 2184 position during the decline. I think the gold's step back is not in place, so gold still needs to continue to step back. I think it will at least test around the 2180 position again.
So I think gold still needs to continue to adjust. Of course, we still hold a short position in gold and are still making good profits overall. If you follow my trading strategy, I believe you will also have good profits like me. We can continue to hold it and wait for gold's deep correction, so that our profits will be better!
I share detailed trading ideas and trading strategies every day, hoping to help all my followers continue to make profits in the market! If you are worried about missing trading opportunities, you can follow the channel at the bottom of the article to get detailed trading signals, trading strategies, trading lots, and TP and SL in the first time.

XAUUSD BUY TRADE IS HERE!Hello guys I am seeing a good buy from here on xauusd with a safe take profit of 80 pips and an 40 pips sl so let's catch and win this trade together.

XAUUSD: 25/3 Today’s Analysis and StrategyGold was trading around 2166 on Monday; affected by a series of factors, gold prices experienced extremely rare fluctuations last week, with a single-week fluctuation of nearly $77. Last Friday, due to the optimistic economic outlook of the United States, DXY strengthened, and DXY refreshed its monthly high of 104.41. Precious metals faced a sharp sell-off, and the price of gold expanded its decline to around 2157.
After the Federal Reserve's monetary policy meeting, it retained expectations of three interest rate cuts during the year, which put pressure on the U.S. dollar, but helped London gold prices rise to a record high above $2,220. Although the Fed has hinted that it may cut interest rates three times in 2024, the final decision will depend on economic data. Gold bulls may stage a comeback if upcoming U.S. data supports a rate cut, however, bears are also lurking, waiting for the next opportunity to suppress prices.
Due to the tense conflict between Russia and Ukraine, investors need to beware of further escalation of the geopolitical situation caused by terrorist attacks, which is expected to provide further upward momentum for gold prices. New home sales data will be released on Monday, durable goods, consumer confidence and Richmond Fed survey data will be released on Tuesday, and MBA mortgage applications will be released on Wednesday. However, Thursday will be the busiest day next week due to the Easter long weekend, when final fourth-quarter GDP data, jobless claims, pending home sales data and the University of Michigan Consumer Sentiment Survey will be released data.
Gold technical analysis
Daily resistance is 2250, support below is 2177-45
Four-hour resistance is 2186, support below is 2150
Gold operation suggestions:
Last Friday, as the market began to consider the possibility that the Federal Reserve would cut interest rates later, the U.S. dollar index continued to strengthen. The technical aspect of gold was suppressed below 2186, showing a weak and volatile adjustment. The Asian market opened slightly higher throughout the day and came under pressure of 2186, and then began to fall continuously downward. Then it accelerated downward and broke through 2170 to reach around 2162 and fell into sideways shock. The US market reversed for a second time and came under pressure. 2180 fell back again and fluctuated downward to break the bottom and close. The daily K-line closed negative. The overall price continued to suppress and adjust at the short-term high of 2222, and the short-term long and short strength dividing line moved down to the 4-hour top-bottom conversion level of 2186.
Judging from the four-hour daily analysis, the current daily level is still consolidating in the range before it breaks through the 2145 position below. Today, the short-term resistance above is 2186. Before the short-term daily level does not break through and stands above 2186, high-level consolidation is cautious to pursue the bullish trend.
BUY:near 2145
SELL:near 2186
Technical analysis only provides trading direction!
Contact Jiesse for trading support

Gold Trading Analysis Strategy
What needs special attention this week is that the price of gold will rise in the short term, and various news will also affect the trend of gold prices.
In early trading in the Asian market on Monday, spot gold suddenly rose sharply in the short term. The price of gold just exceeded US$2,176 per ounce, rising by more than US$11 during the day. The latest geopolitical tensions have spurred rising risk aversion in the market, which has driven gold prices higher.
Therefore, it is particularly important to accurately judge the influence of the message and grasp the rhythm at this time. If an individual trades blindly, the probability of losing money will be very high.
In my trading last week, all predictions were perfectly verified, and the rhythm of rise and fall was also perfectly controlled. Therefore, this also brings better profits to my VIP customers.
Therefore, my suggestion is that if the gold price does not touch the $2,180 position line, you can wait and see.
If the gold price breaks through $2,180, you can go short at the right trading time.
If you also want to get detailed trading signals in your trading
And if you get satisfactory profits or encounter some problems during the transaction, you can contact me. I hope that with my help, you can also earn a lot of income!

Gold latest technical analysis
In early trading in the European market on Thursday (March 21), spot gold continued its intraday gains and is currently trading around US$2,200, rising by more than US$20 during the day. Spot gold is trading at $2,200 an ounce.
Looking at the daily chart of gold, gold prices have confirmed the formation of a bullish flag, with the relative strength index (RSI) once again overbought.
The Federal Reserve said on Wednesday that it would still cut interest rates three times by 25 basis points each time before the end of this year. Federal Reserve Chairman Jerome Powell said at a subsequent press conference that he believed interest rates may be at a cyclical peak and that it would be appropriate to start cutting interest rates at some point this year.
Affected by the dovish stance of the Federal Reserve, the U.S. dollar suffered a sell-off on Wednesday, with spot gold closing at $28.96, or 1.34%, at $2,186.06 per ounce. The price of gold rose further in early trading in Asia on Thursday, reaching a maximum of $2,222.90 per ounce, setting a new all-time high.
As shown on the daily chart of gold, gold prices confirmed the formation of a bullish flag after closing above the downtrend line resistance at $2,161 an ounce on Wednesday.
If gold buyers regain confidence, the next bullish price target is expected to be a record high of $2,223 an ounce, followed by a psychological level of $2,250 an ounce.
If the daily closing price of gold is below the $2,200/ounce mark, the high of $2,189/ounce will be tested.
Once gold prices fall below $2,189 per ounce, this will trigger a new downward trend in gold prices and fall towards Monday's low of $2,146 per ounce.
My suggestion is to go short at high prices at the right time
Always pay attention to my signals to make the right choice from them.
I will share trading strategies and trading ideas every day. Follow me in the channel at the bottom of the article to get detailed trading signals. I hope that with my help, everyone can make huge profits!

XAUUSD: 18/3 Today’s Gold Trading StrategyData last week showed that U.S. consumer prices rose more than expected in February, and producer prices also showed a certain degree of inflationary stickiness. Traders have reduced their bets on an interest rate cut in June. Gold prices fell more than 0.8% last week.
Spot gold has already priced in the positive push from expectations of lower interest rates. If inflation starts moving higher again, it means policymakers will have to keep monetary policy tighter for longer. Although gold does not particularly like high interest rate environments, if the reason for interest rates remaining so high is overheating inflation this naturally means that people will turn to international gold again. Higher-than-expected inflation continues to put pressure on the Federal Reserve to keep interest rates high, putting pressure on gold prices. The non-yielding precious metal is also used as a hedge against inflation.
Central banks will be in focus this week. The Bank of Japan and the Reserve Bank of Australia will announce interest rate decisions on Tuesday, the Federal Reserve will announce interest rate decisions on Wednesday, and the Bank of England and the Swiss National Bank will announce interest rate decisions on Thursday. The market will also focus on Tuesday's U.S. housing starts and building permits, as well as Thursday's weekly jobless claims, Philadelphia Fed manufacturing survey, PMI preview data and existing home sales.
Gold technical analysis:
Daily resistance is 2184, support below is 2124-00
4H resistance is 2158, support below is 2124-00
Gold operation suggestions:
Judging from the daily and four-hour analysis, today's short-term strong short-term strong dividing line is around 2158. Short-term pressure will focus on around 2158. The focus below will be on the daily level support of 2124 and today's low near 2145.
BUY:2140-2145
BUY:2120-2125

XAUUSD: 19/3 Gold awaits triangle breakoutGold prices edged higher in quiet trading on Tuesday as investors braced for monetary policy decisions from major central banks. While the Bank of Japan (BoJ), Bank of England (BoE) and the Federal Reserve (Fed) will announce their decisions, the focus will be on the Fed. The Fed's hawkish bias could push gold prices higher as market participants anticipate less likelihood of a rate cut.
Data showed that U.S. consumer prices grew steadily in February and producer prices rose more than expected, indicating that inflation is somewhat sticky. Gold prices fell by about 1% last week. Although gold has traditionally been considered an inflation hedge, raising interest rates to curb price increases has discouraged investment in gold because it does not pay interest.
Gold prices were still supported by speculation that the Federal Reserve would begin easing monetary policy earlier than expected. However, gold prices plunged nearly 1% last week as an unexpected acceleration in U.S. consumer and producer inflation spurred a surge in U.S. Treasury yields. As a result, the U.S. dollar gained over 0.69% last week while gold fell, according to the U.S. Dollar Index.
Gold technical analysis
Daily resistance is 2177, support below is 2124
Four-hour resistance is 2168, support below is 2158-24
✅Gold operation suggestions:
Yesterday, the overall technical aspect of gold fell first and then rose, ushering in a deep V rebound. The Asian and European prices suppressed the shock below 2157 and fell back to break the bottom. Then they retreated further downwards and penetrated the 2150 mark to reach around 2146 and fell into sideways shocks. The European and American prices The price of gold stabilized and rebounded, returning to a strong and volatile close above 2160. The daily K-line closed slightly higher. The overall price showed a short-term support and stabilization form at the 2146 mark. However, the price above was still suppressed and fluctuated below the daily starting and falling point of 2172 last Friday. The short-term price there is a high probability that it will continue to run up and down repeatedly within the range.
Today, the lower four-hour and daily support will focus on around 2150/2124, and the upper pressure will focus on 2168-77. Wait for the Fed’s interest rate decision with peace of mind, and trade with caution!
SELL:near 2170
SELL:near 2160
BUY:near2124
Technical analysis only provides trading direction!
