Gold will make new record what you think Personal suggestion for you
Gold price trend to continue Buy during session
It is expected that price will continue in the Buytrend
and can approach the price range of 2083
Gold setup price 2083
1st Gold Target. 2106
2nd Gold Target 2146
Note:
Always wish you to manage your capital safe
Take small lots which suits your capital
The winner is the one who sticks with the market
Give us like and support us
Goldintraday

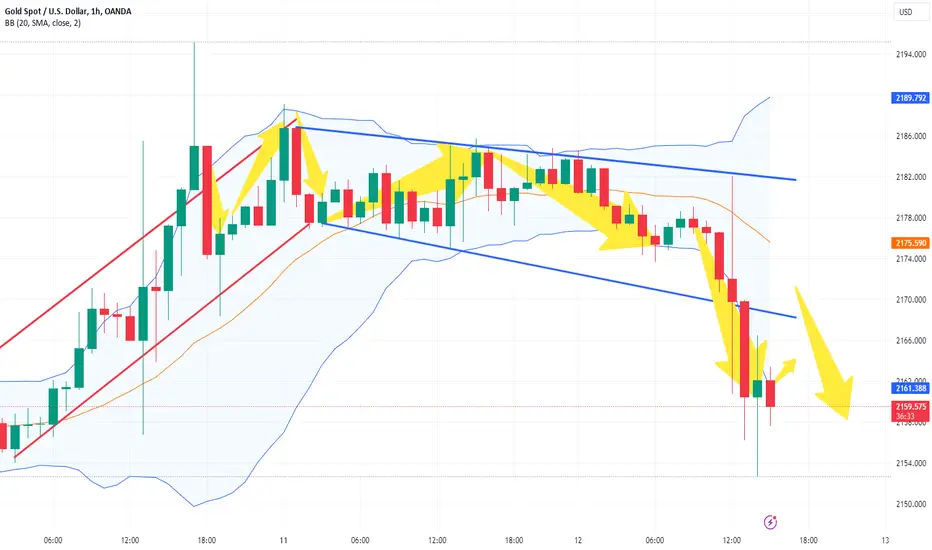
Gold is about to have a big market, keep shorting goldDear friends, gold is currently oscillating in the 2155-2160 area. The trend of gold is relatively cautious, and the long and short forces are also relatively restrained. This is because the Federal Reserve’s interest rate decision is about to come and Powell holds a monetary policy conference. Therefore, before the news was announced, the market performance was relatively restrained and there was not much fluctuation. This is also the reason why I set the TP relatively small when I participated in the transaction yesterday.
In fact, according to the current technical level, gold fell short of expectations during its multiple rebounds. Not only did it fail to stand firm at 2170, it could not even break through 2165. And gold has consumed a lot of bullish potential in this process, and as the technical pressure above gradually moves downwards, gold's performance is getting weaker and weaker, so I personally tend to be bearish on gold. This is why I continued to short gold yesterday.
At present, our gold short position still has good profits. You can continue to hold it and wait for gold to hit TP and expand profits. I share detailed trading ideas and trading strategies every day, hoping to help all my followers continue to make profits in the market! If you are worried about missing trading opportunities, you can follow the channel at the bottom of the article to get detailed trading signals, trading strategies, trading lots, and TP and SL in the first time.

Today’s gold price market trading analysis
On Wednesday (March 20), spot gold was trading below $2,160 per ounce at the beginning of the European market. Investors are cautiously awaiting the Federal Reserve's monetary policy statement. However, the market remains cautious about gold's near-term upside. If Powell makes dovish remarks again, gold is expected to usher in a new rally.
But from a short-term perspective, according to the 4-hour chart, gold prices are currently trading around $2,155 per ounce, and although below the mildly bearish 20-period SMA, a deeper decline remains unclear. The longer-term moving averages continue to rise, but technical indicators remain at negative levels, lacking clear directional strength signals.
Gold prices will continue to fluctuate within a narrow range. It is particularly important to grasp the rhythm at this time.
The latest important support and resistance levels for gold prices:
Support level: $2145.10;
Resistance level: $2163.40;
I am more inclined to go long at low prices, going long around $2150
Always pay attention to my signals to make the right choice from them.
I will share trading strategies and trading ideas every day. Follow me in the channel at the bottom of the article to get detailed trading signals. I hope that with my help, everyone can make huge profits!

Today's gold market price analysis
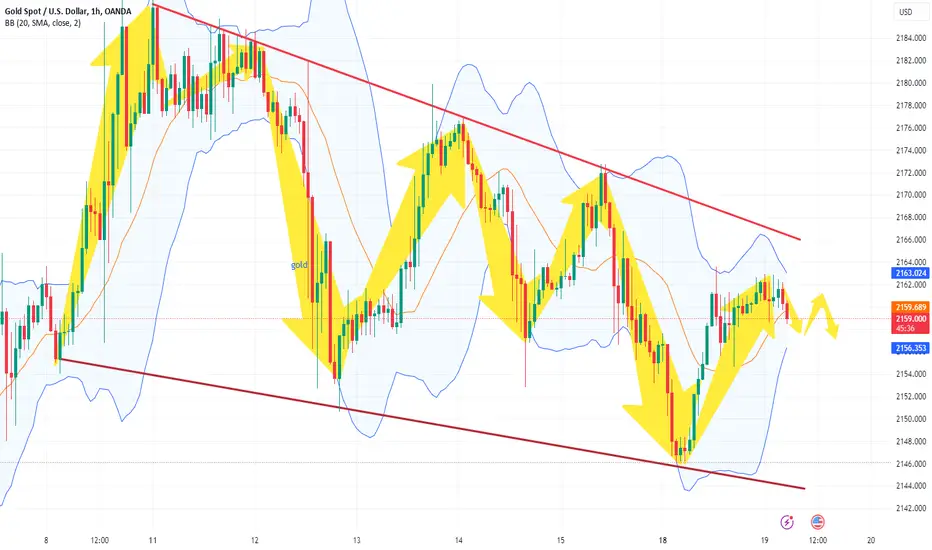
On Monday (March 19), the price of gold is now $2,159.
According to the current gold trend, gold prices will continue to fluctuate within a narrow range.
Gold remains at high levels and is trading sideways in a narrow range for the time being. On the four-hour gold chart, the price of gold is still suppressed by the moving average and is below the middle track of the Bollinger Bands. The high points are successively lower, seemingly forming a downward channel. The technical indicator MACD energy column continues to remain below the zero axis, indicating that gold's situation under short-term pressure has not changed significantly. Initial support below is $2,142.15, with further levels at $2,130.66 and $2,110.45. Only if the upper limit breaks through $2,176 can the upward trend be expected to continue.
Short-term gold trading recommendations: short around $2,160.
Always pay attention to my signals to make the right choice from them
I will share trading strategies and trading ideas every day. Follow me in the channel at the bottom of the article to get detailed trading signals. I hope that with my help, everyone can make huge profits!
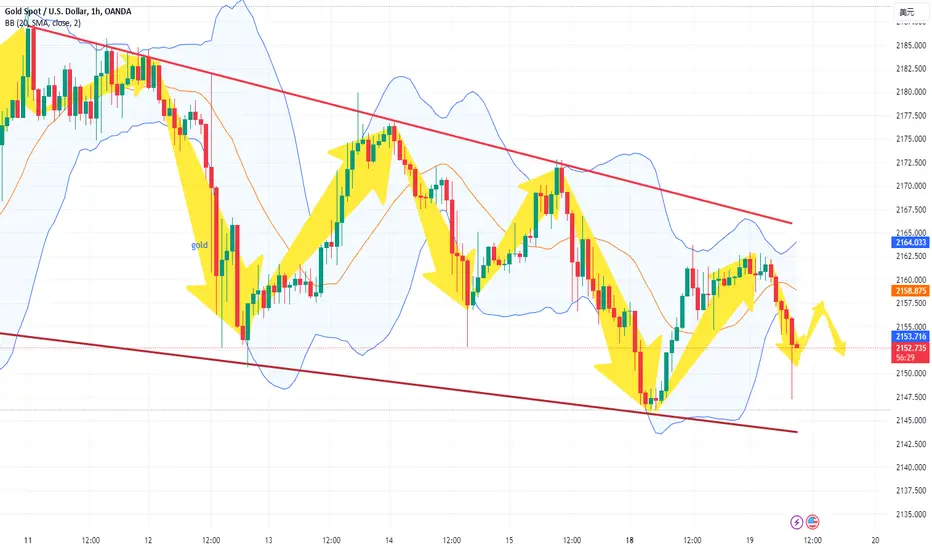
Gold price real-time trading analysis
On Monday (March 19), spot gold bottomed out and rebounded, with the price rising at $2,150. According to the latest analysis, gold is supported at $2,145.35.
The price of gold is now $2,150.
According to the current gold trend, gold prices will continue to fluctuate within a narrow range. It is particularly important to grasp the rhythm at this time.
Always pay attention to my signals to make the right choice from them.
It is recommended to go short in the short term: go long around $2150.
I will share trading strategies and trading ideas every day. Follow me in the channel at the bottom of the article to get detailed trading signals. I hope that with my help, everyone can make huge profits!

Real-time analysis of gold price
Today, the lower support will focus on 2145-50, and the upper pressure will focus on 2170. During the day, we will first rely on the high altitude and low long cycle of this range to participate in the rhythm of long and short shock operations. At the midline position, you should watch more and move less, follow orders cautiously, and wait patiently for key points to enter the market.
Always pay attention to my signals to make the right choice from them
I will share trading strategies and trading ideas every day. Follow me in the channel at the bottom of the article to get detailed trading signals. I hope that with my help, everyone can make huge profits!
XAUUSD:14/3 Today’s Analysis and Trading StrategyGold fluctuated within a narrow range on Thursday and is currently trading around $2,170. Gold prices rose 0.75% on Wednesday to close at $2,174, boosted by a weaker U.S. dollar as investors still held out hope for a rate cut by the Federal Reserve in June despite scorching U.S. inflation data, while escalating geopolitical tensions maintained safe-haven demand for international gold. Gold prices rebounded, recovering from the previous session's losses, boosted by a weaker U.S. dollar.
Gold prices retreated from record highs set last week on Tuesday, posting their worst one-day drop since February 13, after a report showed U.S. consumer prices rose sharply in February, suggesting some stickiness in inflation. Higher-than-expected inflation means more pressure on the Federal Reserve to keep interest rates high, putting pressure on non-yielding assets such as gold. The precious metal is also used as a hedge against inflation. This is reinforced by the softer tone in U.S. Treasury yields, which has put dollar bulls on the defensive and acted as a driver for gold prices. As the U.S. dollar index fell 0.2%, overseas buyers were more willing to buy gold to avoid risks.
Despite the disappointing consumer price index, U.S. monetary policy authorities may judge that price pressures are easing. Gold has the potential to rise as long as economic data continues to be weak, with the focus now on U.S. retail sales (commonly known as the "terror index"), producer price index and last week's jobless claims, all of which are due to be released on Thursday.
Gold technical analysis
Daily resistance is 2184, support below is 2124-00
Four-hour resistance is 2200, support below is 2167-53
Gold operation suggestions:
From the daily and four-hour analysis, today's support at the bottom will be around 2164-53, short-term pressure at the top will be around 2184, and strong resistance will be at 2195-2200. The short-term long-short dividing line will be around 2150. You can continue to participate in long positions before the daily level falls below this level. If it falls below this level, you will look towards the 2124 target.
BUY:2148-2153
SELL:2195-2200
SELL:2148-2153

XAUUSD:15/3 Today’s Analysis and StrategyThe final value of U.S. retail sales data in February was 0.6%, lower than the expected 0.8%, but higher than the previous value of -0.8%. The final value of PPI in February was 1.6%, exceeding the expected 1.11%, and the previous value was 1%. PPI rose 0.6% month-on-month, twice the expected value, and the previous value was 0.3%.
The rise in energy prices is the main reason for the rise in February's PPI data. Combined with Tuesday's CPI data, it is not able to support the Federal Reserve's implementation of interest rate cuts at the next meeting. Judging from the data, the target of inflation falling back to 2% is still far away.
Affected by the data, the price of gold rose first and then fell yesterday, and then rose again to recover the decline. The intraday low hit below $2,153, and was supported again near the previous low of $2,150. The final price closed at $2,162. In the short term, the support below $2,150 is effective.
Gold technical analysis
Daily resistance is 2184, support below is 2124-00
Four-hour resistance is 2200, support below is 2167-53
Gold operation suggestions:
Judging from the daily and four-hour analysis, today's support below will focus on around 2150. During the day's decline, rely on this position to continue to go long. The short-term pressure above will focus on around 2184, the strong resistance will be 2195, and the short-term bullish strong dividing line will focus on 2150.
SELL:2195~2200
BUY:2148~2153
Technical analysis only provides trading direction!

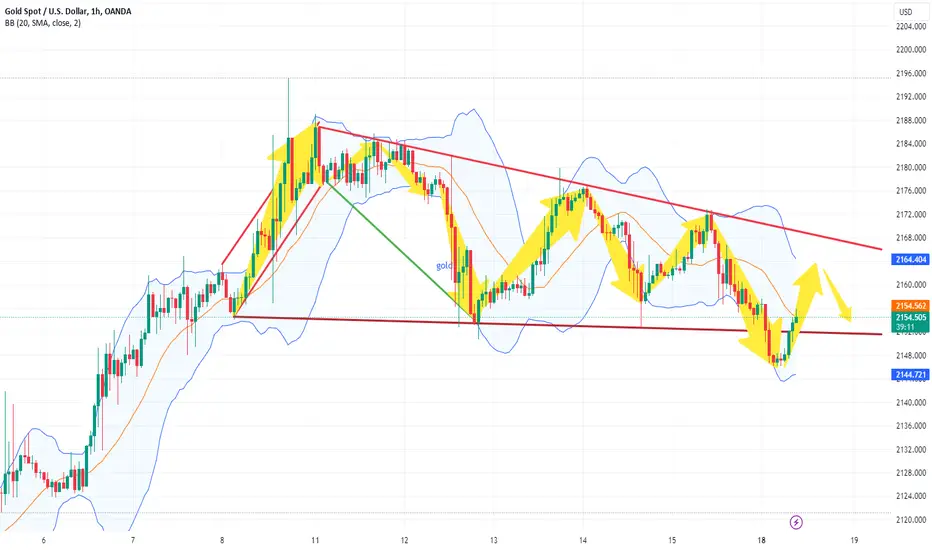
Gold real-time trading analysis
On Monday (March 18), spot gold bottomed out and rebounded, with the price rising at $2,147. According to the latest analysis, gold is supported at $2,145.35. The price of gold is now $2,155.
Based on current gold trends, gold prices will continue to rise.
It is predicted that the price of gold will rise to around $2,160 and then fall.
Always pay attention to my signals to make the right choice from them.
It is recommended to go short in the short term: short around $2160.
I will share trading strategies and trading ideas every day. Follow me in the channel at the bottom of the article to get detailed trading signals. I hope that with my help, everyone can make huge profits!
Gold Trading Analysis·Trends
Spot gold fell below $2,150 per ounce for the first time since March 7, down 0.28% on the day.
Now the price of gold is under pressure from above around $2,147, showing a downward trend.
What needs to be noted is whether the price of gold can fall below the $2,140 line.
If it receives strong support below at $2,140, the price of gold will rebound. If it falls below the $2,140 line, you need to watch $2,130 below.
Therefore, I think a safer trade is to wait for the gold price to receive support from below, and then go long at a low price.
Recommendation: Go long when gold is around $2,140
TP: $2150
SL: $2130
I will share trading strategies and trading ideas every day. Follow me in the channel at the bottom of the article to get detailed trading signals. I hope that with my help, everyone can make huge profits!
Real-time gold trading analysis
Gold prices fell to $2,155 before bottoming out.
At this time, the one-year inflation rate forecast for the United States in March was released in the United States.
Predicted value 3.10%
Published value 3%
Preliminary value of the University of Michigan consumer confidence index in March
Predicted value 76.9
Published value 76.5
The data is very bullish for gold. As I said, there is strong support below gold, so it is a very wise choice to go long at low prices.
Now the gold price is supported below at $2,158, making it difficult to continue falling. It then turned to an upward trend, confirming my previous prediction.
Therefore, I prefer to go long at the low price of around $2160.
I will share trading strategies and trading ideas every day. Follow me in the channel at the bottom of the article to get detailed trading signals. I hope that with my help, everyone can make huge profits!

Seven tips for investing in gold and crude oilThe financial market is fair to everyone. Since some people lose money, some people must make money. But if you want to make a profit in investment, there is no shortcut. You can only do your homework seriously every day and accumulate diligently like an ascetic. In addition to providing some investment experience and learning methods, I also hope to find like-minded investment friends and work together. Research. Investment does not happen overnight. Losses in the early period do not mean losses in the later period; profits in the early period do not mean profits in the later period. Therefore, friends who are losing money should not be discouraged, and friends who are making profits should not be complacent. Let yourself invest rationally with a peaceful mind.
1. Learn to establish positions, close positions and make profits
"Establishing a position" means opening. Opening is also called exposure, which is the act of buying gold. Choose the appropriate gold price level
And timing to establish a position is a prerequisite for profitability. If you enter the market at a good time, you have a greater chance of profit: On the contrary, if you enter the market at a bad time, you are prone to losses.
"Liquidation" is a stop-loss measure taken to prevent excessive losses when the gold price suddenly drops after a position is established. For example, if you sell gold at a price of 157, and later the gold price drops to 150, you will see a nominal loss of 7 yuan. In order to prevent the gold price from continuing to decline and causing greater losses, I sold gold at the price level of 150 and ended the exposure with a loss of 7 yuan. Sometimes traders refuse to accept losses and insist on waiting, hoping that the price of gold will turn back. In this way, they will suffer huge losses when the price of gold keeps falling.
The timing of "profit" is more difficult to grasp. After establishing a position, when the price of gold has developed in a direction favorable to you. You can make a profit by closing the market. For example, you buy gold at 145 yuan; when the gold price rises to 150 yuan, you have a profit of 5 yuan, so you sell the gold and make a profit. It is very important to grasp the opportunity to make profits. If the price is closed too early, the profit will not be much; if the price is closed too late, the opportunity may be delayed, and the gold price trend will reverse, with no profit but loss.
2. "Pyramid" overweighting
The meaning of "pyramid" overweighting is: after buying gold for the first time, the price of gold rises. Seeing that the investment is correct, if you want to increase your investment, you should follow the principle of "the amount added each time is less than the last time". In this way, the number of incremental purchases will become less and less, just like a "pyramid". Because the higher the price, the greater the possibility of approaching the top of the rise and the greater the risk.
3. Buy (sell) when there are rumors and sell (buy) when the facts are real
The gold market, like stocks, often circulates some news or even rumors. Some news turns out to be true later, and some news turns out to be nothing more than rumors. What traders do is buy as soon as they hear good news and sell as soon as the news is confirmed. Vice versa, when bad news breaks, sell immediately and buy back as soon as the news is confirmed. If you don't trade quickly enough, you may incur losses due to market changes.
4. Don’t increase your bet when you are losing money.
After buying or selling gold, when the market suddenly advances in the opposite direction, some people will want to add more money, which is very dangerous. For example, when the price of gold continues to rise for a period of time, traders chase the high price and buy the currency. Suddenly the market reversed and plummeted downwards. Seeing that the traders were losing money, they wanted to add more orders at a low price. In an attempt to offset the gold price of the first order, and when the gold price rebounds, the two orders will be closed together to avoid losses. Be especially careful with this overweighting approach. If the gold price has been rising for a period of time, what you bought may be a "top". If the more it falls, the more you buy, and you continue to increase your investment, but the gold price never turns back, then the result will undoubtedly be a vicious loss.
5. Do not participate in unclear market activities
When you feel that the trend of the gold market is not clear enough and you lack confidence, it is better not to enter the market. Otherwise it is easy to make wrong judgments.
6. Don’t blindly pursue integer points
In gold investment, sometimes things go wrong in order to compete for a few points. After establishing a position, some people set a profit target for themselves, such as earning 200 US dollars, etc. They are always waiting for this moment to come. Sometimes the price has already It was close to the target, and the opportunity was very good, but it was still a few points short of reaching the target. It could have been a flat profit, but due to the original target, the best price was missed while waiting, and the opportunity was missed.
7. Establish a position when the volatile market breaks through
The market situation refers to the volatile market. A volatile market is a sign that buyers and sellers are evenly matched and temporarily in balance. Regardless of whether it is a shock in the process of rising or falling, once the shock ends, the market price will break through upward or downward, showing a breakthrough. This is a good time to enter the market and establish a position. If the market has been in a volatile market for a long time, the market price will break through. Opening a position has a greater chance of making a big profit.

Today's gold trading analysis
The price of gold fell to around US$2,154 yesterday and was supported by the bottom, and then rose to around US$2,160, showing a volatile trend.
Today, the price of gold is under pressure from above around $2,170, showing a volatile trend.
It should be noted that the price of gold today is above US$2,170 and is above US$2,180.
What you need to pay attention to is whether the gold price can break through when it reaches the $2,180 line.
At the bottom, we need to pay attention to the position of $2153-2150.
Therefore, I think a safer trade is to wait for the gold price to encounter resistance from above, then it would be a better choice to go short at a high price, or to go long at a low price.
My suggestion is to go short between the high price of $2176-2179.
If the price of gold falls to fluctuate around 2160, go long at a low price.
I will share trading strategies and trading ideas every day. Follow me in the channel at the bottom of the article to get detailed trading signals. I hope that with my help, everyone can make huge profits!

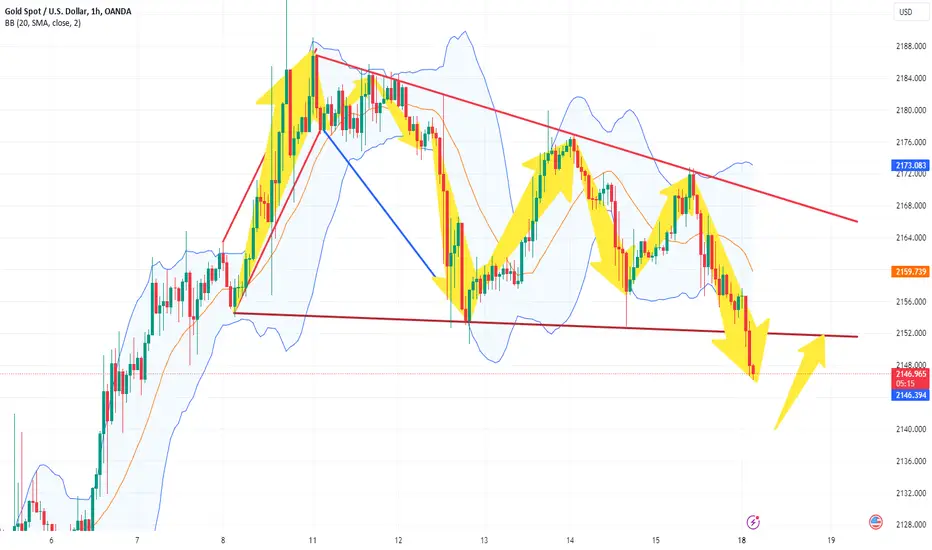
Gold 2169 continues to be short, let’s look at 2145 first
Don’t be afraid of gold’s rebound. The rebound is for better short positions. Hold the 2180 line. We firmly watch the decline.
The four-hour line is still close to the moving average. The high point is still lowering. The slope is obviously downward. At the same time, the moving average has obviously turned downward. We need to be patient and wait for the market to adjust. Let’s continue to look at the 2145 line.
Trading strategy: short gold 2169, stop loss 2178, target 2100, 2145

XAUUSD: 11/3 Today’s Market Analysis and StrategyGold maintained its rebound on Monday, with gold prices currently sitting around $2,180. Gold gained bullish momentum last week, hitting a new all-time high above $2,190, driven by falling U.S. Treasury yields and broad-based selling pressure in the U.S. dollar. Spot gold remains technically overbought ahead of key U.S. inflation data this week.
Data on rising U.S. unemployment has boosted expectations that the Federal Reserve may soon begin cutting interest rates. The dollar index fell 1.1% last week, hitting its lowest level since January 15 at 102.32, making gold cheaper for overseas buyers, while 10-year U.S. Treasury yields fell to more than a month low.
Starting last Tuesday, gold started a streak of record-setting trends, surpassing its December peak, mainly due to growing signs that price pressures are cooling down, as well as gold's traditional safe-haven appeal. In addition, central banks of various countries continue to rapidly increase their gold holdings, which also provides support for gold prices. Overall, the outlook for gold remains generally bullish, driven by a combination of expected lower interest rates, a weaker U.S. dollar and continued demand as a safe-haven asset.
Looking ahead to the week ahead, the biggest event risk for gold is the U.S. Consumer Price Index (CPI) report for February, which could create some selling pressure on the precious metal if inflation is higher than expected. Gold is overbought in the short term, but long-term returns suggest there is more room for gold prices to rise.
Gold technical analysis
Daily resistance is 2200, support below is 2150-24
Four-hour resistance is 2200, support below is 2167-53
Gold operation suggestions:
Gold has been super strong recently, with the highest reaching the 2195 line, and the weekly closing of the positive line. The bulls not only set a new historical high, but also set the largest unilateral increase in a single week in recent years. There is no doubt about the bullish trend. This week's major trend We continue to be bullish, but Friday's big pullback shows that the bulls have begun their final struggle. There is no unilateral rise, and there are still short-term opportunities for decline.
Today, the short-term support at the bottom will focus on the four-hour 2167 area. During the day, the support will rely on this position to continue to be bullish. The short-term pressure at the top is in the 2190-95 area.
BUY:2165~2070
BUY:2147~2054
SELL:2194~2200

XAUUSD:12/3 Today’s Analysis and StrategyGold fluctuated within a narrow range on Tuesday and is currently trading around $2,177. After trading slightly higher on Monday, prices remain near all-time highs after last week's record gains, as traders await U.S. inflation data that could provide more clarity on the Federal Reserve's interest rate trajectory.
U.S. CPI data for February will be released today. U.S. CPI in February is expected to increase by 0.3% to 0.4% month-on-month, with a year-on-year increase of 3.1% unchanged. Core CPI is expected to drop from 0.4% to 0.3% month-on-month and from 3.9% to 3.7% year-on-year.
Last week, Powell indicated that the Fed would eventually begin to ease policy, but stressed that the central bank still relies on data. Although the Fed chairman said the central bank is confident that inflation is edging lower, they are in no rush to cut borrowing costs. Low interest rates help gold prices rise because they reduce the opportunity cost of holding zero-yielding gold.
Physical gold demand in many countries is expected to remain relatively strong this year, and net positive demand from multiple central banks appears to be continuing into this year, with multiple central banks adding 39 tons of gold in January.
Gold technical analysis
Daily resistance is 2200, support below is 2150-24
Four-hour resistance is 2200, support below is 2167-53
Gold operation suggestions:
Today, the lower support continues to focus on the vicinity of 2167, and the upper pressure is in the 2190-95 area. The short-term price stabilizes above 2150, and bulls are still strong.
BUY:2167near
BUY:2153near
BUY:2124near

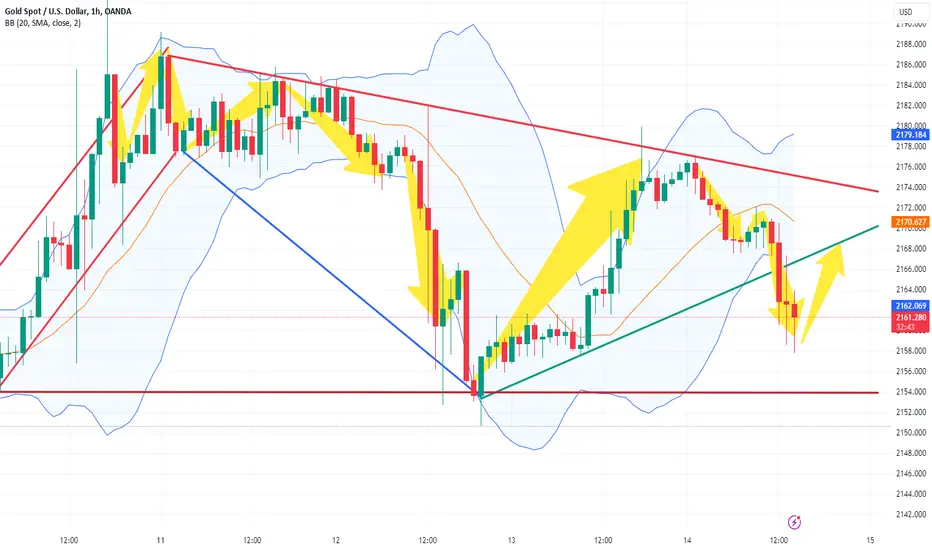
XAUUSD: 3/13 Today’s Analysis and StrategyGold fluctuated within a narrow range on Wednesday and is currently around 2159. The price of gold fell back nearly $30 on Tuesday, once touching 2150, a drop of more than 1%. The U.S. inflation report dimmed the prospect of an imminent interest rate cut by the Federal Reserve. The price of gold plummeted by nearly $25. The U.S. dollar index edged higher after a shock on Tuesday.
A red-hot U.S. inflation report dimmed prospects for a Fed rate cut soon! U.S. inflation data was hotter than expected, but not extreme. This led traders to still believe that June is the most likely time for the Federal Reserve to start cutting interest rates. The U.S. dollar recovered slightly, causing the price of gold in U.S. dollars to fall by more than 1%.
U.S. consumer prices rose sharply in February amid rising gasoline and housing costs, suggesting that inflation is somewhat sticky and further reducing the likelihood that the Federal Reserve will cut interest rates before June. Although the U.S. Labor Department's inflation reading on Tuesday rose for a second straight month, the composition of the report remained consistent with a trend of slowing inflation. Inflation-weary Americans are getting some relief from grocery store and medical bills.
Gold technical analysis
Daily resistance is 2184, support below is 2150-24
Four-hour resistance is 2200, support below is 2167-53
✅Gold operation suggestions:
Affected by the CPI data on Tuesday night, gold experienced a rapid decline like a roller coaster, and then suddenly rose. The highest continued to reach the 2183 line and began to fall back. We also gave a long suggestion of 2151-56.
Gold ushered in a daily level adjustment after the non-farm payrolls hit a high of 2195 last Friday.
From the daily analysis, today’s lower support focuses on the early 4-hour long-short conversion level near 2150. The upper pressure first looks at around 2166-70. The short-term bull strong dividing line is 2184. The key lower support during the day focuses on around 2150.
BUY: 2147~53
BUY: 2165~70
Technical analysis only provides trading direction!

Real time gold analysis
According to the current trend of gold, the price of gold has now dropped to $2158. Pay attention to my signals at any time to make the right choice from it.
Gold price predicted to rise
It is recommended to go long in the short term: go long around $2160
I will share trading strategies and trading ideas every day. Follow me in the channel at the bottom of the article to get detailed trading signals. I hope that with my help, everyone can make huge profits!
Today's gold price analysis
The price of gold fluctuated after falling to around US$2,158 yesterday, and then fell when it rose to around US$2,179 and then fell under resistance from above. This is consistent with my prediction and analysis yesterday.
Today's gold price is under support at $2168 and has a tendency to bottom out, but there will also be resistance from above. Therefore, I think a safer trade is to wait for the gold price to receive resistance from above, and then shorting at a high price would be a better choice.
What needs to be noted is whether the gold price can break through when it reaches the $2,180 line.
If it fails to continue rising, my suggestion is to go short between the high price of $2176-2178.
I will share trading strategies and trading ideas every day. Follow me in the channel at the bottom of the article to get detailed trading signals. I hope that with my help, everyone can make huge profits!

Gold prices may fall back today after rising higher
After bottoming out after falling to $2,150 yesterday, the price of gold was affected by the release of the monthly short-term energy outlook report by the U.S. EIA. The price of gold hit a maximum of $2,180 today, encountering resistance from above.
At this time, the 10-year Treasury bond bidding multiples and bidding interest rate data published in the United States on March 12 were very negative for gold. At this time, the price of gold encountered huge resistance from above around $2,180, and it was difficult to break through.
So I think gold prices will fall back when they reach the resistance level of $2,180 above.
Therefore, I recommend going short at $2177-2179.
I will share trading strategies and trading ideas every day. Follow me in the channel at the bottom of the article to get detailed trading signals. I hope that with my help, everyone can make huge profits!

XAUUSD:29/2 Today’s Analysis and StrategyOn Thursday, the U.S. dollar index gave up yesterday's gains at 103.93, but bulls continued to put pressure on gold ahead of the release of Personal Consumption Expenditures (PCE), and gold prices have yet to break out of range trading. The dovish Federal Reserve released a timetable for interest rate cuts, suggesting that interest rate cuts will begin in the second half of the year. The U.S. slightly revised down fourth-quarter economic growth, providing support for gold prices, but gains were limited as traders focused on key economic data and comments from Federal Reserve officials on the timetable for interest rate cuts.
This trading day will release the U.S. PCE data that the Federal Reserve focuses on in January. The market expects core PCE to increase by 0.4% month-on-month, compared with the previous value of 0.2%. Core PCE is expected to increase by 2.8% year-on-year, compared with the previous value of 2.9%. In addition, this trading day also Changes in the number of people filing for initial unemployment benefits in the United States will be released. The market expects it to be 210,000, compared with the previous value of 201,000. Investors need to pay attention to changes in market expectations for the Federal Reserve to cut interest rates.
Additionally, a fresh decline in U.S. Treasury yields prevented bearish traders from making big bets on gold prices and helped limit the downside. Compared with forecasts for a rate cut in March at the beginning of the year, recent Fed comments and hot inflation data have pushed bets on the Fed's first rate cut to June. Higher interest rates tend to dampen investment confidence in gold.
Gold technical aspect
Daily resistance 2037-40, lower support 2000-1966
Four-hour resistance 2037-40, lower support 2015
✅Gold operation suggestions:
Gold is constantly oscillating. Today, the upper resistance is around 2037-41. Relying on this position, continue to go short once. The lower support is around 2020. During the day, rely on this range to sell high and buy low. You can participate multiple times.
SELL:near 2041
SELL:near 2015
BUY:near 2000
Technical analysis only provides trading direction!

Gold prices will bottom out and rebound
According to the current gold trend, the gold price now forms a resistance level at 2154-2155. At this stage, the gold price reaches the bottom of 2154 and rebounds. Only by paying attention to my signals at any time can you make the right choice.
Gold price predicted to rise
It is recommended to go long in the short term: go long around $2155-2156
I will share trading strategies and trading ideas every day.
For those who want to make easy profits, follow me in the channel at the bottom of the article to get detailed trading signals. I hope that with my help, everyone can make huge profits!
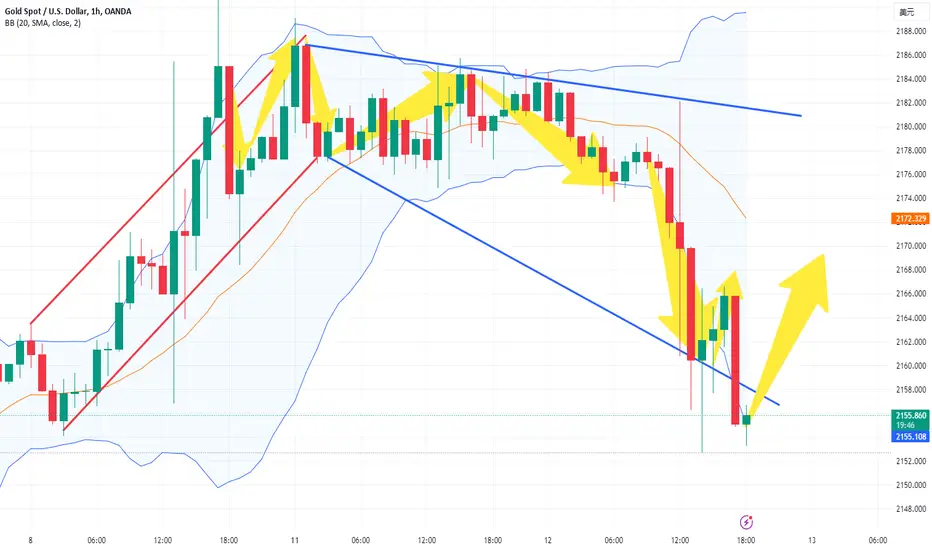
Gold trend analysis or bearish
Friends, under the influence of the negative CPI data, gold fell sharply as I expected, and once fell below the 2160 position. According to the current trend pattern, the gold pattern is developing in the short direction, while the bull pattern is no longer strong. Therefore, in this kind of market, we must pay special attention to the trading rhythm. Relatively speaking, I prefer to wait for gold to rebound to the 2170-2175 area before continuing to short gold.
I will share trading strategies and trading ideas every day. Listen to my signal and advocate seeking victory in stability and not making rash advances.
For those who want to make easy profits, follow me in the channel at the bottom of the article to get detailed trading signals. I hope that with my help, everyone can make huge profits!