Impact of the Non-Farm Payrolls? Latest Analysis.Information Summary:
Most traders are turning their attention to the crucial US labor market report, which is being closely watched as the market actively searches for new clues regarding the timing of the next interest rate cut this year.
The July non-farm payrolls report will be released at 8:30 AM US time. US non-farm payrolls increased by 110,000 in July, seasonally adjusted, lower than the 147,000 increase in June. The US unemployment rate is expected to rise from 4.1% to 4.2% in July.
If the non-farm payrolls figure falls below 100,000 and the unemployment rate rises, it could signal a weakening job market, undermining the Fed's rekindled hawkish outlook and dampening the dollar's upward momentum. In this scenario, gold prices could re-cross the 3,400 mark. However, if the non-farm payrolls unexpectedly exceed 150,000, it could support the dollar's continued rise and hurt gold. Strong US employment data could rule out two rate cuts from the Fed this year.
Market Analysis:
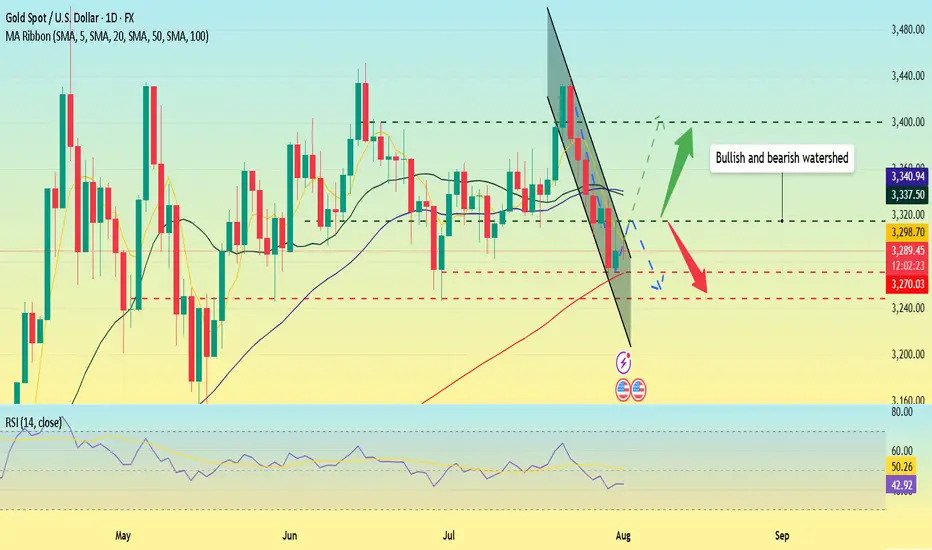
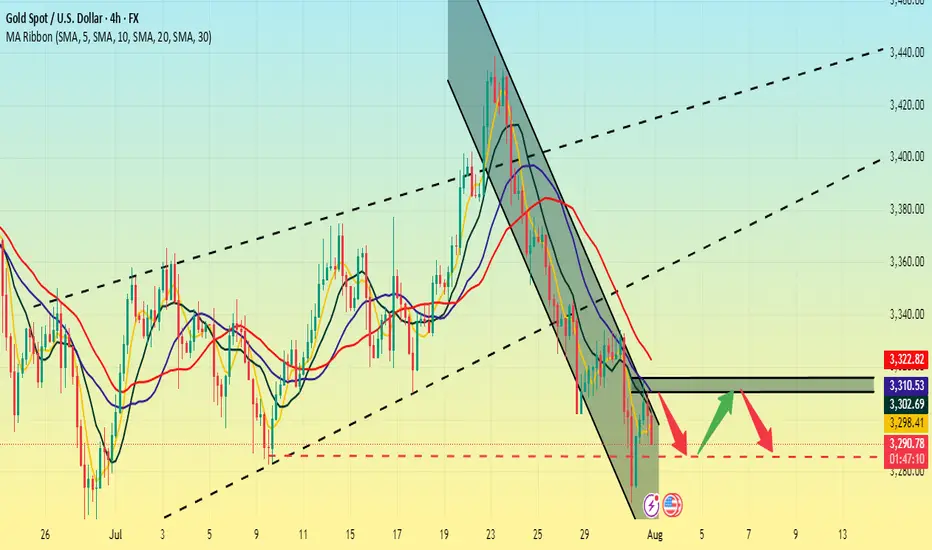
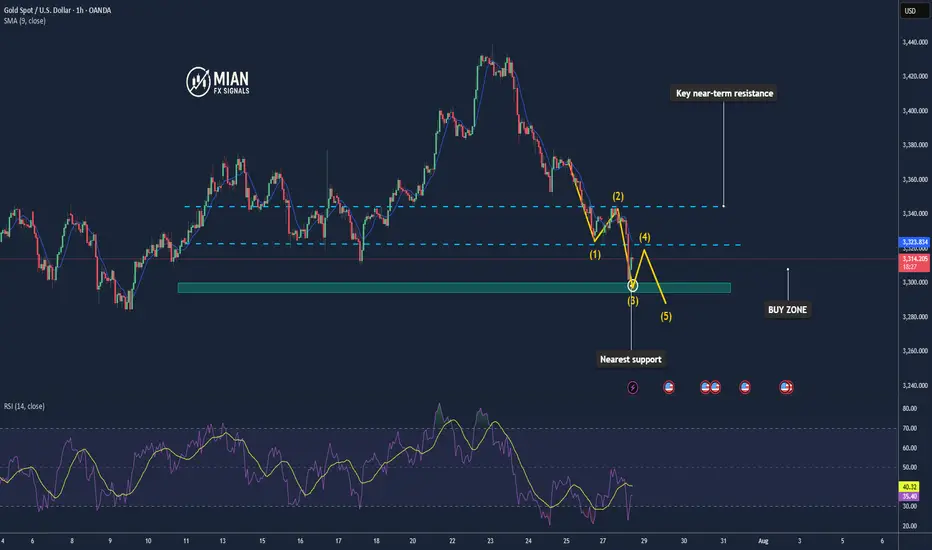
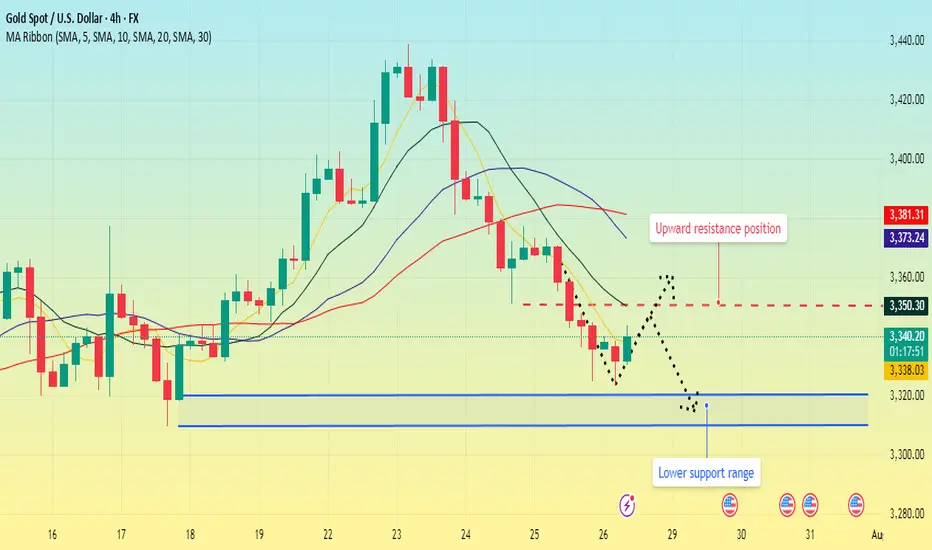
Quaid believes that the current moving average crossover is trending downward, and downward momentum is still in play. The RSI remains at 42.7, hovering below the midline, indicating that gold's downward trend remains intact. The 20-day moving average fell below the 50-day moving average on Wednesday, confirming the bearish momentum.
Therefore, if gold closes below the key support level of the 100-day moving average at $3,270 on a weekly basis, a new downtrend could begin, potentially leading to a drop towards the June 30 low of $3,248.
Quaid believes that the current bull-bear watershed needs to focus on around 3315, which is the previous intensive trading area and is also the first resistance position for short-term upward movement.
On the last trading day of Super Data Week, Quaid hopes that everyone has gained something and has a happy weekend; I wish you all good luck.
Goldinvesting
How to accurately grasp the gold trading opportunitiesGold was greatly affected by the positive non-farm payroll data, and it rose strongly, with the increase completely covering all the losses this week. The current gold trend has completely reversed the previous bull-short balance. After breaking through the 3300 level and rising to around 3355, it maintains strong upward momentum, and the possibility of further testing the 3360-3375 area cannot be ruled out. Due to the strong positive data, if everyone fails to chase the long position or set a breakout long position in time in the first wave of the market, the subsequent pullback opportunities may be relatively limited, so it is necessary to maintain an active strategy in operation. It is recommended to continue to be bullish when it retreats to the 3335-3320 area, and the upper target is the 3360-3375 pressure range.
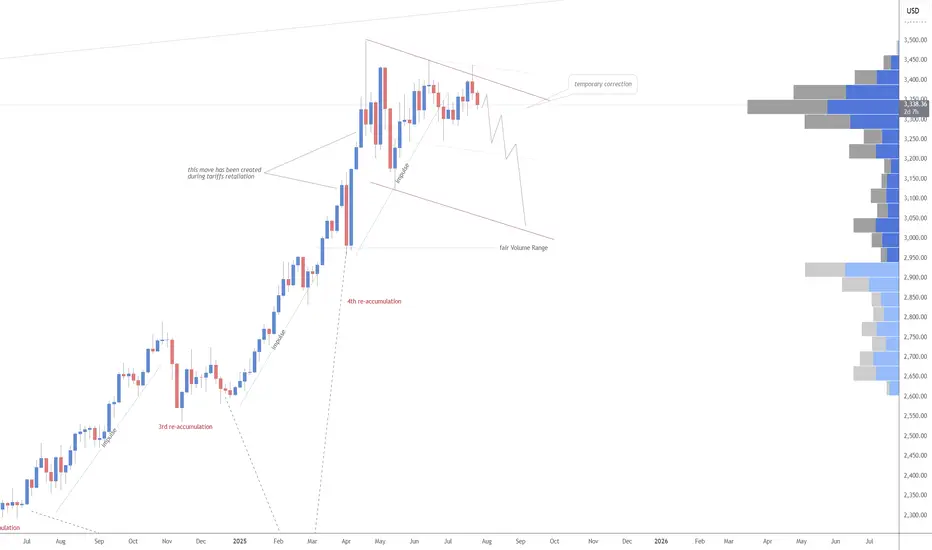
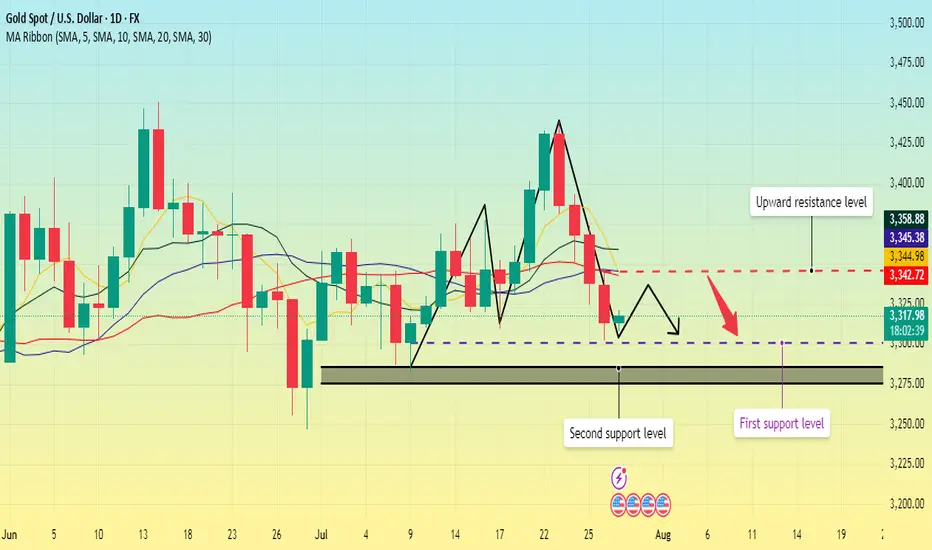
**"Gold Price Rebounding from Support:Potential Move Toward 3436This chart shows the **price movement of Gold (XAU/USD)** on a **daily timeframe**.
### Key Points:
* **Support Zone** : Around **\$3,266**, this is the area where price has bounced up multiple times, meaning buyers step in here.
* **Resistance Line**: Around **\$3,436**, this is the level where price has been rejected before, meaning sellers are strong here.
* **Current Price**: Around **\$3,293**.
### What the Chart Suggests:
* Price is near the **support** zone again.
* If the support holds, the green arrow shows a possible move **upward**.
* Price may first move up slightly, pull back, and then try to **break above resistance** at \$3,436.
Gold is in a sideways range. It's near a strong support level and might go up from here toward the resistance level, as shown by the green line.

Gold non-farm payrolls are bullish, long and short positions ana
Rather than envying the fish by the river, it's better to retreat and weave your net. We often envy the wealth others can earn by investing in the gold market. We often watch them enthusiastically investing, but we ourselves are afraid to enter the market. The two major factors that drive the market, technology and news, are a topic of constant debate among investors. To navigate the market, one must master the art of attack and defense to remain rock-solid while remaining at the forefront. As the saying goes, trust me, and I will reward you with profits!
Gold Data is Bullish!
The positive non-farm payroll data sent gold soaring, with gains completely erasing all of the week's losses. Currently, gold's trend has reversed the stagnant bullish and bearish trend. After breaking through the 3300 mark and rising all the way to 3348, it shows no signs of stopping. A further test of the 3370 level is not out of the question!
Due to the strong bullish data, if you don't immediately chase longs or place a breakout long order during the first wave, you'll likely have little chance of a pullback. Therefore, you should remain aggressive in your trading strategies. We recommend a pullback to the 3332-30 level to continue the bullish trend. Upward pressure is expected at 3372-75! The market fluctuates violently, and more real-time entry and exit points are mainly based on Yulia's real-time guidance!

Non-farm payrolls are coming. What's the gold trend?Gold fell sharply on Wednesday, but Thursday's market didn't continue the downward trend as some investors expected. Instead, it showed a trend of rising and then falling.
From the daily perspective, we first need to focus on the resistance level near 3300 where the 5-day moving average is located. This position is not only a short-term technical resistance, but also reflects the market's psychological expectations to a certain extent. If prices can successfully break through this level and stabilize above it, it will indicate that bullish momentum is strengthening, potentially boosting market sentiment. At this point, the next resistance area to watch is the 3330-3340 range. This area converges the 10-day, 20-day and 30-day moving averages, forming a strong resistance band.
As for the support below, the primary focus is Wednesday's low of 3268. However, if this level is lost and the price continues to fall, the next support area will be around 3245, which is the previous low.
Trading strategy:
Short around 3300, stop loss at 3310, profit range 3280-3260.
Is the uptrend complete? Will there be a pullback?On the last trading day of this week, gold prices soared, rising nearly $56, driven by the non-farm payroll data. The rally began at 3300 and peaked near 3356. The price has now retreated slightly, fluctuating around 3345.
The current uptrend has repeatedly tested the resistance level near 3355 but has failed to break through. The RSI indicator hovered around 76.8, indicating a gradual flattening of the upward trend. The 3355 high is likely the end of this uptrend.
As this is the last day of a major data week, Quaid believes the current uptrend is complete. Consider a light short position around 3350-3355. The current low has yet to be confirmed, and the pullback is likely to end around 3335.
However, we cannot rule out the possibility that the price will remain within the upward channel with slight fluctuations on the last trading day of the week.

Non-farm payrolls are coming. Will it trigger the market?On Thursday, the US dollar index briefly rallied after the Federal Reserve's favorite inflation indicator unexpectedly rebounded, crossing the 100 mark for the first time in two months. This marked the sixth consecutive trading day of gains and the first monthly gain since 2025.
Spot gold rebounded as risk aversion lingered amid uncertainty surrounding Trump's tariff deadline, reaching a high of around $3,315, but its intraday gains narrowed after the release of the PCE data.
The dollar has already firmly established itself above the 100 mark on the daily chart, so the next target is likely to be between 101.5 and 102.0. Currently, support levels on the daily chart are visible at 99.5 and 99.0.
The gold market is currently consolidating in the 3315-3275 range. However, if the dollar rises again, Quaid believes gold prices could fall below 3275.
On the daily chart, if it falls below 3275, the price would likely be around 3250. If 3250 falls below, the market could test 3200. However, the possibility of a consolidation between 3315 and 3275 remains undisputed.
Before the release of the non-farm payroll data, scalping within this consolidation range is advisable. However, the risk is relatively high, so please take profits in time.

XAUUSD: BUYThere are some good trading opportunities in the market. That's when to buy. Gold prices haven't fallen further since falling back to 3390. There's no further negative news. Therefore, there won't be a significant short-term decline. Our focus will be on tomorrow's non-farm payroll data update. This is a crucial factor that can cause gold prices to rise or fall significantly in the short term.
I'll update you with real-time buy and sell opportunities. This is based on research from the Swing Trading Center. It's highly authoritative. Don't miss out! Remember to stay tuned.
XAUUSD: BUY 3292-3282 TP 3320. SL 3265

Gold fluctuates. Is the decline halted?Information Summary:
Despite diminished market expectations for a September US rate cut, gold rebounded from a one-month low hit the previous session on Thursday, boosting its safe-haven appeal as newly announced US tariffs sparked new trade uncertainty.
So far, gold has risen 1.15%, hovering around $3,310, a gain of nearly $40 today. On Wednesday, gold prices hit their lowest point since June 30th: $3,267.79.
Market Analysis:
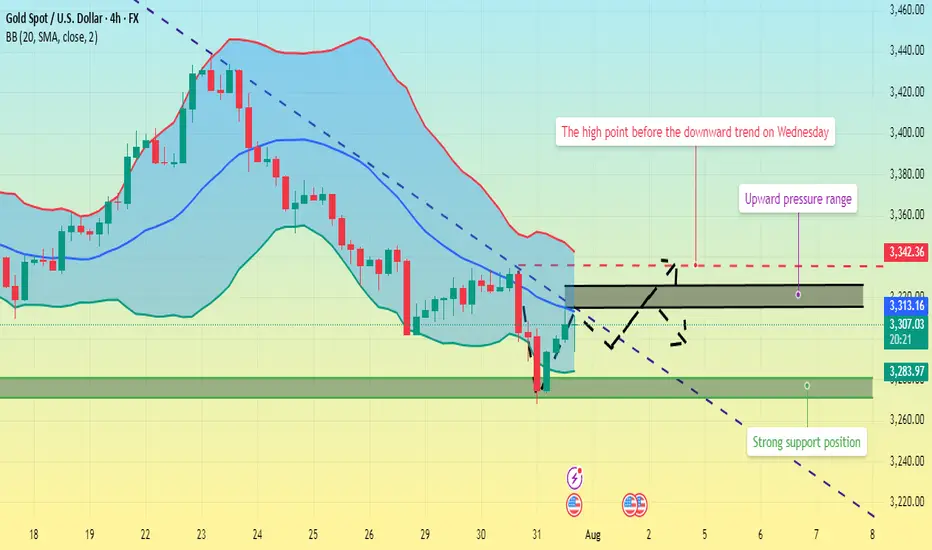
On the 4-hour chart, prices remain below the middle Bollinger Band, with a descending trendline defining the current bearish momentum. Prices rebounded after hitting this month's low on Wednesday. In the short term, watch for price rejection signals near the trendline. Upward pressure currently lies between $3,315 and $3,325, while support lies between $3,280 and $3,270.
Currently, prices are fluctuating upward. Quaid believes the bullish trend may continue. If the current resistance level is broken, it could reach the 3335 high before Wednesday's decline.
Trading strategy:
Go long near 3300, stop loss at 3290, profit range 3320-3330.
The US dollar is strong. Be wary of gold.The US dollar index rose, now above 100, before retreating slightly and fluctuating slightly, reaching 100 for the first time in two months. After a sharp drop to around 3270 on Wednesday, gold rebounded sharply today. With the US dollar breaking through 100 and the USD/JPY pair breaking through 150, gold is now struggling to maintain its position.
Thus, Quaid believes it's not appropriate to be overly bullish on gold for now. A significant decline is likely.
The 4-hour chart shows that the upper moving average resistance is currently around 3310-3315. If it breaks through 3315, it could potentially move towards 3325.
Conversely, if it fails to break through 3315 today, it could continue to consolidate in the 3315-3285 range. Waiting for new data to guide its trend.
GOLD Weekly Idea💡Why Gold Pulled Back
- Gold pulled back today after hitting $3439.04, just below resistance at $3451.53. Traders took profits ahead of key Fed and trade headlines. Right now, it’s trading around $3414.48, down 0.50%.
- The dip came after the U.S.-Japan trade deal eased geopolitical tension, cutting safe-haven demand. Plus, U.S. bond yields are climbing (10-year at 4.384%), which adds pressure on gold.
Support is building at $3374.42, with stronger buying interest expected around $3347.97 and the 50-day moving average at $3336.40 — a key level bulls want to defend.
Short-term looks a bit weak, but as long as gold holds above the 50-day MA, the bullish trend remains intact. Longer-term, weakness in the dollar, central bank gold buying, and concerns about Fed independence could push prices higher.
🔍Watching the Fed’s July 29–30 meeting next
Gold May Dip Mildly Before US Data📊 Market Overview:
Spot gold is trading around $3,329/oz, up ~0.1%, supported by falling U.S. Treasury yields and a slightly weaker dollar, while investors await potential Fed dovish signals or rate cut in September . Meanwhile, easing U.S.–EU trade tensions weighed on safe-haven demand for gold.
📉 Technical Analysis:
• Key Resistance: ~$3,335–3,350 (recent highs and potential test zone)
• Nearest Support: ~$3,310 (previous stable support)
• EMA09 position: Price is above EMA9, indicating a mild bullish bias in the short term
• Momentum/Volume: RSI ~53 (neutral), MACD & StochRSI showing small buy signals. However, bullish momentum is fading, suggesting a possible mild pullback
📌 Conclusion:
Gold may dip modestly toward $3,310 if the dollar strengthens or if Fed rate-cut expectations recede. A break above $3,335–3,350 could pave the way for further gains, though current momentum remains insufficient to confirm a breakout.
💡 Suggested Trade Strategy:
SELL XAU/USD: $3,333–3,336
🎯 Take Profit: 40/80/200 pips
❌ Stop Loss: $3339
BUY XAU/USD: $3,310–3,308
🎯 Take Profit: 40/80/200 pips
❌ Stop Loss: $3305

Gold Drops After Failing to Hold Above $3322📊 Market Overview:
Gold initially surged above the $3322 resistance, hitting $3329 amid Fed pause expectations. However, a rebound in the US dollar and profit-taking triggered a sharp drop back to $3315, signaling weakening bullish momentum.
📉 Technical Analysis:
• Key resistance: $3322 – $3330
• Nearest support: $3308 – $3300
• EMA09 (H1): Price has fallen below EMA09 → turning short-term trend bearish
• Candlestick / Volume / Momentum:
• Failed breakout above $3322 with strong bearish H1 reversal
• Increasing volume during the drop → rising selling pressure
📌 Outlook:
Gold may continue declining in the short term if it fails to hold above $3312. Bears have taken control after the failed breakout attempt. Risk increases for a move toward $3300–$3295.
💡 Suggested Trade Setup:
🔻 SELL XAU/USD : $3318 – $3321
🎯 TP: 40/80/200 pips
❌ SL: $3325
🔺 BUY XAU/USD: $3295 – $3292 (only with clear bullish signal)
🎯 TP: 40/80/200 pips
❌ SL: $3288

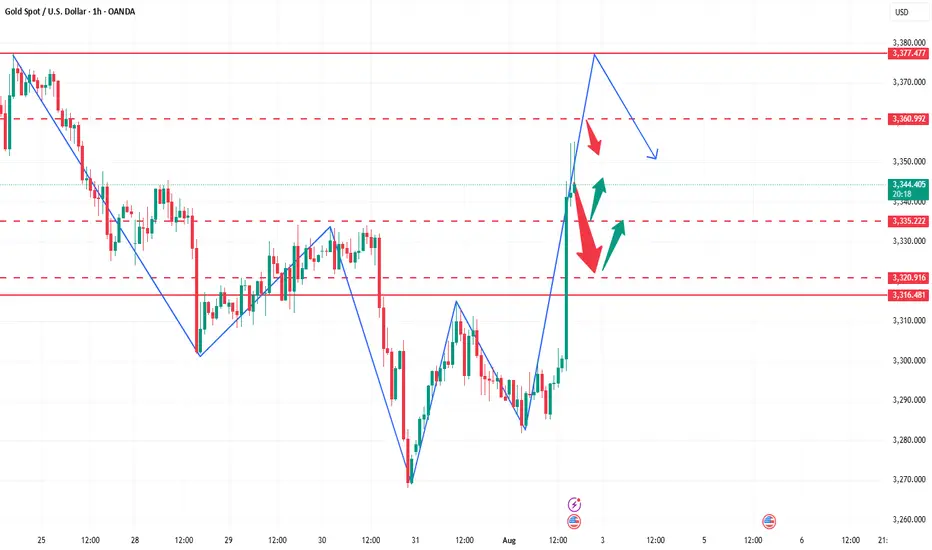
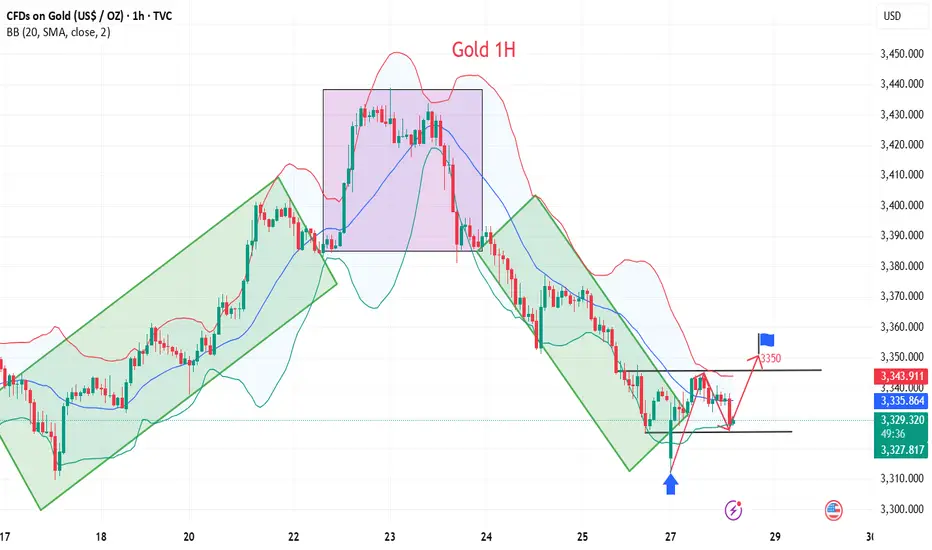
Bottoming out? Be wary of the market.After a sharp drop to around 3300 on Monday, gold rebounded, reaching a high of around 3330 so far.
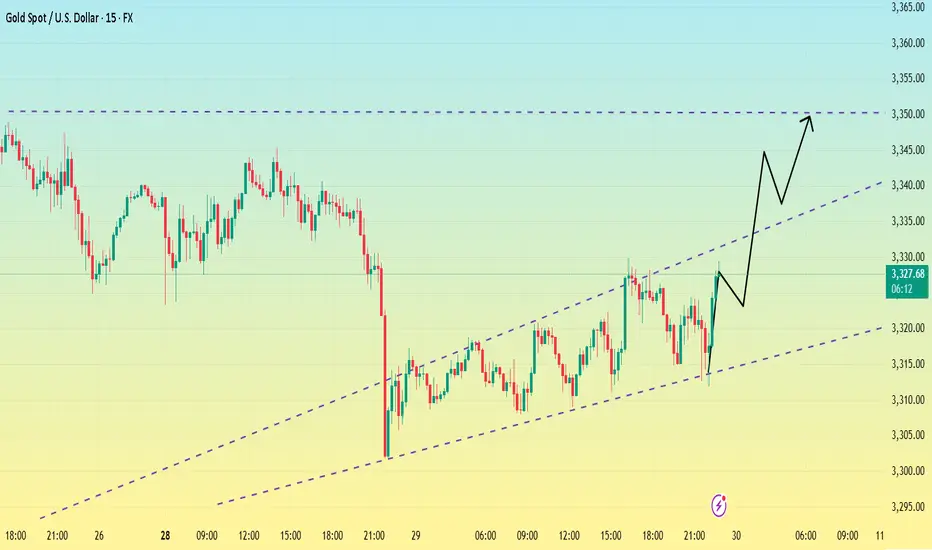
From the 1-hour chart,Gold has now broken out and stabilized within the hourly chart's downward trend channel. The key upward level is currently around 3330. If it breaks above 3330 again, caution is advised; it may test 3345-3350. Conversely, if it fails to break above 3330, gold may consolidate between 3300-3330 before the non-farm payrolls release.
From a short-term 15-minute perspective, the current 15-minute range has been broken out and stabilized. The current situation is unfavorable for bears. Based on the trend, a breakout above the 15-minute range would indicate a rebound. However, until 3330 holds, the 3320-3330 range is the only option. However, the current trend favors a bullish pullback, so I'm not too keen on shorting. Therefore, focus on support at 3320.
If it fails to break below 3320, enter a long position near 3320. The upper target is the top of the 3345-3350 range.
Gold Recovers After Sharp Drop – Trend Not Yet Reversed📊 Market Overview:
Gold rebounded from a sharp fall earlier in the session, rising from $3301 to around $3315 as the U.S. dollar weakened slightly and sellers took partial profit. However, no strong fundamental catalyst confirms a trend reversal yet.
________________________________________
📉 Technical Analysis:
• Key Resistance: $3315 – $3322
• Nearest Support: $3300 – $3295
• EMA 09 (H1): Price is currently just below EMA09, indicating a slight bearish bias
• Candlestick / Volume / Momentum:
• H1 candle shows a long lower wick at $3301 → some buying interest
• No H1 candle has closed above $3315 yet → no confirmed reversal
• Volume remains weak, RSI still under 50 → limited bullish momentum
________________________________________
📌 Outlook:
Gold may continue to consolidate between $3300 and $3315 in the short term. If it fails to close above $3315, bearish pressure could return toward $3295–$3288.
________________________________________
💡 Suggested Trade Setups:
🔻 SELL XAU/USD: $3315 – $3318
🎯 TP: 40/80/200 pips
❌ SL: $3323
🔺 BUY XAU/USD: $3295 – $3300
🎯 TP: 40/80/200 pips
❌ SL: $3285
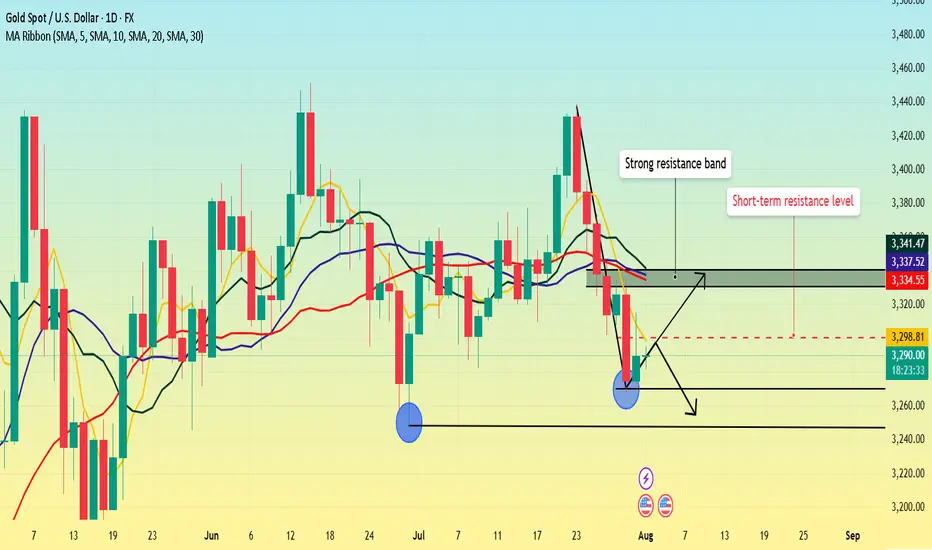
Gold repeatedly tested lows. Will it break through?On Monday, the Asian market opened low and rose in the early trading. In the European trading, it rose to around 3345. The European trading was under pressure and fluctuated. The US trading began to accelerate its decline, and the lowest point reached around 3302. Then it continued to fluctuate in the range of 3300-3320.
On July 27, the United States and the European Union reached a framework trade agreement; the agreement reduced market concerns about the global economic recession, promoted the attractiveness of risky assets, and boosted the stock market and the US dollar. Although Trump has repeatedly pressured for a substantial interest rate cut, the market has strong expectations for a September interest rate cut. The current expectation of maintaining a stable interest rate dominates the market, coupled with the strength of the US dollar, which puts gold prices under downward pressure in the short term.
Gold opened low in the early trading on Monday and then rebounded to recover the losses, but then fell below the low again, and the daily line closed in the negative, and now it has formed a four-day negative decline. MA5 and 10-day moving averages form a dead cross, and there is a downward turn.
The focus on the upper side is around Monday's high of 3345, which is also near the current position of MA5, 20, and 30-day moving averages. Below this position, gold is weak; if it breaks upward, it is necessary to prevent the possibility of a rebound correction.
The lower support first focuses on the 3300 integer mark; secondly, focus on the area around 3285-3275.
Operation strategy:
Short near 3340, stop loss 3350, profit range 3320-3300;
Long near 3300, stop loss 3290, profit range 3320-3340.
Before the release of US data on Tuesday, you can maintain this operation strategy; after the data is released, adjust the strategy based on the impact of the data.
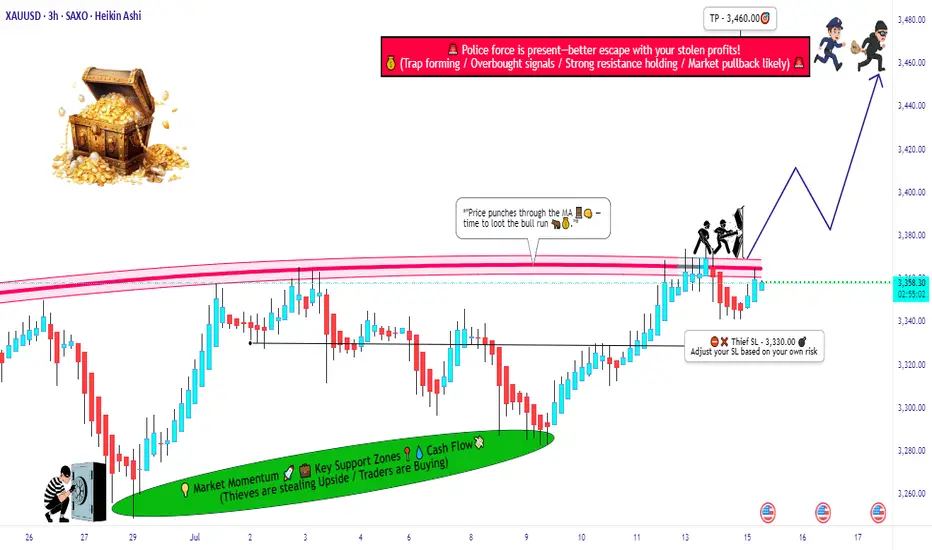
"XAU/USD Gold Heist Plan | Pullback Entry for Big Bullish Move"🔐💰“GOLD HEIST PLAN UNLOCKED: Thief Trader’s XAU/USD Breakout Blueprint”💰🔐
by The Market Robber a.k.a. Thief Trader – Stealing Pips, One Candle at a Time!
🌍 Hey Money Makers, Market Hustlers, Robbers, & Chart Crackers! 🌍
Bonjour! Hola! Marhaba! Hallo! Ola! What's poppin'?
Welcome to another exclusive robbery plan crafted in pure Thief Trading style—built off technicals, fundamentals, market psychology, and a bit of outlaw intuition. 💸⚔️
This one’s for the GOLD DIGGERS – literally. We’re targeting XAU/USD for a high-voltage bullish heist 🎯💥. Stick to the plan, follow the chart, and you might just make it out with a sack full of pips 💰🔥.
🔓 THE SETUP: GET READY TO ROB THE GOLD MARKET
We're eyeing a LONG ENTRY, with clear intent to break past the consolidation zone and avoid the trap laid by the "market police" at the ATR barricade zone 🚨. This level is where overbought drama and bear claws are strongest – we slip in, grab the profits, and bounce before they know what hit ‘em.
🧠 Use caution: This level is filled with liquidity traps, reversals, fakeouts and retail bait zones. Classic Thief style means we know where the guards are sleeping and where the cameras don't reach. 🎥🔕
💸 ENTRY PLAN:
🟢 Entry Zone: Watch for a pullback to 3320.00 or above. Don’t jump early.
💡 Tactics:
Use Buy Limit Orders (DCA / Layered Entry Style)
Drop them in on 15min/30min swing levels – catch price slipping into liquidity
Confirm with minor structure breaks / order block retests
🔔 Set those alerts – the real move happens when the breakout candle hits.
🛑 STOP LOSS STRATEGY:
🧠 Pro Rule: No stop-loss before breakout.
Once breakout confirms:
🔴 SL Zone: Recent swing low (approx. 3280.00) on the 4H chart
🎯 Adjust SL based on:
Lot size
Order count
Risk appetite
You know the game: manage your risk like a pro thief—quiet, calculated, and fast on the getaway. 💨
🎯 TARGET ZONE:
🏁 TP Zone: 3490.00
⚠️ Escape earlier if the pressure gets heavy – smart thieves never overstay the job.
🧲 SCALP MODE:
Only scalp LONG SIDE – don’t get caught chasing shorts unless you're rich enough to burn your drawdown 🔥
🔐 Use trailing SL to secure bags while climbing the ladder.
🧠 FUNDAMENTALS & MACRO EDGE:
The Gold market is currently in a BEAR structure with hints of bullish reversal potential. This heist isn’t just technical – it’s backed by:
🌍 Global Macro Flows
💼 COT Reports
📰 Sentiment & News Risk
💣 Geo-political Heat
📊 Intermarket Analysis (Dollar, Yields, Risk-On/Off correlations)
Dig deep for the full macro breakdown. Knowledge is leverage.
(Find full reports on reputable sources — you know where to look 👀)
🚨 RISK ALERT:
Before, During & After News Releases:
Avoid fresh entries 🔕
Use Trailing SLs to protect live trades
Watch spread spikes & low-liquidity traps
👉 Don't trade when the market's drunk.
💖 SHOW LOVE – BOOST THE PLAN:
💥Smash that Boost Button💥 if you want more precision heist strategies like this. Support the Thief Trading Style, and we’ll keep robbing the markets clean and teaching the crew how to get in & get out profit-heavy. 🏴☠️📈💰
🎭 I’ll be back with another chart crime scene soon. Until then, stay sneaky, stay profitable, and always move like the market’s watching (because it is). 😎
🔐 Thief Trader Out. Rob. Exit. Repeat. 🔁💸

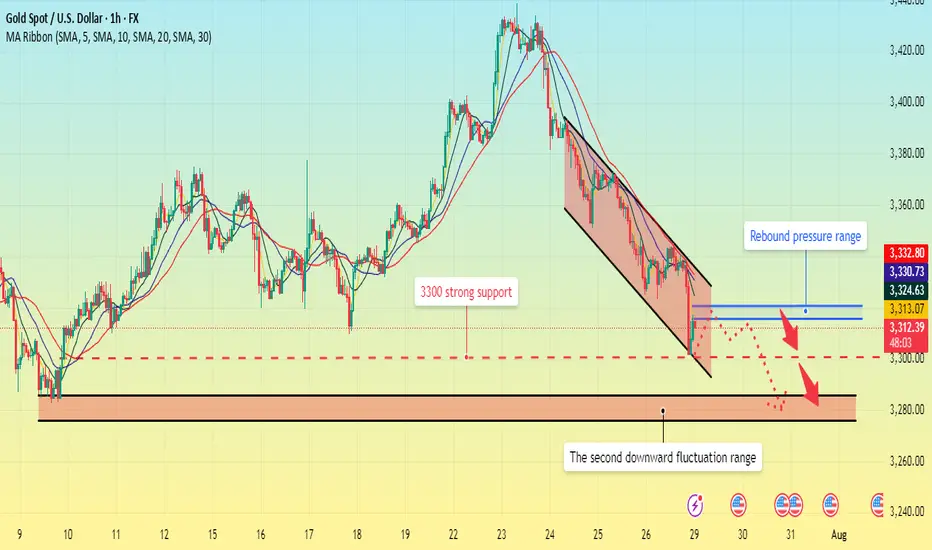
Gold fell below support. What will be the subsequent trend?The 1-hour moving average of gold continues to show a downward short position, indicating that the downward momentum is still sufficient; the wave pattern of gold's current decline remains intact, but the rebound strength is very weak, showing an obvious short trend of gold. Moreover, when gold rebounded in the short term, obvious resistance began to form above 3320, and the upward momentum was slightly insufficient.
From the daily chart, before 3300 fails to fall, it is likely to fluctuate around 3300-3350. On the contrary, if it falls below 3300, it is likely to reach the bottom of the 3385-3375 range.
This week is a super data week. The data of each day may affect the trend of gold on that day, but it will not form a unilateral strong trend. Therefore, the volatility before and after the data is released is likely to be large, so traders should focus on the following data:
1. US ADP employment report, US second quarter GDP preliminary value;
2. Federal Reserve interest rate decision;
3. US PCE annual rate, monthly rate;
4. The last trading day of this week will usher in non-agricultural data.
Gold short-term rise waiting for breakthrough
💡Message Strategy
During the Asian trading session, gold prices rebounded slightly from $3,320, filling the short gap at the start of the new week. As investors chose to stay on the sidelines before the Fed's two-day monetary policy meeting, the bullish force of the US dollar temporarily weakened, providing support for gold, an interest-free asset.
However, with the 15% tariff agreement between the United States and Europe and the positive progress of trade easing between the United States, Japan and the United States, market risk appetite has rebounded, weakening the appeal of gold as a safe-haven asset.
According to market surveys, "The current optimistic atmosphere of trade has weakened the safe-haven demand for gold, while the weakening of the US dollar has provided support for gold prices. The two forces offset each other, causing gold to fluctuate."
Investors are focusing on the FOMC meeting to be held on Tuesday. Although Trump continues to pressure the Fed to cut interest rates, the market generally expects that the interest rate will remain unchanged at this meeting because the US labor market remains strong.
In addition to the interest rate decision, this week will also usher in the US second quarter GDP estimate, PCE price index and non-farm payrolls report, all of which may have a significant impact on gold.
📊Technical aspects
From the technical trend, gold triggered a rapid correction after breaking below the lower edge of the short-term rising channel and the 50% Fibonacci retracement level last week. The current gold price stabilized in the $3,320 area and received some buying at the 61.8% Fibonacci support.
However, it is worth noting that the 200-period moving average on the 4-hour chart is at $3,350, which constitutes an important technical resistance for a short-term rebound. On the contrary, if gold breaks through the $3,350 level, gold will continue to develop a bullish pattern.
From the technical trend, gold triggered a rapid correction after falling below the lower edge of the short-term rising channel and the 50% Fibonacci retracement level last week. The current gold price stabilized in the $3,320 area and received some buying at the 61.8% Fibonacci support.
However, it is worth noting that the 200-period moving average on the 4-hour chart is at $3,350, which constitutes an important technical resistance for a short-term rebound.
On the contrary, if gold breaks through the $3,350 line, it will be expected to attack the $3,371-3,373 area in the short term, and further look to the key pressure levels of $3,400 and $3,440.
💰Strategy Package
Long Position:3320-3325,SL:3300,Target: 3350
Analysis of technical prospects for gold prices!Market news:
In the early Asian session on Monday (July 28), spot gold bottomed out and rebounded. At the beginning of the session, it continued the decline of last Friday to around 3320. As the United States and Europe reached a trade agreement, the international demand for gold hedging further declined. However, the price of gold was supported by bargain hunting and quickly recovered most of the decline. It is currently trading around 3337 US dollars per ounce. As the global reserve currency, the trend of the US dollar is crucial to the price of gold. Last week, the US dollar index rebounded from a low of more than two weeks, significantly pushing up the cost of gold for overseas buyers. The progress of US-EU trade negotiations has become another major driver of the recent decline in London gold prices. Although the demand for hedging has been suppressed in the short term, geopolitical uncertainty still provides long-term support for gold. At the same time, the trend of global central banks buying gold provides a solid bottom support for gold.Looking ahead to this week, the economic calendar will provide several high-impact data releases. The Federal Reserve will announce its monetary policy decision after the policy meeting on July 29-30. On Friday, the US Bureau of Labor Statistics will release the July employment report. If the number of non-farm payrolls (NFP) increases by more than 100,000, it may indicate that the labor market is in good enough condition that the Fed can prioritize controlling inflation and supporting the dollar when making policies. If the new non-farm payrolls data reaches or falls below 70,000, the dollar may find it difficult to find demand before the end of next week and help gold gain bullish momentum.
Technical analysis:
Technically, the gold daily chart forms a continuous negative structure, and the New York closing price re-loses the key support of the MA10-day moving average at 3360 and the middle track of the Bollinger Band. The RSI indicator breaks through the middle axis and runs in a short-term ... Pay attention to the rebound repair after selling low opening at the beginning of the gold week. The main idea is to sell at a high price and buy at a low price as an auxiliary.
Today's analysis:
Gold rebounded after opening low in the Asian session. Gold continued to refresh the low point. Then gold was obviously still in a selling trend. Since gold is still in a selling trend, it will continue to sell to the end. Gold rebounded in the Asian session and continued to sell. Gold continued to sell under pressure in the Asian session. Gold waited patiently for 3350 to continue selling in the Asian session. Gold's 1-hour moving average continued to cross downward and arranged for selling. There was basically no obvious rebound in this round of gold's decline. Then gold was likely to continue the short selling trend after the rebound correction. The wave structure of gold's current decline remained intact. Gold continued to sell under pressure near the last low of 3350.
Operation ideas:
Buy short-term gold at 3309-3312, stop loss at 3300, target at 3340-3360;
Sell short-term gold at 3350-3353, stop loss at 3362, target at 3320-3300;
Key points:
First support level: 3320, second support level: 3306, third support level: 3292
First resistance level: 3346, second resistance level: 3358, third resistance level: 3467

The US and Europe reached an agreement. Gold rebounded.At the current node, the EU and the US reached a tariff cooperation, 15% tariff + 600 billion US dollars for investment in the United States. The additional tariffs are considered a big deal, and the US has become the winner again this time.
Of course, this is a small negative for the current gold market.
From a multi-period analysis, the monthly chart price is still in a reverse K state. For the current situation, we need to pay attention to the gains and losses of the monthly highs and lows. The weekly chart shows that the price has continued to fluctuate at a high level recently. As time goes by, the weekly watershed is temporarily at 3320. After last week's high and fall, there is currently a further downward performance.
The four-hour chart shows that the price has continued to be suppressed after breaking through the four-hour support last Wednesday. The four-hour level resistance is currently around 3355, and the resistance level has moved up compared with the early Asian market. Therefore, we will pay attention to the pressure at this position in the future. If it fails to break through for a long time, it is likely to fall directly under pressure; pay attention to the support range of 3320-3310 below.
XAU/USD(20250728) Today's AnalysisMarket news:
Trump announced that the US and Europe reached a trade agreement: 15% tariffs on the EU, $600 billion in investment in the US, zero tariffs on the US by EU countries, the EU will purchase US military equipment, and will purchase US energy products worth $750 billion. However, the US and Europe have different statements on whether the 15% tariff agreement covers medicines and steel and aluminum. Von der Leyen: The 15% tariff rate is the best result that the European Commission can achieve.
US Secretary of Commerce: The deadline for tariff increases on August 1 will not be extended. The United States will determine the tariff policy on chips within two weeks.
Technical analysis:
Today's buying and selling boundaries:
3345
Support and resistance levels:
3393
3375
3363
3326
3315
3297
Trading strategy:
If the price breaks through 3345, consider buying in, the first target price is 3363
If the price breaks through 3326, consider selling in, the first target price is 3315

GOLD (XAU/USD) MA Breakout – High-Probability Long Setup!💰🚨 GOLD HEIST ALERT! XAU/USD MASTER PLAN (Thief Trading Style) 🎯
🔥 Steal Pips Like a Pro – High-Probability Gold Breakout Strategy! 🔥
🎯 Thief Trading’s GOLD Heist Strategy (Swing/Day Trade) �💸
👋 Hey there, Market Pirates & Profit Snatchers! 🌍✨
Based on our 🔥Thief Trading Style🔥 analysis, we’re plotting a major heist on XAU/USD (GOLD). The plan? Buy the breakout, escape before the cops (resistance) arrive! 🚔💨
📈 ENTRY ZONE: The Heist Begins!
🚀 "Wait for the MA Breakout (3400) – Then Strike!"
Bullish Confirmation: Enter on a 15M/30M pullback after MA breakout.
Thief’s Trick: Use Buy Stop above MA or Buy Limit near swing lows for best risk-reward.
DCA/Layering Strategy: Deploy multiple limit orders to maximize gains.
🔔 Set an ALERT! Don’t miss the breakout – thieves move fast! ⏳
🛑 STOP LOSS: Protect Your Loot!
📍 Thief’s SL Placement: 3330.00 (4H Swing Low) – Adjust based on your risk & lot size.
⚠️ WARNING: If using Buy Stop, DO NOT set SL until after breakout – unless you love unnecessary losses! 🔥
🎯 TARGET: Escape with the Gold!
🏴☠️ Take Profit Zone: 3460.00 (or Exit Early if Bears Show Up!)
Scalpers: Only trade LONG side – use trailing SL to lock in profits.
Swing Traders: Ride the wave but watch for resistance traps!
📰 MARKET CONTEXT: Why This Heist?
Neutral Trend (But Bullish Potential! 🐂)
Key Factors: Geopolitics, COT Data, Macro Trends, Sentiment Shift
🚨 News Alert: Avoid new trades during high-impact news – trailing SL saves profits!
💥 BOOST THIS HEIST! (Like & Share for More Pips!)
💖 Hit the 👍 Boost Button to strengthen our Thief Trading Crew!
🚀 More Heist Plans Coming Soon – Stay Tuned!
⚠️ DISCLAIMER (Stay Safe, Thieves!)
This is NOT financial advice. Do your own analysis & manage risk.
Markets change fast! Adapt or get caught.
🎯 Happy Trading, Pirates! Let’s Steal Some Gold! 🏴☠️💛