GOLD/USD Support Retest & Breakdown SetupGOLD/USD Support Retest & Breakdown Setup 📉🔍
🔹 Overview:
The chart indicates a potential bearish continuation pattern on GOLD/USD as the price is approaching a key support level at 3,335.305. Previous price action shows multiple rejections from the resistance zone (~3,435), followed by lower highs – a sign of weakening bullish momentum.
📊 Technical Analysis:
🔺 Resistance Zone (~3,435)
Multiple rejections (🔴 red arrows) indicate strong supply pressure.
Price has failed to break above this area thrice, forming a clear ceiling.
🔻 Support Zone (~3,335)
Marked as the target for a short setup.
Price is testing this level again after forming a minor consolidation below lower highs.
A clean break below this purple zone may trigger a continuation to the downside, targeting the broader support range below (~3,240).
🟠 Bearish Structure:
Series of lower highs (highlighted with circles).
Breakdown pattern is developing with declining bullish momentum.
📈 Potential Play:
A confirmed breakdown below 3,335 could lead to a drop toward the next major support.
If support holds, short-term bounce is possible but limited by the dominant resistance.
📌 Conclusion:
GOLD/USD is currently in a bearish setup, with the market eyeing a potential breakdown below a critical support zone. If this level fails to hold, we could see accelerated bearish momentum toward the lower support range.
💡 Caution: Wait for a confirmed close below support before entering any short trades.
Goldinvesting

Is 2025 the right time to make plans?Market news:
On Thursday (June 19) in the early Asian session, spot gold fluctuated in a narrow range and is currently trading around $3,380/ounce. As an important safe-haven asset in the global financial market, the price fluctuations of international gold are often affected by macroeconomic policies, geopolitical situations and market sentiment. Recently, the gold market has shown a complex and eye-catching trend under the dual influence of the Federal Reserve's interest rate decision and geopolitical tensions in the Middle East.The Federal Reserve decided to keep the benchmark overnight interest rate unchanged at 4.25%-4.50% at its meeting on June 18. This decision was in line with market expectations, but its subsequent statement brought new uncertainty to the London gold price market. This cautious stance weakened the market's expectations for the Federal Reserve's rapid easing, causing gold prices to fall 0.57% on Wednesday to close at $3,369/ounce.The current gold market is in a complex environment with multiple factors intertwined. The Federal Reserve's cautious monetary policy stance and inflation expectations caused by tariffs have brought short-term pressure on gold prices, but geopolitical tensions and signs of economic slowdown have provided potential upward momentum for gold prices. Pay attention to the dynamic changes in the global economy and geopolitics to seize investment opportunities in the gold market.
Technical Review:
Gold fell to the MA10-day moving average of 3662 in the early morning and counterattacked 3380 in the Asian session. The Asian session will continue to look at the rebound strength. The gold price will continue to fluctuate and adjust. The large range is 3408/3343, and the small range is 3390/3360. The daily chart fell back to the 10-day moving average at 3362, and the MA5/7-day moving average was suppressed at 3385/90. The RSI indicator continued to flatten the middle axis. The short-term four-hour chart price is running in the middle and lower tracks of the Bollinger Band!
This week, gold rose sharply to 3450 at the opening, and gradually fell slowly to 3365, with a strength of 100 US dollars. Although the main strength in the first two trading days was a decline, the buying trend remained unchanged. In an uncertain environment, there is still a chance of a big rise in the future. So this week's idea continues to maintain short-term selling and long-term buying.
Today's analysis:
After the Fed's interest rate decision, the Fed kept the interest rate unchanged as expected, which was in line with market expectations. Gold continued to fluctuate and fall in the short term, and there was no obvious upward momentum for buying. Even if it was a risk aversion, it might be careful of the trend of rising and falling. Since gold was under pressure at 3400, it continued to sell at high prices when it rebounded under pressure at 3400 during the day.The gold 1-hour moving average continued to sell downward dead cross patterns, and the gold buying rebound was weak. It was under pressure at 3400 for many times in the past two days and began to fall. The short-term 3400 line of gold has become a strong resistance. If gold buying cannot break through 3400 strongly, then gold buying will be difficult to improve. It is likely that it will still be the main venue for gold selling. Gold rebounded at 3400 during the day and continued to sell at high prices.
Operation ideas:
Short-term gold 3365-3368 buy, stop loss 3356, target 3390-3440;
Short-term gold 3395-3398 sell, stop loss 3407, target 3370-3350;
Key points:
First support level: 3368, second support level: 3354, third support level: 3333
First resistance level: 3396, second resistance level: 3408, third resistance level: 3420

Data is stable. Will the price go down?Information summary:
The Fed kept the benchmark interest rate unchanged at 4.25%-4.50%, and did not make a rate cut decision for four consecutive meetings, which was in line with market expectations. The Fed said that uncertainty about the outlook has eased, but it is still at a high level. The Fed lowered its GDP forecast for 2025 to 1.4%, while raising its inflation forecast to 3%.
The Fed kept interest rates unchanged, which may suggest that the pace of future rate cuts will slow down.
Market analysis:
From the current 4-hour chart:
The price has fallen below the key support level of 3380. If it returns to below 3370 again, it is very likely to reach today's low. The low point of the downward trend is at the extreme position of 3350-3330.
From the hourly chart, the downward range has also been broken. The early rebound in the Asian market also failed to stabilize above the support level. Then from the hourly Fibonacci, the 0.382 position below is around 3350.
Therefore, if it goes down, the first target is also around 3350.
Operation strategy:
Short around 3380, stop loss at 3390, profit range 3350-3330.

Interest rate decision bearish
Today, the focus is on the Fed's latest interest rate decision, which will be announced on Wednesday. The market generally expects that it will maintain the policy rate range of 4.25%-4.50%. Trump recently asked the Fed to cut interest rates by one percentage point immediately, but the market reacted cautiously, believing that a sharp rate cut may increase inflation risks, especially in the context of Middle East conflicts pushing up oil prices. Fed Chairman Powell's statement at the press conference will become the focus of market attention. The market expects the Fed to maintain a cautious and patient tone, and the guidance on the interest rate outlook may be vague.
Technically, in terms of support, the 10-day moving average and the 20-day moving average form important support near 3464/3463 and 3445 respectively. In terms of resistance, yesterday's high near 3403 constitutes a key resistance above. If gold prices want to reverse the current weak pattern, they need to successfully break through this resistance level to open up upward space.
Today's detailed operation strategy
Short gold rebounds near 3400, defense 3410, target 3380-3364
Long gold falls back near 3364, defense 3356, target 3380-3400

XAU/USD(20250618) Today's AnalysisMarket news:
World Gold Council: 95% of central banks expect gold reserves to rise in the next 12 months.
Technical analysis:
Today's buying and selling boundaries:
3385
Support and resistance levels:
3422
3408
3400
3371
3362
3349
Trading strategy:
If the price breaks through 3400, consider buying, the first target price is 3408
If the price breaks through 3385, consider selling, the first target price is 3360

Data is about to be released. Will it affect the trend of gold?Information summary:
The Federal Reserve is about to announce the latest interest rate decision, and the market generally expects it to maintain the policy interest rate range of 4.25%-4.50% unchanged. Trump recently asked the Federal Reserve to cut interest rates by one percentage point immediately. However, the market reacted cautiously to this, believing that a sharp interest rate cut may increase inflation risks, especially in the context of Middle East conflicts pushing up oil prices.
Fed Chairman Powell's statement at the press conference will become the focus of market attention. The market expects the Fed to maintain a "cautious and patient" tone, and the guidance on the interest rate outlook may be vague.
Market analysis:
Technical indicators, from the daily chart, the support level is near the 10-day moving average and the 20-day moving average, and the 3365-3345 range forms an important support. In terms of resistance, yesterday's high near 3405 constitutes a key resistance above. If the price wants to reverse the current weak pattern, it needs to break through this resistance level strongly to open up the upward space.
From the 1-hour chart, the price started to fall after reaching a high point, and maintained stability in the upper and lower ranges; it is now close to the low point in the early trading, and the trend is relatively slow.
In the absence of an upward or downward breakthrough, we still follow the strategy of selling high and buying low.
Short around 3400, stop loss 3410, profit range 3380-3365;
Long around 3365 when the price falls back, stop loss 3355, profit range 3380-3400.

GOLD/USD Bearish Rejection at ResistanceGOLD/USD Bearish Rejection at Resistance 📉🟥
🔍 Technical Analysis Overview:
The GOLD/USD chart shows a clear bearish rejection pattern forming near the resistance zone around $3,450, marked with red arrows. After price tested this level twice, strong selling pressure appeared, resulting in a sharp decline.
📌 Key Observations:
🔴 Resistance Zone:
Price was rejected from the resistance area around $3,450 twice, indicating strong seller presence.
Double top-like behavior seen with lower highs confirming weakening bullish momentum.
🟠 Support Zone:
A well-respected support level near $3,250 has been identified based on past reaction (highlighted with orange circles).
Price previously bounced twice from this zone, validating it as a strong support level.
🎯 Target Level:
A near-term target of $3,305.586 is marked, which aligns with previous reaction zones and short-term structure support.
If momentum continues, a deeper push toward $3,250 support is probable.
📉 Bearish Bias Justified By:
Clear rejection from resistance
Lower high formation
Current consolidation with downward bias
Possible breakout to downside if $3,305 fails to hold
⚠️ Risk Note:
If price retraces and breaks back above $3,400 with volume, the bearish setup will be invalidated.
📊 Conclusion:
The chart favors bearish continuation with a primary target around $3,305, and extended downside to $3,250 if bearish pressure sustains. Traders should watch for bearish confirmation patterns below current price before engaging.
🔽 Resistance: $3,450
🔼 Support: $3,250
🎯 Target: $3,305

Gold fluctuates under pressure. Can it break out?Information summary:
The conflict between Iran and Israel has entered the fifth day, Tel Aviv air raid alarms are frequent, and the fire of oil tankers in the Strait of Hormuz has exacerbated the panic of energy transportation, and safe-haven buying supports gold prices;
Trump's contradictory statement of "peace talks + toughness" has exacerbated the market's differences on the direction of the conflict, and risk aversion has fluctuated repeatedly.
In the early Asian session, spot gold fluctuated narrowly at $3,375, continuing the stalemate under the geopolitical conflict and the game of the US dollar. As the "king of safe havens", gold has recently bottomed out and rebounded based on the tension in the Middle East, and the current price fluctuates around 3,395.
Market analysis:
The four-hour chart shows that the moving average is sticking to wait for a breakthrough in the direction, and the short-term moving average is sticking to $3,380. The RSI indicator fluctuates around 50, suggesting that a breakthrough will be ushered in after a narrow consolidation; the lower rail support of the rising channel moves up to $3,370, and if it fails, it may test $3,350.
At present, the price is repeatedly testing the resistance position of 3400. If the price stands above this position, it may continue to rise to around 3430. If it breaks the support of 3370 US dollars, it will look to 3360 US dollars.
Operation strategy:
Short near 3400, stop loss 3410, profit range 3370-3365.
If the price falls back to around 3370, you can try to go long, and the profit point is around 3390.

Gold may usher in new opportunities
Key fundamental drivers
- Middle East tensions and nuclear negotiations Despite the ongoing tensions, Iran's signal of restarting nuclear talks has reduced risk aversion, triggering an intraday sell-off in gold, and the market has digested the reduced possibility of escalation of the conflict. The turbulent situation in the Middle East remains a trigger for market volatility, and any downgrade/escalation signals may trigger sharp fluctuations in gold prices.
- Fed policy and rate cut bets The Fed kept interest rates unchanged this week, but Powell's "data-dependent" stance has raised market expectations for a September rate cut to 60%. A dovish meeting statement could push gold prices above $3,400, while a delayed rate cut signal could drag gold prices to $3,350.
Short-term outlook
In the short term, gold prices may fluctuate between $3,350 and $3,450, and a breakthrough depends on:
- Upside catalyst: Escalating tensions in the Middle East + weak retail sales data may push gold prices to $3,450.
- Downside risks: Fed hawkish signals + fading geopolitical risks could push prices to $3,300.
Key event risks
- June 19: Fed policy meeting (expected to be dovish)
- June 21: US CPI data (inflation indicator to measure the timing of rate cuts)
- Middle East situation: progress in nuclear negotiations and conflict dynamics
💰Strategy Package
Set gold price:
🔥Sell gold area: 3390-33396 SL 3400
TP1: 3380 US dollars
TP2: 3375 US dollars
🔥Buy gold area: $3374-$3366 SL $3360
TP1: 3390 US dollars
TP2: 3400 US dollars

Gold is under pressure! What is the key to breaking the deadlock
📌 Core driving events
The conflict between Iran and Israel has entered the fifth day. Air raid alerts in Tel Aviv are frequent. The fire on a cruise ship in the Strait of Hormuz has exacerbated the panic of energy transportation. Safe-haven buying supports gold prices;
Trump's contradictory statement of "peace talks + tough" (may send executives to meet but demand "unconditional surrender") has exacerbated the market's disagreement on the direction of the conflict, and risk aversion has fluctuated repeatedly.
The Federal Reserve will announce its interest rate decision today. The market expects it to remain unchanged at 4.25%-4.50%, but Powell's statement on rate cuts will affect the trend of the US dollar (Trump continues to pressure for a 1 percentage point rate cut).
📊Comment Analysis
1-hour chart: 3396 becomes the intraday strength and weakness watershed
The Asian morning session hit a high of 3396 US dollars and fell back. This point is the previous high pressure point. If the intraday rebound does not break through this position, the bearish thinking will be maintained;
💰Strategy Package
Set gold price:
🔥Sell gold area: 3390-33396 SL 3402
TP1: 3380 US dollars
TP2: 3375 US dollars
🔥Buy gold area: $3374-$3368 SL $3362
TP1: 3390 US dollars
TP2: 3400 US dollars
⭐️ Note: Labaron hopes that traders can properly manage their funds
- Choose the number of lots that matches your funds

Gold is weak, and there may be a low point yet to come!According to the current structure, gold is obviously in a weak position. Gold has failed to break through the high point of the previous wave after multiple rebounds during the day. 3400 has become a new round of pressure area; and gold has just accelerated its decline and fell below 3370. For the current trend, falling below 3370 will weaken the bullish sentiment to a certain extent and indicate that there is further room for decline, so I think gold should have a low point, and the low point we should first pay attention to is in the range of 3365-3355.
So in terms of short-term trading,
First, we can try to short gold with the short-term resistance area of 3395-3405;
But if gold first retreats to the support area of 3365-3355, we can first choose to go long on gold.

Gold continues to fall. Will there be a lower point?Gold is still under pressure at the integer mark of 3400. During the US trading session, the lowest point reached around 3366. For the current trend, it fell below the short-term support area of 3375, so the market has the possibility of further downward movement to test the support of 3350.
Today, Iran launched missiles again, but there was no threat to Israel at all, and all the missiles were intercepted. Under the current trend of further decline, the support position that needs to be paid attention to is 3350. At this position, you can try a long strategy, and the early support point of 3400 above has turned into an upward pressure point.
Short-term operation strategy:
Buy near 3350, stop loss 3340, profit range 3380-3390.
Above, you need to pay attention to the important pressure level of 3390-3400. The market changes violently, and you can take profits at the right position. Avoid rapid changes in market conditions and losses.

Continue the rally, get ready for gold to return to 3443
⭐️Gold News:
Gold prices (XAU/USD) fell for the second consecutive trading day on Tuesday, retreating from the gains in the early Asian trading hours, which had briefly pushed above $3,400. A slight rebound in the US dollar (USD) continued to put pressure on the precious metal, acting as a major resistance. However, the downside for gold seems limited due to escalating geopolitical tensions in the Middle East and growing market expectations that the Federal Reserve (Fed) will further cut interest rates in 2025.
Meanwhile, the ongoing air conflict between Israel and Iran has entered its fifth day, exacerbating concerns about further escalation in the region. This ongoing geopolitical uncertainty supports demand for safe-haven assets such as gold. Investors also remained cautious ahead of the Federal Open Market Committee (FOMC)'s two-day policy meeting, the outcome of which could affect the next move of non-yielding gold.
⭐️Technical analysis:
Gold price gets liquidity from the support level below: 3385, 3373 completed, short-term downward trend breaks, gold price will soon return to above 3400.
Set gold price:
🔥Sell gold area: 3443-3453 SL 3458
TP1: $3435
TP2: $3422
TP3: $3407
🔥Buy gold area: $3358-$3350 SL $3345
TP1: $3368
TP2: $3376
TP3: $3390
GOLD/USD Bearish Rejection at Resistance ZoneGOLD/USD Bearish Rejection at Resistance Zone 📉🟥
📊 Technical Overview:
The chart for GOLD/USD shows a clear price action behavior between a well-defined resistance zone (~3,480–3,510) and a support zone (~3,260–3,280).
🔻 Bearish Signals:
The price has tested the resistance zone multiple times (highlighted with red arrows and orange circles) but failed to break above it, indicating strong selling pressure.
The current price action suggests another lower high formation, which is a bearish signal 📉.
Recent candles are rejecting the upward move, pointing to potential downside movement.
🟩 Support Confirmation:
Previous reactions from the support zone (green arrows) show that buyers have consistently stepped in near the 3,260–3,280 range.
This level remains a key demand zone where a bounce might be expected.
🔁 Outlook:
If the price continues to reject the resistance and follows the pattern, we might see another drop towards the support area.
A break below the support zone would confirm a bearish breakout and could open the door to deeper downside targets.
📌 Conclusion:
GOLD/USD is trading within a range, but the repeated failures at resistance suggest bearish momentum might take control in the short term. A move back toward the support zone is likely unless a breakout above resistance occurs.
📉 Resistance: 3,480–3,510
🟩 Support: 3,260–3,280
🔍 Bias: Short-term Bearish unless resistance breaks

Is gold a short-term correction or a bull market turning point?Market news:
The London gold price has experienced a significant correction after hitting an eight-week high. Spot gold fell more than 1% on Monday, wiping out all the gains of last Friday. However, the escalation of geopolitical tensions in the Middle East, especially the continued conflict between Israel and Iran, still provides support for international gold prices. The upcoming Federal Reserve policy meeting has become the focus of market attention.The continued tension in the Middle East is an important driving factor for the recent fluctuations in spot gold. The conflict between Israel and Iran has escalated significantly since June 12. Israel's air strikes on the Iranian National Radio and Television Building and the Natanz uranium enrichment plant have caused serious damage to Iran's nuclear facilities. In addition to geopolitical factors, the policy trends of the Federal Reserve also have an important impact on international gold.For gold, the Federal Reserve's maintenance of high interest rates usually puts pressure on its price, because gold, as an interest-free asset, is less attractive in a high-interest rate environment. However, geopolitical risks and rising inflation expectations may offset some of the negative impacts, causing gold prices to remain volatile in the short term. Investors should pay close attention to the latest developments in the situation between Israel and Iran, the results of the G7 summit, and the Federal Reserve's economic forecasts, while being wary of the short-term impact of market sentiment and technical factors on gold prices. The monthly rate of US retail sales (commonly known as "horror data") will also be released on this trading day, and investors also need to pay close attention!
Technical review:
Technically, the daily price of gold is still running above the MA10/7-day moving average at 3364, the RSI indicator is above the value of the middle axis 50, and the price is running in the upper track of the Bollinger Band channel. The short-term four-hour chart MA10/7-day moving average high 3420 dead cross opens downward, the price pulls back to the middle track of the Bollinger Band, and the RSI indicator retreats to the middle axis. The short-term formation is a bearish shock and fall, but the gold price is still in the buying structure channel on the daily and weekly charts. The main idea of today's trading is to sell at a high price and buy at a low price! Gold began to pull back when the situation eased. The fermentation of this round of news was relatively restrained by large funds, and did not test the high point of 3500 upwards. Overall, the increase in gold prices was not large, and there was still a process of pulling. The fundamentals have not changed, and gold is still in a bull market. As we said before, if we keep above the key point of 3400, gold will continue to be bought. Now that it has fallen below 3400, the short-term has gone out of the small-level top, and the market is no longer so strong. For our short-term operations, the short-term correction of gold prices should focus on the daily cycle MA5 support and the weekly level MA5 support to buy!
Today's analysis:
Gold continues to weaken in the short term. After the rapid decline last night, the rebound strength is not strong at all. It is obvious that there is a large selling pressure above. For the market that broke the original upward trend, we also said last night that the decline is not very large. It just changed from buying to shock. Our intraday operations can be sold in the short term first!Although gold has fallen below 3400, the short-term direction has changed, but the general direction has not changed. It is still buying. In the future, we still have the opportunity to look at the high point of 3500, but we have to wait for the bottom to stabilize before we go to buy the bottom. I will say later that in the current market, we can only follow the trend. We will do whatever the market goes!
Operation ideas:
Buy short-term gold at 3383-3385, stop loss at 3372, target at 3420-3440;
Sell short-term gold at 3420-3423, stop loss at 3432, target at 3390-3370;
Key points:
First support level: 3383, second support level: 3372, third support level: 3353
First resistance level: 3418, second resistance level: 3430, third resistance level: 3450

Citigroup predicts a decline in gold prices? Blacklisted?Information summary:
Citigroup analysts predict that by the second half of 2026, gold will fall back to around $2,500-2,700, with a significant reduction in investment demand, improved global economic growth prospects, and a decline in the factors that led to the rise in gold prices due to the Fed's interest rate cut.
My point of view is: blacklist Citigroup. Since last year, they have predicted that the highest point of gold prices will exceed $4,000, and they have constantly changed the forecast point in the middle, and now they even point out that the price will fall below $3,000, which is completely unreliable.
Market analysis:
In the early Asian session, it also rose strongly, and it seems that there is a lot of upward momentum, but $3,405 is the pressure position for the top and bottom conversion, and the rise in the morning is a lure. At this position, it fell rapidly, reaching a minimum of around $3,373.
The Asian market seemed to rebound strongly in the morning, but the MA5 and MA10 moving averages showed a downward trend. This kind of market cannot wait for a decline to go long, but it is also a repeated wash-out shock. The first focus below is the 3375-3370 area, followed by 3360. The short-term trend is still dominated by wash-out shocks.
The short-term important focus position is around 3405. 3405 is used as the dividing point between long and short positions. A short-selling strategy is carried out near this position. Pay attention to the 3375-3360 area below.

Geopolitics and Fed policies dominate the trend of gold prices
📌 Gold news
On Monday, boosted by the risk aversion of the Iran-Israel war, the gold price hit a high of 3452, but the continuity was not strong, and a series of other adjustments appeared; let's briefly sort it out:
1: Adjustment: Adjustment is normal. If the market rises, if the risk aversion does not continue to exert force, then the gold price can only return to technical adjustments. Therefore, Monday's adjustment trend and the decline trend are normal!
2: Risk aversion trend: The risk aversion trend will not be reversed for the time being! Once the war starts, it will not end easily; unless the interests of both sides are not damaged, the two sides agree to a ceasefire, but at present, the hope and probability are relatively small, so the risk aversion trend is the mainstream of the current global market;
3: The direction of the Iran-Israel war is nothing more than a few possibilities:
A: The war expands, the surrounding countries stand in line, and the US and Western imperialism join the battlefield; the war expands rapidly! At the same time, Iran is forced to block the Strait of Hormuz! This is a manifestation of escalating war;
B: Both sides, as well as the forces behind them, have calculated their interests, reached an agreement, and agreed to end the war conflict; this mainly depends on Iran's attitude; is it "powerful and unyielding", continuing to oppose the United States and imperialism; or is it pro-American, completely changing its identity, or changing its identity to submit to Israel and the United States;
To sum up: risk aversion eased slightly on Monday, but the overall global market is still risk-averse; technical adjustments are normal trends; but don't completely ignore the importance of risk aversion and risk aversion control because of technical adjustments; in addition, the subsequent results of the Middle East war are nothing more than the above two; what determines all this is the attitude of both sides;
📊Comment Analysis
Although the gold price fell below 3400 and the short-term trend changed, the general direction still remains bullish. In the future, it is still expected to hit the high point of 3500, but it is necessary to wait patiently for the bottom to stabilize before choosing the opportunity to buy the bottom. The current market is changing rapidly, and investors should adhere to the principle of following the trend and flexibly adjust their trading strategies.
💰Strategy Package
Short-term gold 3383-3393 long, stop loss 3372, target 3420-3440;
Short-term gold 3420-3430 short, stop loss 3435, target 3390-3370;
⭐️ Note: Labaron hopes that traders can properly manage their funds

Middle East tensions ease? Prices fall?Information summary:
Iran sent a peace signal to the United States and Israel through Arab intermediaries - requiring the United States not to carry out air strikes as a prerequisite for restarting nuclear negotiations, and emphasizing to Israel that controlling violence is in the common interest.
Under the influence of this news, gold turned downward several times, reaching a low of $3,383, and then rebounded slightly. The current price fluctuates slightly above $3,400.
Market analysis:
Technical analysis shows that the current price has broken through the key resistance area of the previous high and the middle track resonance. The 4-hour chart continues to be bullish under the support of the middle track, and the short-term sideways adjustment is a normal accumulation of upward momentum.
If the integer mark of $3,400 can be maintained, the hourly chart is expected to continue the upward trend after a narrow range of fluctuations, and accelerate to a new high after breaking through; on the contrary, if this position is lost, it is necessary to be vigilant about the risk of trend reversal.
The geopolitical crisis continues to ferment, injecting medium- and long-term safe-haven demand into gold. Combined with the strong closing pattern at the weekly level, the core operation strategy should be to buy on the pullback, focusing on the 3400-line long-short dividing line. At present, the price can be arranged for long orders, and the target will be the previous high point after breaking through 3415, but the risk of falling back from the high point must be strictly prevented.
Good luck to everyone in the new week.

Iran releases easing signals, gold is still bullish
📣Golden News
1. Iran sends a signal of easing. U.S. media reported that under the pressure of Israeli air strikes, Iran has used Arab intermediaries to send a peace signal to the United States and Israel - asking the United States not to carry out air strikes as a prerequisite for restarting nuclear negotiations, and emphasizing to Israel that controlling violence is in the common interest.
2. Israel's firm stance. Israeli warplanes fly freely over the Iranian capital, and Iran's counterattack is ineffective. Israel is still focused on dismantling Iran's nuclear facilities and weakening its theocratic regime, and there is no motivation to cease fire in the short term.
3. Gold's reaction and strategy. Iran's peace proposal caused the price of gold to plummet to as low as $3,382. However, since the situation in the Middle East has not eased significantly, it is recommended to buy on dips and pay attention to the support level of $3,400. ⭐️Set gold price:
🔥Sell gold area: 3465-3475 SL 3485
TP1: 3450 USD
TP2: 3440 USD
TP3: 3430 USD
🔥Buy gold area: 3390-3388 USD SL 3383 USD
TP1: 3400 USD
TP2: 3410 USD
TP3: 3422 USD

Gold continues to rise! When will the price of gold fall?Market news:
In early Asian trading on Monday (June 16), London gold prices continued to rise last week, hitting a nearly seven-week high of $3,451/ounce, as Israel and Iran launched a new round of attacks on each other on Sunday (June 15), exacerbating market concerns that escalating wars may trigger wider regional conflicts, and international gold continued to receive support from safe-haven buying.The continued rise of gold during the conflict depends on whether it is in a bull market and whether the conflict is likely to escalate. The inflow of funds into gold stock ETFs shows an increase in retail interest, especially silver outperforming spot gold, suggesting that market sentiment is turning. In addition to the geopolitical situation, this week will also usher in the test of the US retail sales monthly rate (commonly known as "terror data") and the Federal Reserve's interest rate decision.This trading day also needs to pay attention to the US New York Fed Manufacturing Index in June and the G7 Leaders' Summit, and pay attention to China's May total retail sales of consumer goods and China's May industrial added value annual rate.
Technical Review:
The technical price of gold is in good condition with the buying structure of the trend. The MA10/7/5-day moving averages on the daily chart remain open upward, the RSI indicator is hooked upward, and the price is running in the upper and middle track of the Bollinger Bands. The moving average system of the short-term four-hour chart maintains a golden cross opening upward, the price gradually moves up from the high point of the MA10-day moving average, and the Bollinger Bands remain open upward in the same hourly chart. Affected by the market fundamentals, gold has triggered risk aversion.The price of gold continues to rise, and the graphics of various time periods have formed obvious and strong support. In the daily chart, gold fell back to the trend line support after the triangle convergence breakthrough, and ushered in a rising trend again. In the short term, the upward momentum of gold is still strong. Based on the last round of retracement low of $3120 as the starting point of the wave structure, the push of the third wave may cause the price of gold to rise to $3600-3640. Combined with the current fundamentals, news and geopolitical situation, the medium- and long-term upward trend of gold is far from over.
Today’s analysis:
At present, the entire market is still affected by the geopolitical risks in the Middle East. Gold has been at a high level for a long time. If there is no turning point, the gold price will continue to remain above 3400 today. We will have the opportunity to see the gold price refresh the historical high of 3500 again today or tomorrow, and the probability is also very high. Then our operation idea is to buy to the end before the trend changes!
The trend of the gold one-hour market is still strong. From the short-term trend, it continues to maintain a high-level shock pattern, and the low point continues to rise. The high point has been continuously broken. Although the high opening and high movement of the Asian market failed to be directly continued, the high and fall back just gave us the opportunity to buy in!
Operation ideas:
Buy short-term gold at 3420-3423, stop loss at 3411, target at 3450-3470;
Sell short-term gold at 3468-3471, stop loss at 3480, target at 3420-3400;
Key points:
First support level: 3423, second support level: 3410, third support level: 3392
First resistance level: 3458, second resistance level: 3467, third resistance level: 3483

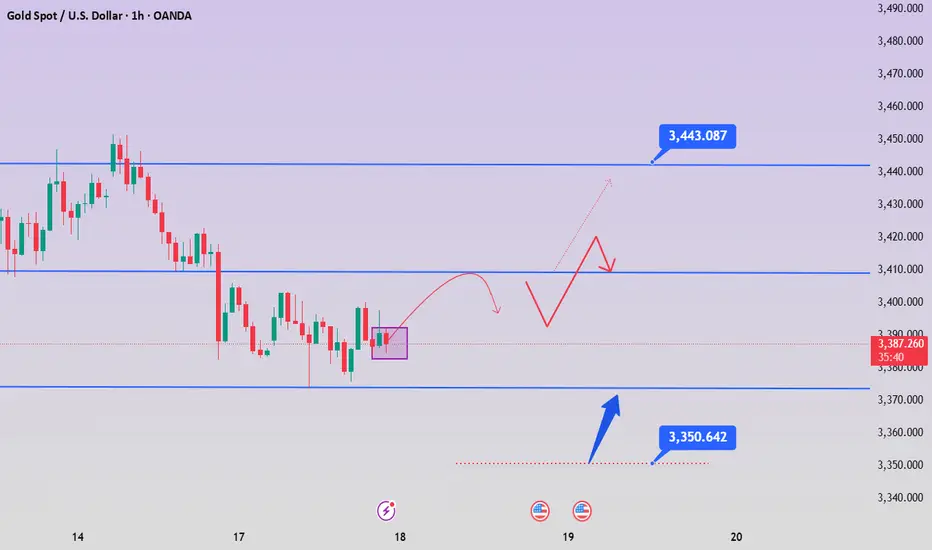
Gold May Pull Back Short-Term📊 Market Overview:
After several strong bullish sessions, gold prices are under short-term pressure as geopolitical tensions in the Middle East temporarily ease and the US Dollar shows slight recovery.
While expectations for a steady Fed policy remain, traders are locking in profits after gold tested the $3,445 resistance zone.
📉 Technical Analysis:
Key Resistance: $3,445 – $3,460
Nearest Support: $3,394 – $3,380
EMA 09: Price has dropped below the 09 EMA, signaling a potential short-term bearish shift.
RSI/Candles/Momentum: RSI is pulling back from overbought levels. A red candlestick pattern has emerged after a strong rally, suggesting a technical pullback may be forming. Trading volume is starting to decrease.
📌 Outlook:
Gold may correct lower in the short term toward the $3,390–$3,380 support zone if it fails to reclaim the 09 EMA. However, the medium-to-long-term trend remains supported by safe-haven demand and dovish Fed expectations.
💡 Suggested Trading Strategy:
SELL XAU/USD at: $3,440 – $3,445
🎯 TP: $3,420
❌ SL: $3,455
BUY XAU/USD at: $3,390 – $3,395
🎯 TP: $3,410
❌ SL: $3,380

Gold, continued to rise after a pullback
📌 Driving events
Israel and Iran launched a new round of attacks on each other on Sunday (June 15), exacerbating market concerns that the escalation of the war could trigger a wider regional conflict, and gold continued to receive support from safe-haven buying. (The author believes that according to media reports, Iranian leaders have shown a tougher attitude, and Iran cannot be ruled out to give Israel a strong counterattack, so the geopolitical situation in the Middle East may escalate in the next few days, and gold as a safe-haven asset will shine even brighter.
Kremlin: (On Putin's possible mediation of the Israeli-Iranian conflict) Russia is ready to intervene at any time if necessary. (The author hopes that the two countries will be reconciled as soon as possible)
📊Comment Analysis
1-hour chart: The rising channel breaks down, and short-term shorting is at 3442.
💰Strategy Package
Today's US market plans to sell high and buy low in the 3408-3452 range. If the range breaks, follow the trend, strictly lighten the position and set a good stop loss.
⭐️ Note: I hope traders can properly manage their funds
- Choose the number of lots that matches your funds
I hope everyone will set rules, control emotions, and take a long-term view, and slowly get rid of the control of desire, be at ease in the trading market, find their own way to make money, and truly enjoy the fun and rewards brought by trading.

The international situation is bad. Gold fell back.Information summary:
Latest news: Israeli fighter jets "flew freely" over Tehran, and Iran lost air supremacy over the entire west. Israel's goal turned to a wider range of Iranian military and infrastructure.
Iran's counterattack, Tel Aviv, Haifa and other Israeli cities are being attacked by Iranian missiles. Both sides are currently suffering heavy losses.
But the price of gold fell back at this time; I think the biggest reason is that this week, the global "super central bank week" is about to hit, the market will usher in a very critical Federal Reserve interest rate decision, and central banks such as Japan, Switzerland and the United Kingdom will also hold monetary policy meetings one after another, and investors are on high alert. Under the influence of multiple conditions, the price of gold has a technical correction.
Technical analysis:
From a technical point of view, the impact of the conflict in the Middle East did not directly push up prices, but instead rushed up and fell back, which shows that the market has great pressure on the upward trend. Therefore, for the upward trend, it is necessary to be relatively conservative.
From the position point of view, the support below is around 3410.
From a trading perspective, most traders are waiting for the release of some data, which will change the overall trend of gold. However, according to the latest analysis of 14 Wall Street analysts, 10 analysts expect prices to continue to rise.
So I guess that this time the gold price pullback is accumulating energy for upward movement. At present, the price has started to rise after falling back to around 3410. The point of this pullback rebound is expected to stop around 3440, and then start to fluctuate at a high level.
If the price breaks through 3440 strongly and stabilizes above this position, the price may hit the upward pressure level of 3455 again.
