Gold fluctuates widely, strategy remains unchanged
📌Gold news
The US and Chinese delegations will continue talks in London for the second consecutive day. President Trump expressed optimism, saying the talks "should go well". US officials said the talks could lead to Washington lifting certain technology export restrictions in exchange for Beijing relaxing controls on rare earth exports - a material that is critical to industries such as energy, defense and advanced technology. The results of these negotiations may provide a new direction for precious metals
📊Comment analysis
The European session continued to retrace and gave a low of 3293, then slowly strengthened. The current high reached 3349, so today's strategy does not need to be changed for the time being. If the current market is given to 3335-3345 again, short orders can still be entered. The current trend is still weak, and the US market is likely to follow the old path of a second decline, so the current idea of shorting on the pullback remains unchanged for the time being!
💰Strategy package
Gold: Short on rebound 3335-3345, stop loss 3350, target 3300-3280!
⭐️ Note: Labaron hopes that traders can properly manage their funds
- Choose the lot size that matches your funds
-
Goldinvesting

Is there more than $100 room for gold to fall?
💡Message Strategy
Gold is under the dual pressure of risk aversion cooling and dollar strengthening in the short term. As the high-level negotiations between Asian powers and the United States entered the second day in London, the market was optimistic about reaching an agreement in the field of export controls, which improved the overall risk sentiment and safe-haven assets such as gold were under obvious selling pressure.
At the same time, the US non-farm payrolls report last week far exceeded expectations, further suppressing expectations of a rapid rate cut this year, pushing up the US dollar index, and putting pressure on gold at the $3,340 mark.
Recently, the gold price has failed to effectively break through the 200-hour moving average, reflecting the lack of bullish momentum, and the short-term trend is likely to be consolidated or further adjusted.
📊Technical aspects
From a technical perspective, gold prices fell again after failing to test the 200-hour moving average and are currently fluctuating below $3,340. Hourly chart indicators (MACD, RSI) show that bearish momentum continues to increase. If the price falls below the previous trading day's low of $3,290, it will further open up space to fall back to the May 29 low of $3,245 or even $3,200.
The first support is in the 3340 area. After breaking through, it may accelerate the decline to test 3290; if this position is lost, it may re-test the 3200 integer mark.
💰 Strategy Package
Short Position:3340-3355,3355-3365

Gold at risk if US–China talks fail📊 Market Overview:
• Spot gold is trading around $3,309–$3,311/oz (according to TradingEconomics, Kitco…), slightly down by 0.5% as markets await the outcome of US–China trade talks in London.
• The US dollar has eased following some positive signals from the talks, but overall market caution remains high ahead of the June 11 CPI release and the upcoming Federal Reserve decision.
📉 Technical Analysis:
• Key resistance: $3,340 (June consolidation ceiling); further upside at $3,353–$3,370 if a breakout occurs.
• Nearest support: $3,298 (monthly pivot); if breached, price may move toward $3,270 → $3,243.
• EMA09/EMA20/EMA50: Price is trading below the short- to mid-term EMAs, indicating a consolidating or slightly bearish trend.
• Candlestick/momentum: Sideways structure within $3,298–$3,332; weak momentum. RSI and Stochastic are below mid-levels, signaling market caution.
📌 Outlook:
• Gold may continue to consolidate or edge lower in the short term if the US–China negotiations fail to deliver a significant breakthrough and no strong bullish data emerges.
• Conversely, any signs of renewed tension, failed trade talks, or unexpectedly high inflation figures could reignite bullish momentum and push prices back toward the $3,332–$3,370 range.
________________________________________
💡 Trade Strategy Suggestion:
➡️ SELL XAU/USD
Entry: $3,330–$3,335
• 🎯 TP: ~$3,310
• ❌ SL: $3,345
➡️ BUY XAU/USD
Entry: $3,298–$3,305
• 🎯 TP: ~$3,320
• ❌ SL: $3,288
The short-term tug-of-war for gold is starting
Gold prices continued their decline last Friday and stabilized and rebounded. Yesterday, gold prices fell back to the 3,300 mark, then slowly rose to the 3,338 mark, and fell back after encountering resistance, which is in line with the technical consolidation rhythm.
- China-US trade negotiations: The US has released signals that it is willing to relax export restrictions, and the market is waiting for the results of the negotiations, which may affect risk sentiment.
- US May CPI data: Inflation changes will provide key guidance for the Fed's policies.
- The current trend is weak, but the downside is limited. Buy on dips and avoid large-scale shorting.
- Today, it is recommended to wait and see, and wait for the negotiation results to become clear before entering the market to reduce volatility risks.
🔥Sell gold area: 3330-3348 SL 3352
TP1: $3320
TP2: $3310
🔥Buy gold area: $3295-$3305 SL $3290
TP1: $3320
TP2: $3330

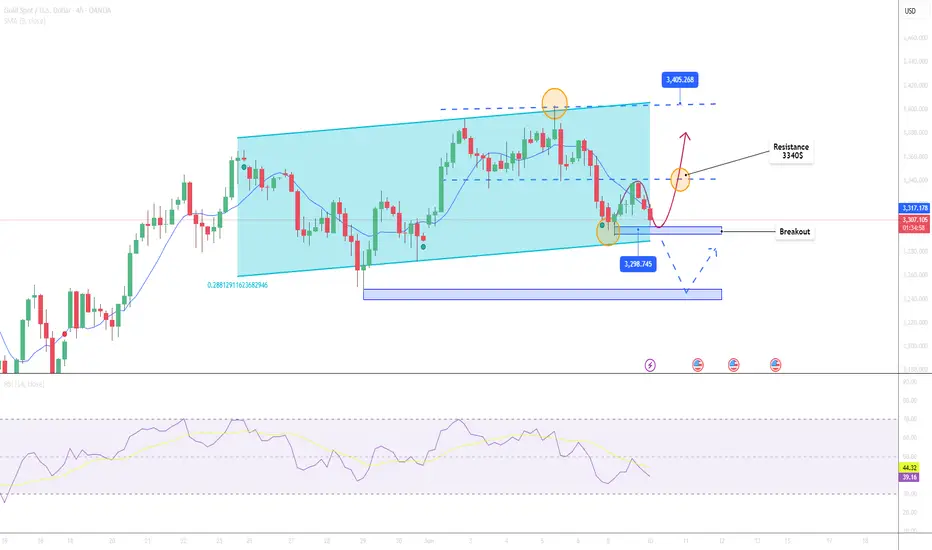
Gold is expected to continue to fall to 3280 or even 3250In the short term, the operation of gold is completely in line with my expectations. I clearly pointed out yesterday that gold will encounter resistance in the 3330-3340 area and will at least retest the area around 3315-3305 again. At present, gold has rebounded slightly after retesting the area around 3302 and is trading around 3309.
According to the strength of yesterday's rebound, gold did not effectively break through the 3300-3340 area. Gold is still weak in the short term, and the head and shoulders top structure is constructed in the 3328-3338-3328 position area in the short term, which suppresses gold to a certain extent and limits the rebound space of gold. After multiple tests, the area around 3300 may be more conducive to being broken. After gold has been under pressure and fallen many times, the current short-term resistance area has been reduced to the 3310-3320 area; so I think gold still has a good downward space in the short term, which may continue to 3280, or even around 3250.
So for short-term trading, I think it is possible to consider continuing to short gold.

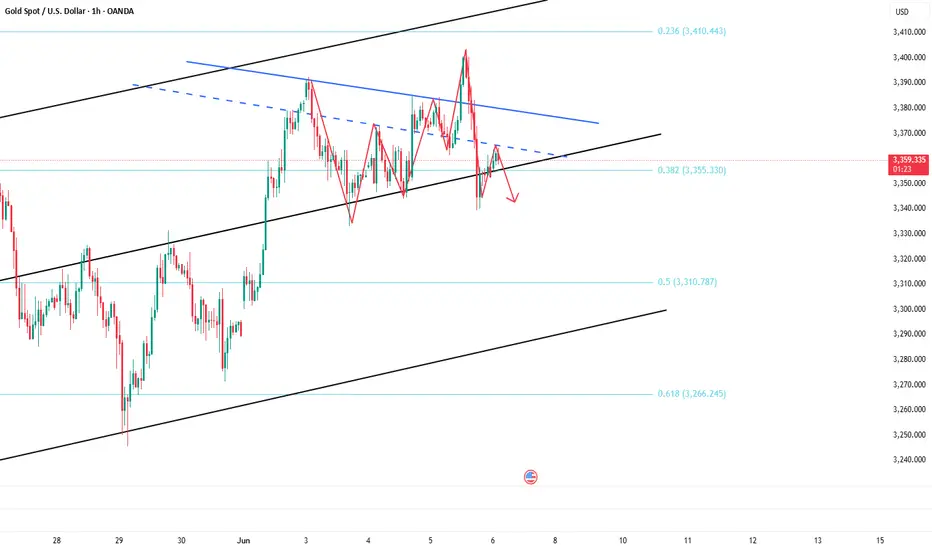
Gold is falling. Where is the low point?Market summary:
Yesterday, thanks to the weakness of the US dollar, the US dollar once fell below the 99.0 mark. Spot gold rebounded from the low of 3293 hit earlier in the session, recovering all the losses during the day, and the highest point was near 3338.
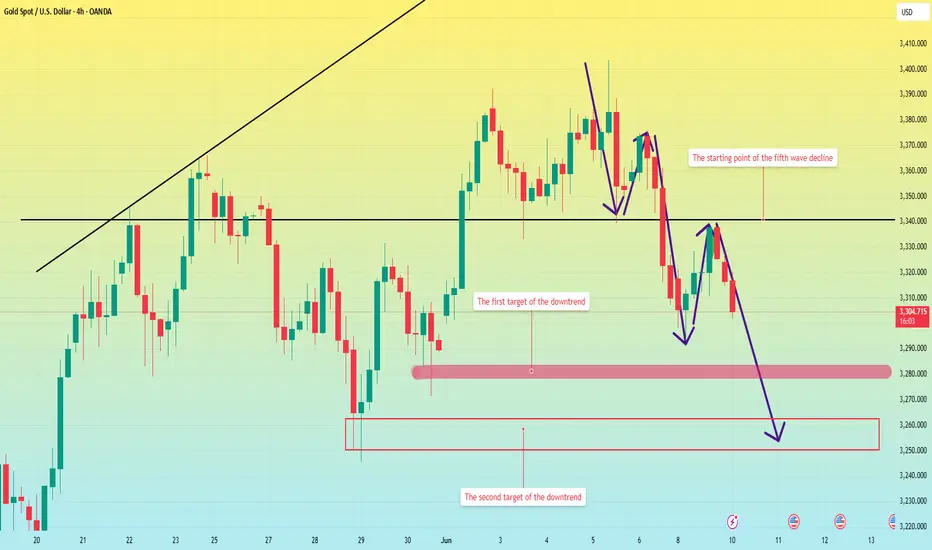
It fell from the high point in the early Asian session on Tuesday, and has been consolidating in the 3300-3310 range so far. In my early analysis, I pointed out that there is a high probability that the fifth wave of the wave trend will fall at the beginning of this week, and as I predicted, it is completing the fifth wave of the downward trend.
Trend analysis:
From the four-hour chart, the fourth wave of rebound has been completed, so today is the fifth wave of the downward trend. Next, we look at the two target ranges.
The first target is around 3280, and the second is 3260-3350. And today, it is highly unlikely to stabilize above 3310, so don't choose to short at the rebound high point, the chance is very slim.
Operation strategy:
Short around 3310, stop loss at 3320, profit range 3380-3350.
Short Gold,gold is expected to test 3300 or even 3280 againAlthough gold is currently above 3310, it does not mean that gold has stopped falling and stabilized. As long as gold remains below 3330-3340, gold is still in a weak state, so I think the decline of gold may not be over yet. Judging from the current trend, I think gold will have to retest 3300 at least again, or even around 3280 before it will have a chance to stop falling and rebound.
So for the grasp of short-term trading opportunities, I think you can consider shorting gold with 3330-3340 as resistance.

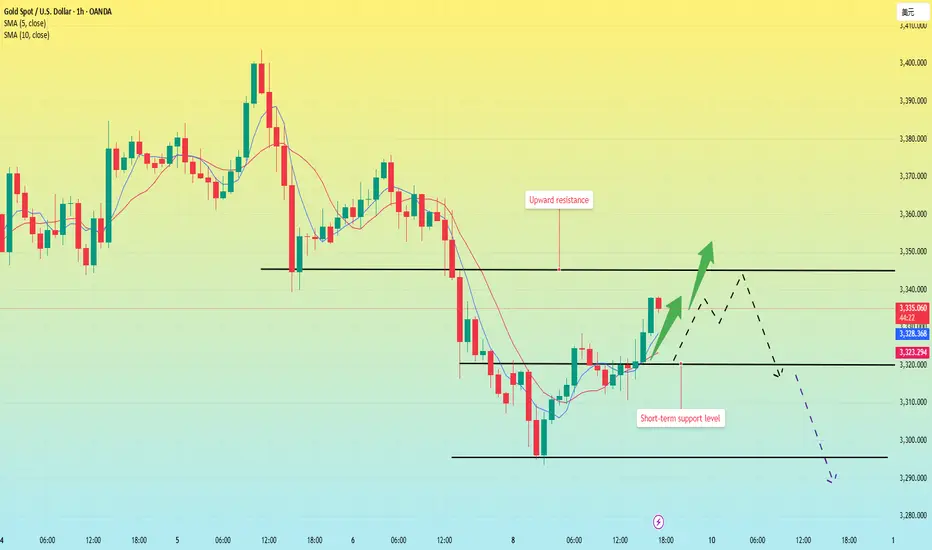
Gold price rebounds, short-term strength?After the opening of the U.S. stock market today, the price of gold rose rapidly, breaking through the first resistance level of 3325, and currently reaching the intraday high of 3337.
However, from the hourly chart, the current price has not reached the upward trend point I predicted, so the price is likely to rise slightly again in the future.
From the 4-hour chart, gold rose again after falling back in the U.S. market, and the price broke through the 3325 position upward, which means that the short-term is strong; in the morning analysis, I predicted that gold would fall back and rush high, and the fall back can be short-term long, and the volatile market can be operated in the short term according to this strategy.
At present, the 4-hour MA5-day and 10-day moving averages have a trend of forming a golden cross upward, and after the fall in the morning, the moving averages are currently showing an upward turning trend.
Therefore, after the price breaks through 3325, the probability of continuing upward is still relatively large, and the pressure position is 3345; this position is the point after the fall back from the high point in May, and it is also an important pressure position after the current price falls back and rebounds.
The price is currently heading towards a retest of 3340-3345 levels. If the dollar continues to fall and gold manages to consolidate above 3345, the bullish trend is likely to continue. However, a false breakout of 3340-3345 area could trigger a further decline following the breakdown of the bullish structure.
Gold May See Short-Term Correction As US-China Talks Loom💡 Suggested Trading Strategies
SELL XAU/USD at: $3,320 – $3,326
🎯 TP: $3,300
❌ SL: $3,330
BUY XAU/USD at: $3,296 – $3,300
🎯 TP: $3,320
❌ SL: $3,290
📊 Market Summary
Gold prices have been volatile recently due to high-level trade negotiations between the US and China. Investors are cautious as a potential breakthrough could ease tensions and reduce safe-haven demand for gold.
📌 Outlook
Gold may decline slightly toward the $3,296–$3,300 range if no breakthrough is achieved in US-China talks. However, a positive outcome could trigger a rebound toward the $3,326–$3,340 zone.

Gold hits 3335 in the US market and shorts
⭐️Gold information:
Looking back at last week's trend, after hitting a high on Monday, gold prices fluctuated in a range from Tuesday to Thursday, and closed with a sharp drop on Friday, forming an M-top pattern from a technical perspective.
This week, the market focus is on the high-level trade negotiations between China and the United States held in London. The market expects that the negotiations will proceed smoothly, and this optimism is bearish for gold. Based on the comprehensive technical and fundamental analysis, the gold price is still bearish today. It is recommended to pay attention to the short-selling opportunities in the rebound range of 3330-3340 US dollars.
⭐️Set gold price:
🔥Sell gold area: 3330-3340 SL 3345
TP1: $3320
TP2: $3310
TP3: $3295

Gold is falling, waiting for the trend to be completed?The Asian market continued to fall on Friday in the early trading on Monday, reaching a low of around 3293. It then bottomed out and rebounded, reaching a high of around 3325, and is currently maintaining a consolidation around 3320.
From the hourly chart, gold is completing the fifth wave in the wave trend; in the short term, gold is in a rebound trend, and has been maintaining this upward trend channel.
As long as it cannot fall below 3310 next, the gold rebound has not ended, and it may directly test the top around 3345. Because 3345 is exactly the bottom of the first wave, the rebound trend from 3293 is likely to be the fourth wave.
As long as the fourth wave rebound cannot strongly break through the bottom of the first wave at 3345, then the fifth wave will most likely show a downward trend.
Therefore, the current trading operation is basically simple;
Long strategy: long at 3315-3320, stop loss at 3305, and profit range at 3340-3350.
Short selling strategy: wait for the price to stabilize near 3345 and then enter the market to short sell.
Important tip: If the price falls from 3345, it is highly likely to go down directly to the low point of 3280-3250.

The decline is not complete, beware of the low point.Last Friday, the US dollar index rose and recovered the 99 mark as the non-farm data exceeded expectations and weakened the Fed's hope of cutting interest rates this year. Spot gold continued to fall after the release of non-farm data, breaking through the 3345 and 3330 levels.
Market analysis:
First look at the 4-hour chart of gold:
It broke through the 3300 mark in the early Asian session on Monday and is currently maintained near 3310. However, from the current point of view, the decline of gold has not been completed. From the trend point of view, gold must at least test the position near 3280 and 3250 before there will be a relative chance of rebound. Once it falls below 3250, gold may not have a chance to rebound, and it will officially enter a bearish trend, and it will be greeted by a bearish trend at the daily level.
From the hourly chart, if it cannot stabilize above 3310, then gold is likely to fall, and see whether it will break through 3280 or 3250. On the contrary, if it stabilizes above 3310, it may hit the early high near 3320 again. However, as long as it cannot stabilize above 3325, gold will still fall. Now you should pay attention to where to short gold.
Operation strategy:
If the price cannot stabilize above 3310, you can short near 3310.
If it stabilizes above 3310, you can wait for short near 3320.
XAU/USD(20250609) Today's AnalysisMarket news:
Fed Harker: Amid uncertainty, the Fed may still cut interest rates later this year. Musallem: There is a 50% chance that the trade war will lead to a sustained inflation outbreak. Tariffs may push up inflation within one or two quarters. The ECB cut three key interest rates by 25 basis points. Lagarde hinted that the rate cut cycle will end, and the market is no longer fully pricing in another 25 basis point rate cut this year.
Technical analysis:
Today's buying and selling boundaries:
3330
Support and resistance levels:
3398
3373
3356
3304
3288
3262
Trading strategy:
If the price breaks through 3330, consider buying in, with the first target price of 3356
If the price breaks through 3304, consider selling in, with the first target price of 3288

In the new week, is gold brewing a new market?Information summary:
This week, the market continued to be affected by Trump's tariff policy and the progress of negotiations. On Thursday, the phone call between the Chinese and US heads of state boosted market sentiment. In the early stage, the precious metals market ushered in a collective rise, and the prices of silver and gold performed strongly. Silver rose to a 13-year high on Thursday, breaking through $36 for the first time since February 2012.
After gold hit the $3,400 mark during trading on Thursday, the US dollar rose as friendly talks between China and the United States stimulated the rise of the US dollar; gold fell rapidly and gave up all the gains during the day. On Friday, the US stock market closed at its highest level since February due to the boost of non-agricultural data.
Gold continued its retreat trend again, closing at around 3,310 as of Friday.
Market analysis:
From the trend of the US dollar, there is already an opportunity to bottom out, and the trend at the beginning of the week is critical.
Once the US dollar stands above 99.5 at the beginning of the week, it will continue to touch the 100.0--100.2 mark.
If it stabilizes above this position, gold will most likely fall below 3300 next week.
First, from the weekly chart:
The current moving average support below the weekly line is almost at 3250-3260. If it can hold here, gold may continue to maintain consolidation and wait for an opportunity to choose a new trend. However, if it falls below 3250, it can fall to the 3200 mark. If 3200 falls below again, it will be the low point of 3100.
It can also be seen from the daily chart that the important position of gold is at 3318-3280. If it stands above 3318, gold is in a bullish upward trend. If it falls below 3280, gold will enter a bearish trend. At present, gold has closed below 3318, so from the daily line, the next target is around 3280. If 3280 falls below again, then as the weekly analysis shows, it will test 3250-3260. However, judging from the daily chart, I think the market will not go down too easily.
Therefore, I guess that gold may follow the head and shoulders top structure of the daily chart next week. It may fall to 3250-3260 at the beginning of the week to lure short sellers into the market, and then stretch and rebound to around 3350 to form a shoulder position. Finally, it will directly dive down to around 3150.
The Asian market is about to open, and I hope my analysis can help everyone make some profits in the market. A new week is about to begin, and I wish you all good luck.
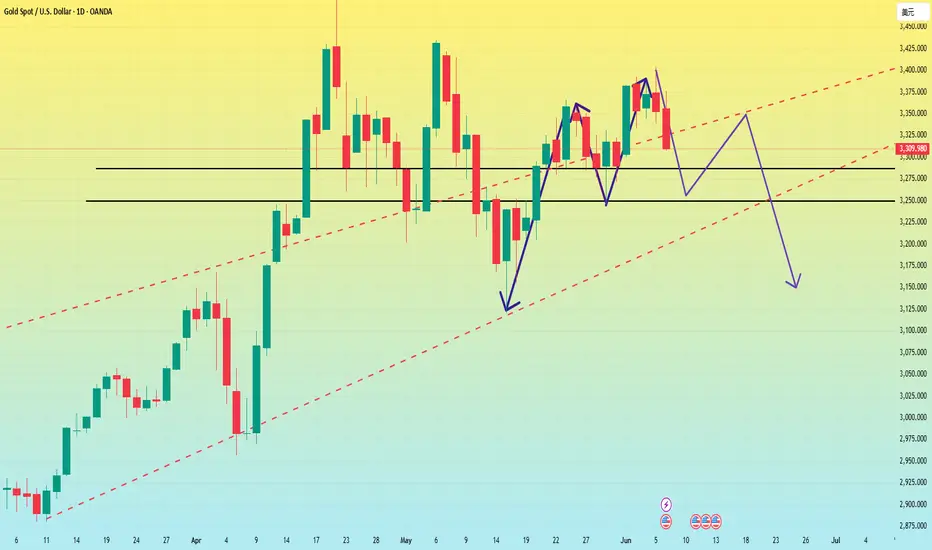
Gold plunges, what will be the trend next week?From the daily chart:
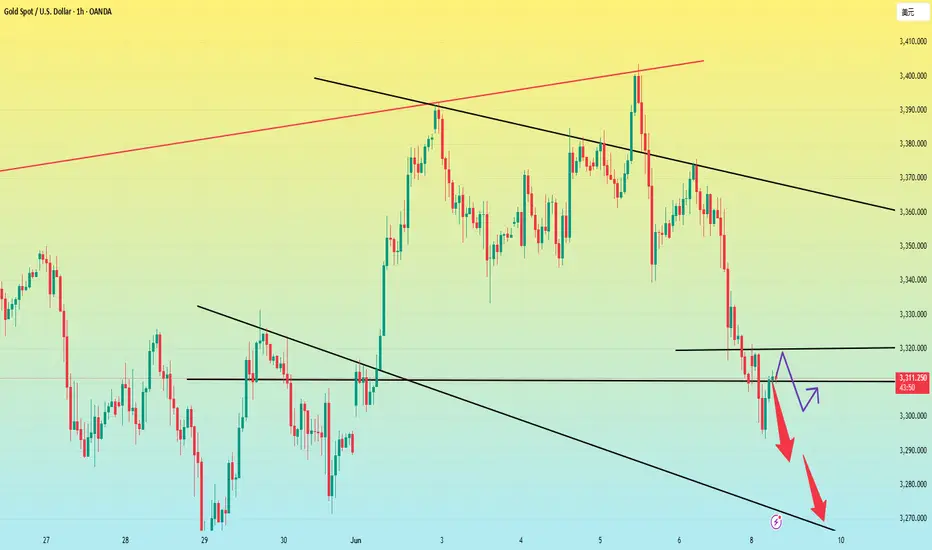
Since the last round of breaking the triangle convergence oscillation and breaking the trend line, gold has surged to 3400, but the upward momentum is insufficient and it has retreated. The low point of the retreat on Friday happened to be the support level of the previous triangle convergence trend line near 3300. If it falls below, the price will return to the triangle convergence oscillation range, and the gold price may fall further;
From the perspective of gold 1 hour, the MA5-day and 10-day moving averages have formed a dead cross downward, so gold still has downward momentum. After the gold 1-hour high box oscillation, gold finally broke through the box downward, indicating that the gold shorts are better, so the bottom of the gold box has now formed resistance, and the gold short-term resistance to gold has been formed near 3335. If gold is 3335 at the beginning of next week, then gold can continue to be short.
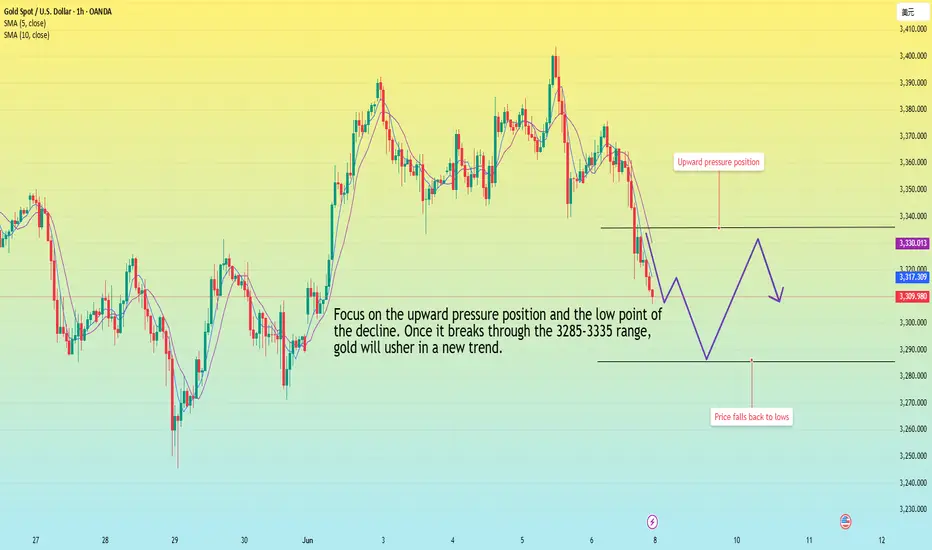
Next week's operation strategy is still around the 3285-3335 range.
The rebound is not strong, and gold still has room to fallThere is no good entry point to participate in the transaction at present, but the highlight of today is the NFP market, so there is no need to rush to enter the market when there is no trading opportunity.
Although gold rebounded slightly after touching 3340 overnight, to be honest, the rebound strength is far less than expected, and as long as gold remains below 3365-3375, gold will remain weak in the short term, so I think gold still has room to fall. First, pay attention to the support near 3330, followed by the support near 3310. However, in trading, we must pay attention to guard against the trend of falling after rising in the NFP market.
Trading strategy:
1. Consider continuing to short gold in the 3375-3385 area, TP: 3360-3350;
2. Consider trying to go long gold in small batches in the 3325-3315 area, TP: 3340-3350

Short gold after reboundOvernight, gold broke through the 3400 mark due to the intensification of geopolitical risks, but plunged sharply due to the reduction of the risk of Sino-US trade decoupling. Because the news swept up and down, it brought certain difficulties to the transaction. Today, we will focus on the NFP market!
After overnight gold plunged to around 3340, it is currently maintaining a small rebound state. Relatively speaking, the rebound potential is weak, and with the sharp plunge of gold in the short term, the market bulls' confidence has been hit. At present, without major good news, it is difficult to make breakthrough progress based on technical support alone. The upper side faces short-term resistance of 3365-3375 area resistance. If gold cannot break through this area in the short term, gold will be weak!
Trading strategy:
Consider shorting gold in the 3370-3380 area, TP: 3355-3345
Gold----Sell near 3384, target 3362-3339Gold market analysis:
Yesterday's gold surged and then fell. The daily line finally closed negative, but it did not close before the previous low point, nor did it break the key support. The daily line formed a combination of one negative and one positive. The recent market is like this, ever-changing, without a fixed trend. A rebound can easily rise by 30 points. The Asian session rebounded from 3339 to 3372, easily breaking the 3363 pattern of great pressure. The daily line pattern looks like a shock and breaks 3339, which is bearish. Today's short-term thinking is to rebound first and then bearish. Yesterday's decline was too much, and a technical rebound is needed. The rebound is our opportunity to sell. In addition, the big drama is the NFP data in the evening. Before this data, the gold market will not have too much unilateral action, and the possibility of repair is greater. In addition, today is the time to close the weekly line. If nothing unexpected happens, this week will still close with a positive line, so gold will continue to be bought for a long time next week, and it will continue to rise.
The first suppression position we focus on in the Asian session is 3372, and the stronger one is around 3388-3384. These two positions are important positions in the Asian session. Gains and losses are critical. In addition, the daily line has not turned short. There is still a possibility of buying and rising again. If the buy stands above 3384, it may stabilize and rise again. If it stands above, we must adjust our thinking and buy to see new highs.
Support 3339, 3352, suppression 3372, 3388, and the strength and weakness line of the market is 3352.
Fundamental analysis:
The terrible ADP data made the market not optimistic about non-agricultural data. We estimate that today's non-agricultural data will still be relatively miserable. The market's expectations support gold and suppress the US dollar.
Operation suggestions:
Gold----Sell near 3384, target 3362-3339

Gold is long near 3350 in the US market
It was at 3361 the previous second, and it reached 3348 the next second. The market was directly washing up and down. You said it would fall. It broke through 3400 directly when it rose, but then fell again. It fell directly below the 3350 bullish dividing point when it fell. The current point is around 3353.
Friday is the big non-agricultural data, and we are waiting for the non-agricultural data to be laid out again tomorrow!
Gold: BUY GOLD zone: light position operation (can add positions in batches)
$3344- $3354 SL $3339
TP around3400- 3410

Gold May Undergo a Short-Term Downward Correction
📊 Market Overview
Gold prices are hovering around $3,348/oz, with the day's low near $3,340. Weak U.S. economic data, including a decline in the services PMI to 49.9 and low job growth, have reinforced expectations of a Federal Reserve rate cut. However, gold prices have yet to break through strong resistance levels due to profit-taking and cautious sentiment ahead of the upcoming Non-Farm Payrolls report.
📉 Technical Analysis
• Key Resistance: $3,370 – $3,375
• Immediate Support: $3,335 – $3,340
• EMA 09: Price is above the EMA 09 line, indicating a short-term uptrend.
• Candlestick Patterns / Volume / Momentum:
o MACD on H4 chart shows a golden cross, supporting the uptrend.
📌 Outlook
Gold may undergo a short-term correction if U.S. employment data exceeds expectations or if there are positive developments in international trade negotiations.
💡 Suggested Trading Strategy
SELL XAU/USD at: $3,370 – $3,375
o 🎯 TP: $3,350
o ❌ SL: $3,385
BUY XAU/USD at: $3,335 – $3,340
o 🎯 TP: $3,360
o ❌ SL: $3,325

US market fluctuates around 3400-3370, short first
📌 Driving events
Heightened tensions between China and the United States have also fueled the bullish momentum of gold prices. As the upcoming trade negotiations between Washington and Beijing are full of uncertainty, investors have sought safe-haven assets such as gold.
Adding to the market's nervousness, President Donald Trump signed an executive order to double the import tariffs on steel and aluminum from 25% to 50%, effective June 4. The move came a few days before Trump's much-anticipated call with Chinese President Xi Jinping, further fueling concerns about escalating trade frictions.
📊Commentary and analysis
Gold failed to fall back to 3353 during the day, and the lowest point was 3360, and it ushered in an increase, and the highest point was 3403. In the short term, 3403 was suppressed, or it may fall back, and then it fell into volatility again. The idea is to suppress short positions around 3403, stop loss at 3413, and stop profit at 3380-3372. Short-term trading, pay attention to risks.
June 5th US gold short-term trading: short near 3400, stop loss 3413, light position, take profit 3375
Short near 3372, stop loss 3360, take profit 3400
⭐️ Note: Labaron hopes that traders can properly manage their funds
- Choose the number of lots that matches your funds

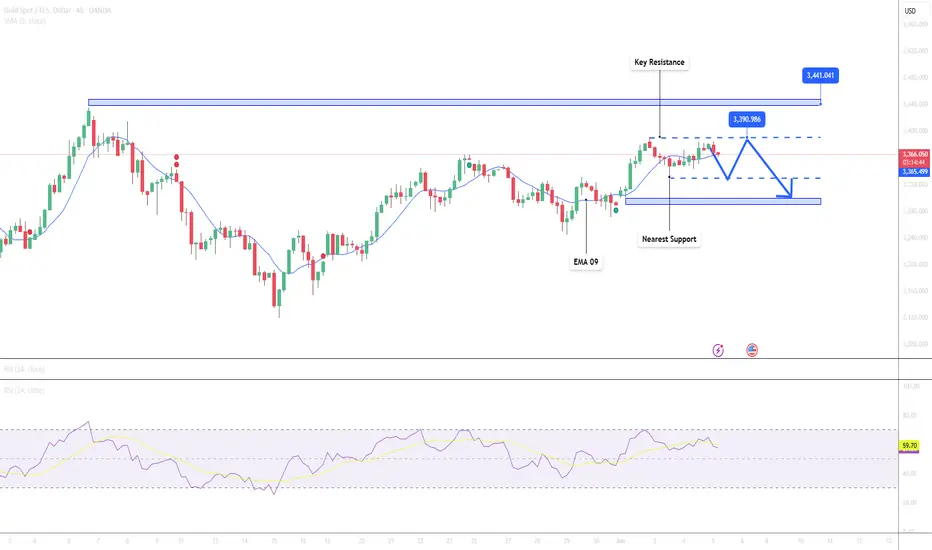
Gold Approaches Key Resistance – Minor Pullback Possible📊 Market Overview:
Gold prices continue their upward momentum and have now reached $3,367/oz, as markets await the upcoming U.S. Nonfarm Payrolls (NFP) report later this week. The U.S. dollar is slightly weaker and Treasury yields are stable, helping gold maintain its strength. However, mixed forecasts from major financial institutions are creating psychological pressure on investors.
📉 Technical Analysis:
• Key Resistance: $3,390 – $3,440
• Nearest Support: $3,330 – $3,300
• EMA: Price remains above both EMA 50 and EMA 9 → indicating a sustained uptrend.
• RSI (H4): Near 66 → not overbought yet, but limited room for further upside.
• Candle pattern: Recent H1 candles show long upper wicks → signaling profit-taking at higher levels.
📌 Outlook:
Gold may face a minor short-term correction if it fails to break above the $3,390 resistance area, especially as the upcoming U.S. jobs report could potentially strengthen the U.S. dollar.
💡 Suggested Trading Strategy:
SELL XAU/USD at: $3,375 – $3,390
🎯 TP: $3,355
❌ SL: $3,405
BUY XAU/USD at: $3,345 – $3,330
🎯 TP: $3,365
❌ SL: $3,315
Gold points to 3400, madness before data release.Market analysis:
Gold fell slightly to around 3361 in early trading on Wednesday. After falling to around 3346, it quickly rose to around 3372, then was blocked and fluctuated and fell. It fell to 3344 in the European session and then rebounded. It rose strongly to 3384 in the US session and fluctuated above 3370 in the late trading.
The daily line of gold showed a trend of alternating yin and yang. But the overall trend was upward. The 5-day moving average and the 10-day moving average formed a golden cross and extended upward, which provided moving average support for the gold price, allowing gold to maintain a strong and volatile trend. At present, the 5-day moving average is around 3352, and the 10-day moving average is around 3335. The first thing to pay attention to is the resistance of Tuesday's high of 3392. If the gold price can break through this resistance level, it is expected to continue the bullish trend.
In terms of points, first pay attention to the support near MA5/MAA10 below, and focus on the support of MA20 moving average. The downward exploration on Tuesday and Wednesday both defended the MA20 moving average position. Above this, it is treated as a strong shock. Secondly, pay attention to the support near 3335, which is the low point on Tuesday and the key to the short-term structure. Secondly, pay attention to the support near 3335, which is the low point on Tuesday and the key to the short-term structure. First pay attention to the resistance near 3395 above, and then pay attention to the resistance near 3415 and 3430, which are the previous high points.
Operation strategy:
Short near 3395, stop loss 3410, profit range 3380-3360
Long near 3360, stop loss 3350, profit range 3375-3380-3390-3400.
