Gold fluctuates during the day, short-term profits will be left
📌Main driving events of gold
The big non-agricultural data in the United States caused the gold price to fall by almost 40 US dollars in one breath, but after a short emotional storm, the market returned to calm. Today's market began to bottom out and rise. As of now, the non-agricultural market has been backed by 50%, and the energy of the shorts has been basically digested. Next, the bulls will start to exert their strength! Today's direction is still the same and continue to be bullish!
📊Comment analysis
In the US market, the gold price rebounded after the decline and the bottom of the second retracement appeared. The support level is 3322. After a night of fluctuations, gold has begun to rise, and the low point has begun to rise. The key point of the day is still 3323. In the morning, we wait for the gold price to fall back to around 3323 and we will buy the bottom and go long. We don’t expect to surpass yesterday’s high point during the day, but at least it will go to 3350!
💰Strategy Package
Long position:
Gold long at 3322-3327, stop loss 3315, target 3350-3360
⭐️ Note: Labaron hopes that traders can properly manage their funds
- Choose the number of lots that matches your funds
Goldinvesting

Gold Drops as NFP Beats, USD Gains📊 Market Overview:
• June’s Non-Farm Payrolls came in stronger than expected at +147K (vs 110K forecast), with unemployment ticking down to 4.1%.
• The US Dollar surged (DXY up ~0.5%) and Treasury yields rebounded following the release.
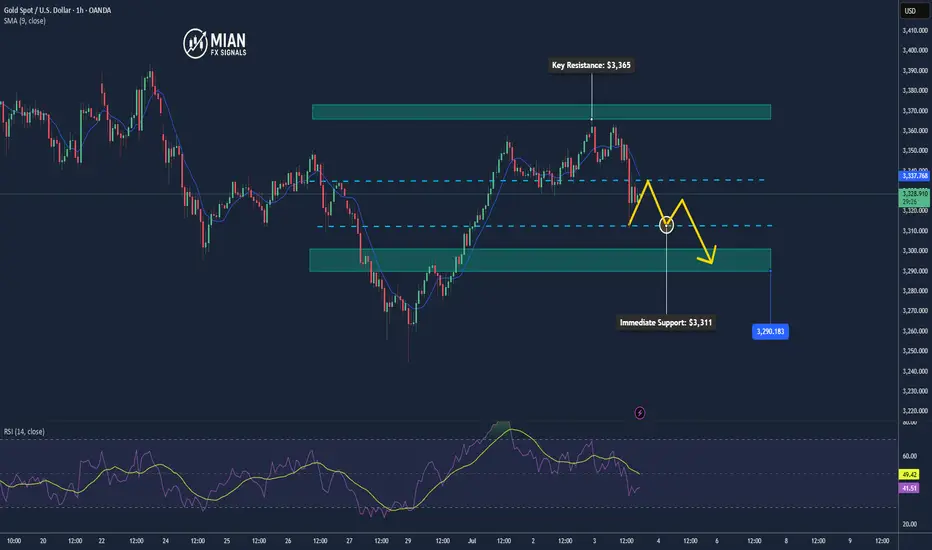
• Gold dropped sharply after the report, hitting a session low of $3,311 and is now trading around $3,328.
📉 Technical Analysis:
• Key Resistance: $3,364
• Immediate Support: $3,311
• EMA 09 (H1): Price is below the 09 EMA → confirms short-term bearish trend.
• Pattern / Momentum: A bearish engulfing candle near $3,364 signaled strong seller control. The failure to bounce afterward suggests persistent bearish pressure. RSI is tilting lower, confirming weakening momentum.
📌 Outlook:
Gold may continue to decline toward the $3,300–$3,290 area if USD and yields remain firm, especially if upcoming US data (such as ISM Services PMI) also supports the dollar strength.
💡 Suggested Trade Setup:
🔻 SELL XAU/USD at: $3,333 – $3,335
🎯 TP: $3,300
❌ SL: $3,339
🔺 BUY XAU/USD at: $3,293 – $3,290
🎯 TP: $3,330
❌ SL: $3,287
Gold grows, recovers near 3390
📣Gold News
Gold prices edged higher during the North American trading session as investors turned their attention to the upcoming U.S. non-farm payrolls report (NFP), which could influence the Fed's next policy move.
The latest labor data showed that companies are pausing hiring rather than laying off employees, reflecting caution in an uncertain economic environment. Meanwhile, Microsoft's decision to lay off 9,000 employees has heightened concerns about a weak labor market.
Traders are currently awaiting the official employment report from the U.S. Bureau of Labor Statistics on Thursday, which is expected to show 110,000 new jobs in June, down from 139,000 in May. The unemployment rate is expected to rise slightly to 4.3%, still within the 4.4% range of its forecast according to the Fed's latest summary of economic projections.
📣 Technical Analysis
NF is worth buying before the news release, holding. The dollar continues to be under selling pressure from investors worried about the Trump administration's erratic tariff policy.
💰Set Gold Price:
💰Sell Gold Zone: 3390-3398 SL 3405
TP1: 3380 USD
TP2: 3363 USD
TP3: 3350 USD
💰Buy Gold Zone: 3296-3294 USD SL 3289 USD
TP1: 3308 USD
TP2: 3318 USD
TP3: 3330 USD
⭐️Technical Analysis:
Set reasonable buy orders based on technical indicators EMA 34, EMA89 and support and resistance areas.
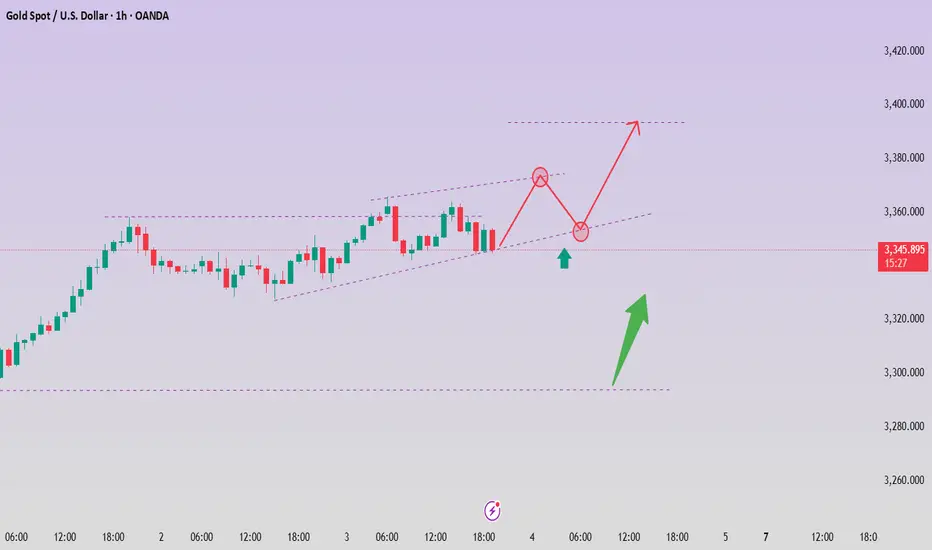
Data is about to be released. Trend change?Affected by the ADP employment data, gold prices broke through 3345 and continued to fluctuate upward to 3365 US dollars. This trend fully shows that the position of 3345 US dollars is the watershed between long and short.
From the 1-hour chart, the overall market is still fluctuating upward. Although it has fallen slightly, I think it is accumulating momentum for a second rise. ADP employment data is negative for the first time. Non-agricultural employment data will be released in 3 hours. The market expects 110,000 jobs. I think the data that may be released will be worse. The number of jobs will decrease and the unemployment rate will also increase, which will drive gold prices to continue to rise.
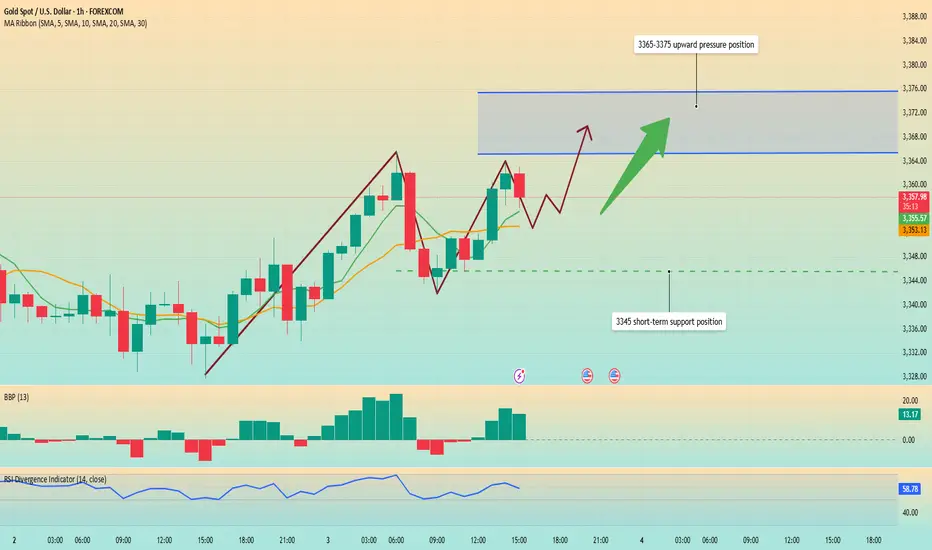
From a technical perspective, the RSI indicator is currently hovering around 58.7, showing strong upward momentum. MA5-day and 10-day moving averages form a golden cross and continue to rise. The current upward high has not appeared. The gold price may refresh the intraday high of 3365 again.
At present, the upward pressure focuses on 3365-3375 US dollars. The support level is around 3345, which is also the turning point for the upward movement of the MA5 daily moving average.
Operation strategy:
Buy near 3350, stop loss at 3340, and profit range 3370-3375.
Gold May Pull Back After Day’s High📊 Market Overview:
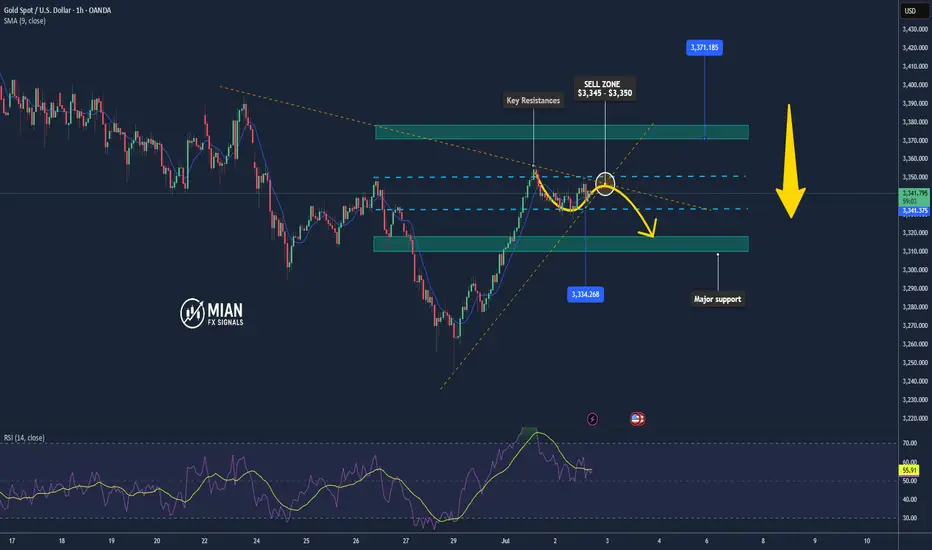
• Gold is currently trading around $3,350/oz, with the daily high at $3,366/oz.
• The rally stalled as traders took profits near the session high, while a slight rebound in the USD and rising U.S. Treasury yields weighed on gold’s momentum.
📉 Technical Analysis:
• Key Resistance: ~$3,366 (today’s high), with next level at ~$3,375–3,380 if breached.
• Nearest Support: ~$3,342 (intra-day low), stronger support seen at $3,329–3,330.
• EMA 9/21: Price is hovering near the EMA21 (~$3,350); this area is crucial to determine the short-term trend.
• Candle/Momentum Indicators:
o RSI is around 53-55, signaling a neutral stance;
o MACD shows weakening bullish momentum after hitting resistance.
📌 Viewpoint:
Gold may see a minor pullback in the short term, possibly testing the $3,342–3,329 zone after reacting to the daily high. However, if it holds above EMA21 and EMA50, the medium-term bullish trend remains intact.
💡 Suggested Trading Strategy
SELL XAU/USD at: $3,363–3,366
🎯 TP: 40/80/200 pips
❌ SL: $3,370
BUY XAU/USD at: $3,329–3,332
🎯 TP: 40/80/200 pips
❌ SL: $3,325

Non-farm data is coming. Upward breakthrough?Information summary:
ADP data supports the rise of gold. Secondly, the weaker-than-expected non-farm data has triggered people's hope that the Federal Reserve will cut interest rates earlier. The gold price hit the 3360 mark, then fell back slightly, and is currently fluctuating around 3350.
This Friday is the Independence Day holiday in the United States. The non-farm data will be released on Thursday. Today, we will focus on this data, which will trigger a new trend.
Market analysis:
From the 4-hour chart, gold is currently in a suppressed state. However, it is not ruled out that it will be supported at the bottom as before, and then break through the upper suppression position again with the help of non-farm data.
Therefore, the most critical position today is not above, but near the support of 3325 below. On Wednesday, the support near 3325 was tested many times but did not break down. If the price remains above this position today, the probability of an upward breakthrough is very high.
Based on the current market conditions and the data to be released soon, Quaid recommends that everyone wait and see for a while and wait for the new trend to come. Of course, according to the current forecast data, this will support the rise of gold. A radical approach can also try a long strategy around 3345.

Gold Sees Volatile Swings – Pullback Risk Remains📊 Market Highlights:
Gold surged to $3,351 earlier today after weaker-than-expected US ISM manufacturing data, which boosted expectations of a Fed rate cut. However, profit-taking quickly pushed prices down to $3,334 before recovering to $3,342.
📉 Technical Analysis:
• Key Resistance: $3,351
• Nearest Support: $3,334
• EMA: Price is above EMA 09 → uptrend still intact.
• Candles / Volume / Momentum: H1 candle shows a long upper wick, indicating selling pressure near the recent high. Bullish momentum is slowing, and volume has started to normalize.
📌 Outlook:
Gold may face a short-term pullback if it fails to break above $3,351 and the USD strengthens during the US session.
________________________________________
💡 Suggested Trading Strategy:
🔻 SELL XAU/USD at: $3,345 – $3,350
🎯 TP: $3,334
❌ SL: $3,353
🔺 BUY XAU/USD at: $3,332 – $3,334
🎯 TP: $3,350
❌ SL: $3,323
GOLD/USD Bullish Reversal and Breakout Target GOLD/USD Bullish Reversal and Breakout Target 🎯 ✨📈
🔍 Technical Analysis Overview:
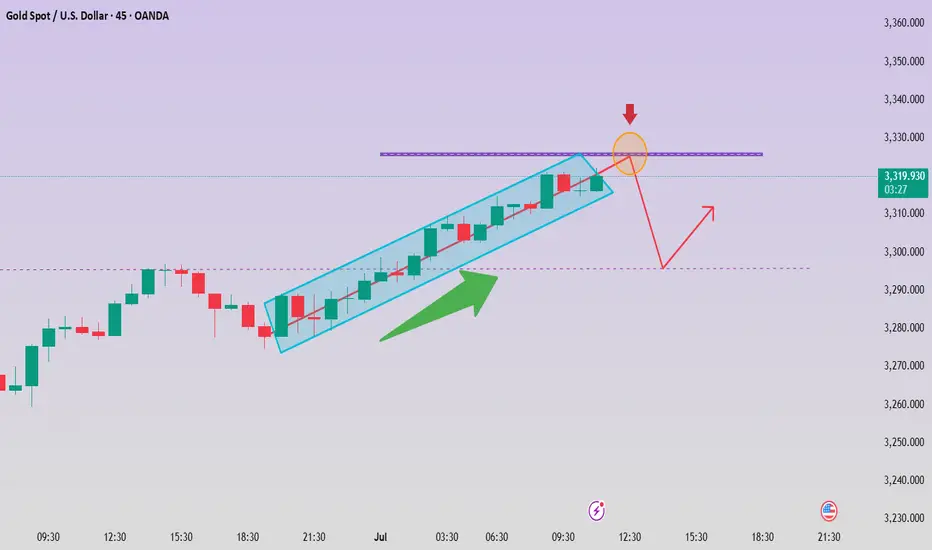
The chart illustrates a clear bullish reversal pattern following a strong downtrend, with price reacting from a key support zone (highlighted in blue).
Multiple bullish rejection wicks and confirmation candles (green arrows) indicate buying interest at this support.
The recent higher low formation confirms shift in market structure towards bullish bias.
📌 Key Zones:
🟦 Support Zone: Around 3,280 – 3,320 USD
Price respected this zone multiple times (marked with orange circles), confirming its strength.
🟥 Resistance Zone / Target: 3,430 – 3,460 USD
This area aligns with previous swing highs and is the projected target for this bullish move.
📈 Chart Structure:
Break of descending trendline and bullish momentum above support suggests potential continuation towards the marked target.
Falling wedge breakout also aligns with reversal logic.
🎯 Price Target:
3,438.515 USD (resistance area), as labeled on chart with arrow and breakout projection.
🛑 Invalidation Level:
A sustained break below the support zone (3,280 USD) would invalidate this bullish outlook.
📌 Conclusion:
Gold is exhibiting strong bullish behavior with confirmation from price action and structure break. As long as price sustains above support, the path toward 3,438 remains

Gold falls back, is a bottom structure emerging?In terms of one-hour structure, this round of phased adjustment started from 3450 has not ended yet, but it will soon, especially the rapid rebound after the bottom of 3260 on Monday. This rebound has strong momentum. After bottoming out and rebounding, it is currently fluctuating around 3340, with a large overall span. This also shows that after the price has risen, the amplitude of the correction has increased, which means that the upward space is limited. This adjustment is likely to be over soon, but there is no definite bottom structure yet, so we need to wait for some time.
Before going out of the definite bottom structure, based on the principle of following the trend, you can try to short with a light position. At present, in terms of the one-hour pattern, the key point is here at 3355, and it is currently falling back from this position to 3340. If it falls back to the 3320 area today and stabilizes above it, you can operate a long strategy. On the whole, Quaid suggests that the short-term operation strategy for gold today should be mainly long on pullbacks, supplemented by shorting on rebounds.
Operation strategy:
Short at 3345, stop loss at 3355, profit range 3330-3325.
Long at 3320, stop loss at 3310, profit range 3340-3345.

Beware of gold, false rise and real fall
💡Message Strategy
The global economic uncertainty has intensified recently, and the gold market has performed well. On Monday, the price of gold rose by 0.87%, hitting a bottom of $3247.87 per ounce before rebounding strongly. The upward trend continued in early trading on Tuesday. In the second quarter, the price of gold rose by 5.5%, rising for two consecutive quarters.
The main reason for this round of gold price rise is the weakening of the US dollar. The US dollar index has recorded its worst performance in the first half of the year since the 1970s. Market concerns about the expansion of the US fiscal deficit and uncertainty in trade agreements have weakened the attractiveness of the US dollar.
At the same time, global trade and geopolitical fluctuations, such as the Sino-US rare earth agreement, the progress of US-EU trade negotiations, and the uncertainty of the tariff deadline on July 9, have strengthened the safe-haven properties of gold. This week's focus is on Thursday's US non-farm payrolls report for June. The market expects 110,000 new jobs and an unemployment rate of 4.3%, which will directly affect the direction of the Federal Reserve's monetary policy.
Although the Federal Reserve is cautious about cutting interest rates, the market generally expects that interest rate cuts will be resumed in September, and the annual interest rate cut may reach 66 basis points. Trump's pressure on the Federal Reserve has also increased policy uncertainty.
Gold is driven up by multiple factors, but its future trend still depends on employment, inflation and tariff policies. Investors need to pay close attention to data and policy developments.
📊Technical aspects
Gold hit bottom and rebounded during the early trading session on Monday, and the price stopped after touching the previous low. The price stopped after touching the four-hour resistance position before the European session. The European session was under pressure before breaking through the four-hour resistance. After that, the U.S. session had consecutive positive days, and the price did not fall. Instead, it further broke through the four-hour resistance position, which means that the price still has the performance of testing the daily level resistance area. We will continue to follow the key breakthrough of 3300 on Monday and pay attention to the 3350-3360 area and then look at the pressure.
According to the daily level, after the price broke through the daily support last week, the price continued to rely on the daily resistance to bear pressure. At present, the daily resistance is at the 3360 area resistance. Below this position, gold can continue to be short.
According to the four-hour level, the four-hour key position is the key to our emphasis on short-term trends. Yesterday, the price broke through the four-hour resistance and is expected to adjust further. The current four-hour support is in the 3300 area. The price is short-term bullish above this position. After the subsequent high, it is expected to fall further after breaking the four-hour support again.
From the one-hour level, yesterday's strong closing, today's early trading again directly broke through yesterday's high position, so today's early trading low became the key. The price above this position tends to continue to test the daily resistance of 3360, so we will first look at the rebound, and wait until the price touches the daily resistance of 3350-3360, and then pay attention to further anti-K signals to see pressure.
💰Strategy Package
Short Position:3350-3360,SL:3370,Target: 3315-3300

Gold surged and then fell. Has it reached its peak?Information summary:
Today, the United States and Japan negotiated on tariffs. Trump said that the US-Japan deal was unfair and might send a letter to Japan; the US-Japan trade negotiations seemed to be at a standstill. Trump also threatened that he would not extend the expiring tariff period and would send letters to most countries and regions in the next few days.
Secondly, the United States accused the EU of unfair digital legislation and asked the EU to relax its supervision of US technology giants. In addition, Trump accused "Mr. Too Late" Powell and the entire committee on social media that they should be ashamed of not cutting interest rates.
Affected by the above news, gold's risk aversion sentiment heated up and prices started to rise for the second time.
Market analysis:
From the 4-hour chart, the market is currently in a slow upward trend in a downward channel, and the price is also repeatedly testing the upward pressure position of 3355. MA5-day and 10-day moving averages turned upward and crossed with the 20-day and 30-day moving averages. At present, the upward momentum is slightly insufficient. In the short term, we should focus on the suppression position of 3355. If we fail to break through this position for a long time, the trend will most likely turn into a downward trend. If no black swan event occurs, today's price will most likely fluctuate around the 3320-3350 range. If there is no black swan event, the price today will most likely fluctuate around the range of 3320-3350.
Operation strategy:
Short near 3355, stop loss 3365, profit range 3340-3330.
Long near 3315 when the price falls back, stop loss 3305, profit range 3340-3345.

7.1 London gold rebounds and rises, gold market trend analysis aGold rose to 3295 in the Asian session on Monday and was blocked. It fell in the European session as we expected, but the decline was not strong. After the lowest price of 3274.57, it rose again in the US session and stood firmly at the 3300 mark. The monthly line closed with a cross Yang K. The gold price continued to rise at the opening today. After the market on Monday, the 3247 below can be used as a reference for the bottom rebound position. Now the short-term trend belongs to the bulls, so we will continue this trend today and look at the upward trend first, wait for the European session to see the strength of the decline and then formulate the idea of the US session.
From the market point of view, after the gold price stood above the 3300 mark again, it is used as a short-term support level reference for the bulls. The Asian session can rely on this position to arrange long orders to see the continuation of the upward trend; the initial pressure on the upper side focuses on the 3328 position, followed by 3345. Now that the idea is established, the idea for intraday operations is: wait for the gold price to pull back to around 3308 in the Asian session and then go long and bullish, protect the 3300 mark, and target around 3328; if there is pressure at 3328 in the European session, you can arrange short positions with a downward trend, wait for the US session, and then decide whether to go long again based on the pullback position and target around 3345.

Gold is rising. Second starting point?Information summary:
1. The US dollar index has experienced the longest consecutive monthly decline since 2017. The weakening of the US dollar has increased the attractiveness of gold denominated in US dollars to non-US dollar holders, becoming an important support factor for gold prices.
2. Trump's continued pressure on the Federal Reserve to cut interest rates has formed a resonance effect with the weakening of the US dollar, which has jointly pushed up the short-term attractiveness of gold.
Multiple factors are intertwined, and gold has risen slightly again.
Market analysis:
Gold bottomed out and rebounded on Monday, showing a positive closing, and above 3300. After falling sideways for 5 consecutive trading days last week, although it fell for a short time on Monday, it did not continue. In this case, whether a new high can be reached, the watershed is the 3295 line. As long as the European session breaks the high, the long position is near the starting point of 3305 in the early trading session.
At present, the main focus is on the upper resistance around 3325. It opened directly upward on Tuesday, but did not break through too much space, unless it directly broke through 3325-3330; then the next resistance is around 3340. At present, the bulls are still running at a high level. The upward trend line generated after the reversal is more obvious, and the trend line has good effectiveness.
Since the current market is in the first wave of rise, the high point has not been confirmed. Quaid believes that when the high point is clear and the price falls back to the support area, consider entering the market to go long based on the support level. Of course, aggressive trading can choose to buy around 3320 and choose a suitable high point to take profit.
Operation strategy:
Short near the rebound 3340, stop loss 3350, profit range 3310-3300
Long near the fall 3305, stop loss 3290, profit range 3320-3335

This is the reason why gold suddenly "changed its face"!
📣 Gold News
Spot gold closed up $28.59, or 0.87%, at $3,302.71 per ounce on Monday. Gold prices fell to around $3,246 per ounce in early Asian trading, the lowest level since May 29.
At 21:30 Beijing time on Tuesday, Federal Reserve Chairman Powell, European Central Bank President Lagarde, Bank of England Governor Bailey, Bank of Japan Governor Kazuo Ueda, and Bank of Korea Governor Lee Chang-yong will hold a group meeting.
Last Tuesday and Wednesday, Federal Reserve Chairman Powell attended a congressional hearing and said that the Fed needs more time to observe whether tariffs make inflation rise higher before considering cutting interest rates.
Powell said in his congressional testimony that he and most Fed officials expect inflation to start to pick up soon, and the Fed is not in a hurry to cut interest rates before that.
Powell said: "At present, we have good conditions to wait and further understand the possible development path of the economy before considering whether to adjust the policy stance." Yesterday, gold opened at $3381.6 and quickly fell back, reaching a low of $3248.8, then rebounded, rebounded in the early trading and touched $3270 and fell again, gold fell back, reaching a low of $3259.4, then gold did not continue to fall, and rebounded. Gold continued to rebound in the European and American markets, with the highest rebound in the US market reaching $3309.4, and finally closed at $3002.9 in the late trading. The monthly line closed with a long upper shadow line and a shooting star pattern. After such a pattern ended, today's gold rebounded high, and the upper resistance focused on the $3326 line. The rebound relied on the resistance below here to short, and the lower side looked at the $3295 line.
XAUUSD/GOLD Geopolitical conflicts have escalated again. Next week is a week of heavy news. How will the gold price focus next week? How to trade? Look at the news preview first.
1. Geopolitics, Russia-Ukraine conflict, Palestine-Israel conflict, Iran-Israel conflict.
2. ADP data, NFP data.
3. Tariff deadline.
The above three news are enough to cause drastic fluctuations in the gold price.
On Friday, the New York market followed my expectations. After rebounding around 3282, it fell back. Finally closed around 3274.
The impact of the weekend news is huge. From the news perspective, the opening price of next Monday will be higher than the closing price on Friday. In terms of operation, you can pay attention to buying at a low price after the market opens.

Gold fluctuates upward. Is the decline over?On Monday, gold opened at around 3282, and then fell back quickly to around 3247 under pressure; the downward low was blocked, and then rebounded strongly to around 3297; the market currently maintains a small upward trend.
At present, we need to focus on the resistance range of the upward trend.
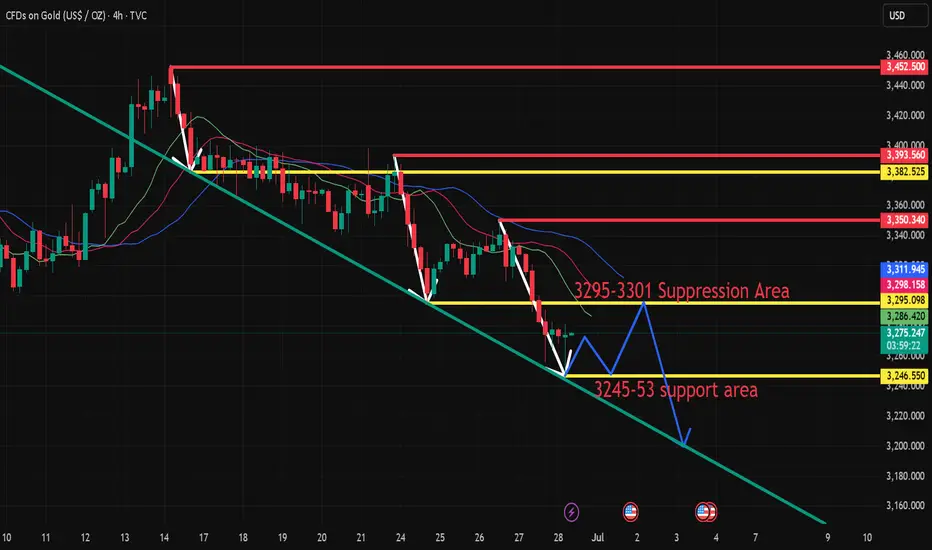
From the 4-hour chart, the upper short-term resistance is around 3295-3300, followed by the suppression range of 3310-3315. The main direction of short-term operations maintains the rebound short-selling strategy. The support below is around 3255; the overall short-term operation relies on 3260-3300 to maintain the main tone of high-altitude participation unchanged.
Operation strategy:
Short near 3305, stop loss 3320, profit range 3270-3260.
A new week has just begun. I wish you all gain something from the market fluctuations.

Gold long-short strategy US trading range operation
Gold prices (XAU/USD) recovered some of their losses during Monday's Asian trading session, driven by expectations that the Federal Reserve may cut interest rates further this year (and perhaps earlier than previously expected). This prospect weighed on the dollar, making dollar-denominated gold more attractive to overseas buyers.
However, the recent improvement in global risk sentiment (driven by the US-China trade agreement and the Israeli-Iranian ceasefire agreement) may reduce the safe-haven demand for gold. Investors will now turn their attention to upcoming comments from Federal Reserve officials, with Atlanta Fed President Rafael Bostic and Chicago Fed President Austan Goolsbee expected to speak later in the day.
Gold prices recovered, accumulating around the 3,300 price range at the beginning of the new week. Still in a major downtrend.
⭐️Set Gold Price:
🔥Sell Gold Area: 3316-3318 SL 3323
TP1: $3305
TP2: $3290
TP3: $3277
🔥Buy Gold Area: $3248-$3246 SL $3241
TP1: $3258
TP2: $3270
TP3: $3286
⭐️Technical Analysis:
Set reasonable buy orders based on technical indicators EMA 34, EMA89 and support and resistance areas.

Gold's rally has not reversed yet? The consolidation pattern hasTechnicals:
Short-term risks remain skewed to the downside as the momentum of the relative strength index (RSI) and the moving average convergence divergence indicator (MACD) weakens. The RSI hit a new low below the neutral 50 mark. If short pressure intensifies in the next few trading days, gold prices may retest the upper track of the previous falling channel at 3215, followed by the rising support line from October 2024 at 3150. If it falls below this level, the decline may accelerate towards the psychological level of 3000, or even lower to 2970.
On the upside, if a strong catalyst pushes gold to rebound above the 20-day and 50-day moving averages (currently 3320-3350), the next resistance level may appear in the 3400-3435 range. A decisive close above this boundary may pave the way for gold prices to move towards 3500, or test resistance near 3530, and then may target the 3600 level.
Overall, despite the weakening technical indicators, gold has not completely lost its bullish reversal potential. As long as the price remains within the sideways structure above 3150, the downward pressure may still give rise to a "buy on dips" strategy.

Gold bulls are suppressed, rebound short-selling range grasp
💡Message Strategy
The cooling of geopolitical tensions and the easing of Sino-US trade tensions have boosted market risk appetite, and rising stock markets have weakened the attractiveness of holding gold, suppressing gold prices.
However, geopolitical tensions have not completely calmed down, and expectations of a September rate cut by the Federal Reserve have increased, limiting the decline in gold and providing support. In terms of operations, it is recommended to treat it with a volatile mindset.
📊Technical aspects
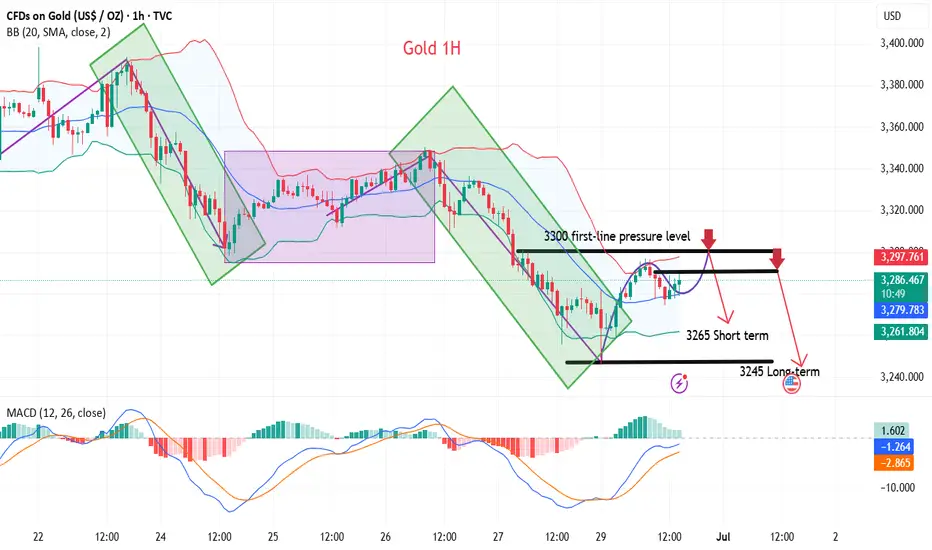
On the daily chart, after gold hit a two-month high in mid-June, it encountered resistance and fell back, hitting a new low in nearly a month, and the short-term trend is biased downward.
For gold's upper pressure, pay attention to the intraday high of $3,300. The gold price bottomed out and rebounded during the day. For gold's lower support, pay attention to the intraday gold price rebounding above the rising position of $3,270, followed by the intraday low of $3,247, which is also near the low point of the gold price after the rise in May. The 5-day moving average and the MACD indicator cross downward, showing that the short-term technical side is dominant.
From the 1-hour analysis, the upper short-term resistance is around 3277-3281, the 3295-3301 line is suppressed, and the 3316 line is suppressed.
In terms of operation, the main short-term support is around 3250-3255. The overall main tone of high-altitude participation remains unchanged in this range, so pay attention in time.
💰Strategy Package
Short Position:3290-3300,SL:3316,Target: 3240-3250
Gold is trading sideways. Has it reached a high point?On the first trading day of this week, after hitting 3247 in the early Asian session, it quickly rebounded to around 3295, and then fell back slightly. It is currently maintained at around 3285.
From the hourly chart, the Fibonacci 0.618 position of this trend from 3247 to 3297 is at 3278. The price has always been above 3278, but it has only fallen below this position in a very short time. If the retracement does not break through the 0.618 position, there is a high probability that there will be a high point in the subsequent trend.
Next, we should focus on the area around 3280. If the price always closes above 3280, then today's high point of 3297 will most likely be refreshed. If the upward trend is opened again, it is very likely to touch around 3310. 3310 is also the current 0.618 position. And it is also the top position of this hourly chart range.
Therefore, we should be cautious when shorting gold above 3280, as there is a high probability that it will reach above 3300.
Aggressive trading can rely on entering the market and going long near 3280, and the profit range is between 3300-3310.
For short strategy trading, Quaid recommends that it is safer to short when the price rebounds near 3310.

Gold Faces Resistance Near $3,300 Ahead of U.S. Jobs Data📊 Market Highlights:
Gold holds firm above $3,280 supported by expectations of future Fed rate cuts, but upside momentum has stalled as traders await this Friday’s U.S. jobs report. A slight rebound in the U.S. dollar and elevated bond yields are pressuring gold in the short term.
📉 Technical Analysis:
• Key Resistances:
– $3,300 (strong psychological and profit-taking level)
– $3,320 (last week’s high – potential heavy selling zone)
• Key Supports:
– $3,255 (short-term dynamic support – EMA 09)
– $3,230 (major support from previous breakout structure)
• EMA 09: Price remains above the 09 EMA → trend still bullish
• Momentum: The bullish momentum is weakening. A shooting star candle near $3,300 and RSI approaching overbought territory (>70) suggest a possible short-term correction.
📌 Outlook:
Gold may retreat to $3,255 or lower if it fails to break above the $3,300–$3,320 resistance zone. However, the overall bullish trend remains intact as long as price holds above $3,230.
💡 Suggested Trade Setup:
🔻 SELL XAU/USD at: $3,295 – $3,300
🎯 TP: 40/80/200 pips
❌ SL: $3,305
🔺 BUY XAU/USD at: $3,255 – $3,260
🎯 TP: 40/80/200 pips
❌ SL: $3,245

6.30 Safe haven disappears, gold loses its luster!Gold did not break through the upper pressure at midnight last Friday. Gold fell directly after opening in the morning on Friday. The bears broke through the previous 3295 support line, and the lowest reached 3255 in the evening. It closed at around 3274, and the daily line also closed in the form of a big Yin line.
From the 4-hour analysis, the upper short-term resistance focuses on the 3295-3301 line, and the 3316 line is focused on. In terms of operation, it is still rebounding and continuing to be short and follow the trend to fall. The short-term support below focuses on the 3250-3255 line. The overall high-altitude participation tone remains unchanged relying on this range. I will remind you of the specific operation strategy during the session, and pay attention to it in time.
Gold operation strategy:
1. Short gold rebounds at the 3295-3301 line, and short gold rebounds at the 3314-16 line, stop loss at 3326, target 3255-3260 line, and continue to hold if it breaks;
6.30 Four-hour resistance determines the strength of the reboundAt the weekly level, the short-term focus is on the adjustment and continued breaking of the weekly support. As time goes by, the weekly support is at the 3285 watershed. At the daily level, after the price broke the daily support last week, the price continued to rely on the daily resistance to bear pressure. At present, the daily resistance is at the 3355 area resistance. Below this position, gold can continue to be shorted. At the four-hour level, the four-hour key position is the key to our emphasis on short-term trends. At present, the four-hour watershed is in the 3300 area, so the focus is on the gains and losses of this position. Before it breaks up, the short-term focus will be on the pressure first, but once it breaks up, it will need to focus on the rebound to the daily resistance. From the one-hour perspective, the bottom rebounded during the early morning session and broke through the high point of the previous trading day’s early morning retracement, so the short-term is still in adjustment. Temporarily pay attention to the gains and losses of the 3300 position, and treat it as the right-side trading method in terms of operation.
