How to accurately grasp the gold trading opportunitiesGold was greatly affected by the positive non-farm payroll data, and it rose strongly, with the increase completely covering all the losses this week. The current gold trend has completely reversed the previous bull-short balance. After breaking through the 3300 level and rising to around 3355, it maintains strong upward momentum, and the possibility of further testing the 3360-3375 area cannot be ruled out. Due to the strong positive data, if everyone fails to chase the long position or set a breakout long position in time in the first wave of the market, the subsequent pullback opportunities may be relatively limited, so it is necessary to maintain an active strategy in operation. It is recommended to continue to be bullish when it retreats to the 3335-3320 area, and the upper target is the 3360-3375 pressure range.
Goldlong
SUPER BUY GOLD XAUUSD Gold has ripped all levels of take profit and has gone up and gave us a small amount of drawdown with huge gains in return, simple trading price action and (M&Ws)

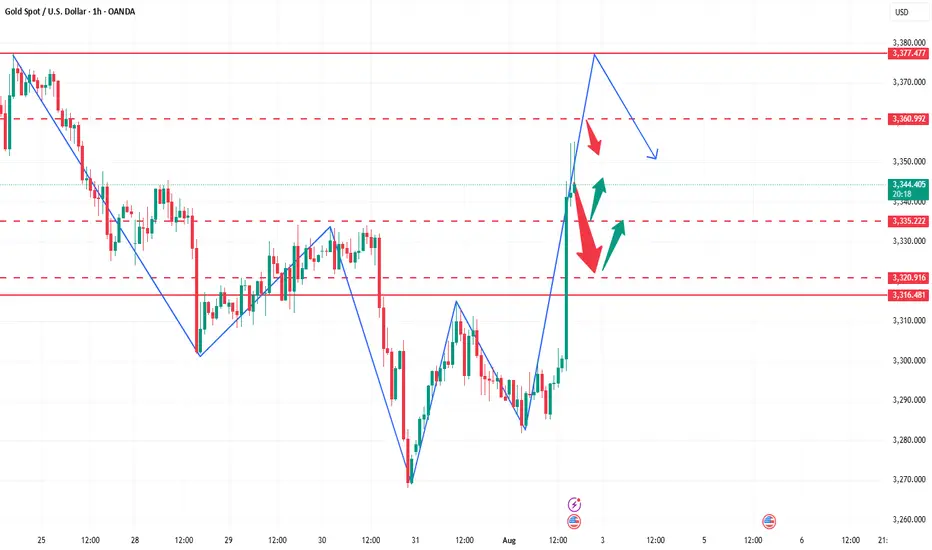
Gold Approaches Key Reversal Zone After Liquidity Sweep.Gold has recently broken out of a parallel channel during the New York session, followed by a strong upward move triggered by the NFP (Non-Farm Payroll) news event. Currently, the market is trading near a key trendline resistance zone. In this area, the price has also swept the liquidity residing above recent highs, indicating that potential buy-side liquidity has been taken out.
This level now becomes critical for observation. If the market forms a Market Structure Shift (MSS) or provides any valid bearish confirmation — such as a strong rejection candle, bearish engulfing, or a break of lower timeframe support — then there is a high probability that a downward move may follow from this zone.
As always, conduct your own research (DYOR) and wait for price action to confirm the bias before executing any trades. Acting on confirmation rather than assumptions protects both capital and strategy.

Gold is significantly bullish, where can we short?The positive non-farm payroll report pushed the market from 3300 directly above 3330, demonstrating overall bullish momentum. Congratulations again, everyone. Real-time strategies are like a beacon guiding your investment journey. The market will never disappoint those who persevere and explore wisely. Charlie advises against blindly chasing highs. Trading advice (first hit is valid): Focus on key support levels: 3300 and 3310. Go long if these levels are reached.
~For those who want to go short above 3350-55, only use a stop-loss and feel free to try~ PEPPERSTONE:XAUUSD FXOPEN:XAUUSD ACTIVTRADES:GOLD FXOPEN:XAUUSD CMCMARKETS:GOLD VANTAGE:XAUUSD VELOCITY:GOLD
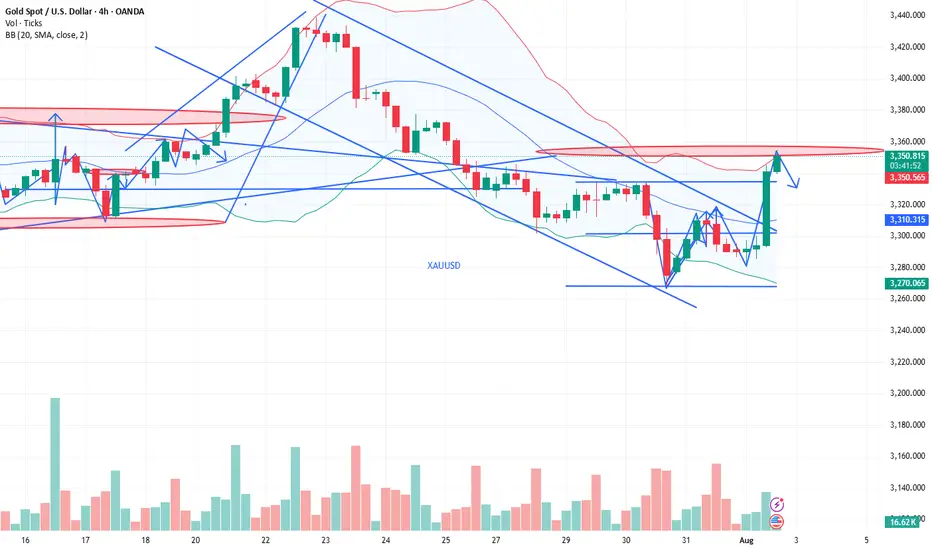
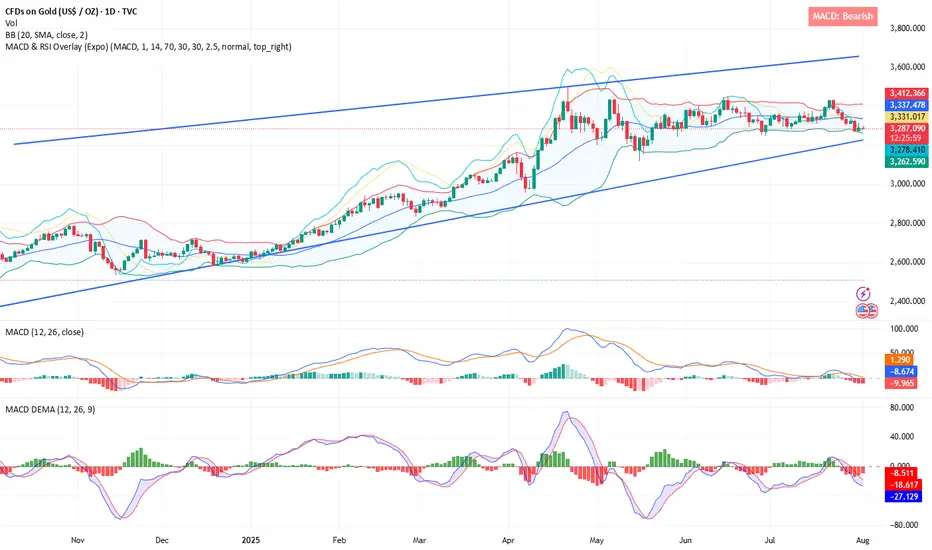
How to maintain stable operations before NFP dataYesterday, gold closed the month with a long upper shadow doji candlestick, indicating strong upward pressure, with monthly resistance at 3439-3451. Today marks the beginning of the month, and with the release of numerous data indicators such as NFP, unemployment benefits, and PMI, there is considerable uncertainty, so intraday trading should proceed with caution.
Judging from the daily chart, the current MACD indicator is dead cross with large volume, and the smart indicator is running oversold, indicating a low-level fluctuation trend during the day. At present, we need to pay attention to the SMA60 moving average and the daily middle track corresponding to 3327-3337 on the upper side, and pay attention to the intraday low around 3280 on the lower side. The lows of the previous two days at 3275-3268 cannot be ignored. There is a possibility that the low-level oscillation will touch the previous low again.
From the 4H chart, technical indicators are currently flat, with no significant short-term fluctuations expected. Low-level volatility is expected to persist within the day. Then just focus on the support near 3275 below and the middle track pressure near 3307 above. Looking at the hourly chart, gold is currently oscillating below the mid-range band, with resistance at 3295-3307 to watch in the short term.
Overall, the market is expected to remain volatile before the release of today's data. Based on Wednesday's ADP data, this round of data is also expected to be around $100,000. The contrast between ADP and NFP last time deserves our caution. The current market is basically optimistic about the short-selling situation, which is exactly what I am most worried about. If the gold price can stabilize above 3,300 before the NY data, the possibility of NFP data being bullish cannot be ruled out.
Intraday European trading suggestion: if the current gold price falls back to 3285-3280 and stabilizes, you can consider short-term long positions, with the target at 3295-3305. If the gold price tests the low of 3275-3268 again and does not break through, you can consider a second chance to go long. After making a profit of $10-20, you can consider exiting the market with profits. The market is volatile and unstable, so be sure to bring SL with you and pay close attention to the impact of the NFP data. Conservative investors can enter the market after the data is released.
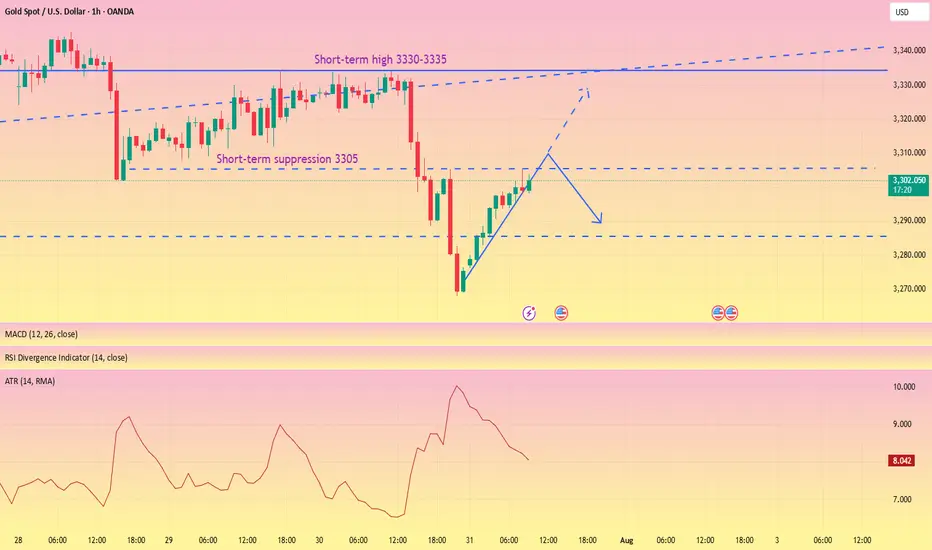
The rebound is weak, short orders intervene#XAUUSD
After two consecutive trading days of volatility, gold finally began to fall under pressure near 3335. After breaking through the 3300 mark, the price of gold accelerated its decline, reaching a low of around 3268, and yesterday's daily line closed with a large negative line. 📊
Today's rebound is more likely to be based on the buffering performance of the impact of news. The ATR data also shows that the bullish momentum is slowly weakening in the short term. 🐻After digesting the impact of yesterday's news through rebound during the day, it may fall again in the future.📉
📎The primary focus today is 3305 above, which was also the high point of yesterday's pullback correction. If the gold price rebounds to 3305-3320 and encounters resistance and pressure,📉 you can consider shorting and look towards 3290-3270.🎯
If the short-term gold rebound momentum is strong and breaks through the 3305-3320 resistance area, it will be necessary to stop loss in time. Gold may be expected to touch yesterday's high resistance of 3330-3335, which is the second point to consider shorting during the day.💡
🚀 SELL 3305-3320
🚀 TP 3290-3270
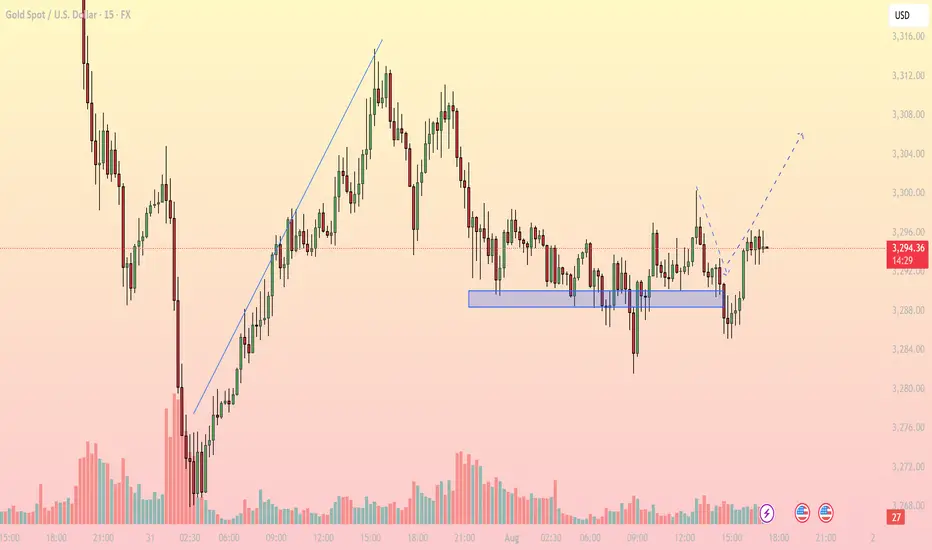
Bullish Rejection from Support, Upside in FocusMarket Overview: On the M15 timeframe, XAUUSD shows signs of a short-term bullish reversal after a prolonged sideways range around the key support zone of 3,286 – 3,289 USD. Price faked out below this support but quickly recovered, forming a V-shape reversal, suggesting strong buying interest has returned.
Key Levels to Watch:
Support Zones:
- 3,286 – 3,289: Strong intraday support, tested multiple times with sharp rejections
- 3,274: Next significant support if the above zone fails
Resistance Zones:
- 3,300 – 3,304: First resistance target aligned with the recent high
- 3,308 – 3,312: Higher resistance area where supply may emerge
Technical Indicators:
EMA: Price has reclaimed the short-term EMAs, indicating bullish momentum on lower timeframes
RSI: Rising above 50 but not yet overbought – there’s room for further upside
Volume: Increasing volume during the bounce confirms buying strength
Trading Strategy:
- Bullish Scenario (Preferred): Entry Zone: Watch for pullback toward 3,290 – 3,292
Stop Loss: Below 3,285
Take Profit 1: 3,300
Take Profit 2: 3,304
Extended Target: 3,308 – 3,312 (if bullish momentum continues beyond breakout zone)
- Bearish Scenario (Alternate): Only valid if price breaks and closes strongly below 3,286
Short Target: 3,274 – 3,270
Note: Counter-trend strategy – higher risk, requires strong confirmation
Conclusion: Gold is showing a bullish price structure on the 15-minute chart. As long as price holds above the 3,286 – 3,289 support zone, the path of least resistance appears to be upward, with 3,300 and 3,304 as the next logical targets. Monitor price action closely during the U.S. session for a potential long setup.
- Follow for more real-time gold trading strategies and save this idea if you find it helpful!
XAUUSD – Strong Bullish Reversal from Key Support XAUUSD – Strong Bullish Reversal from Key Support
Chart Summary:
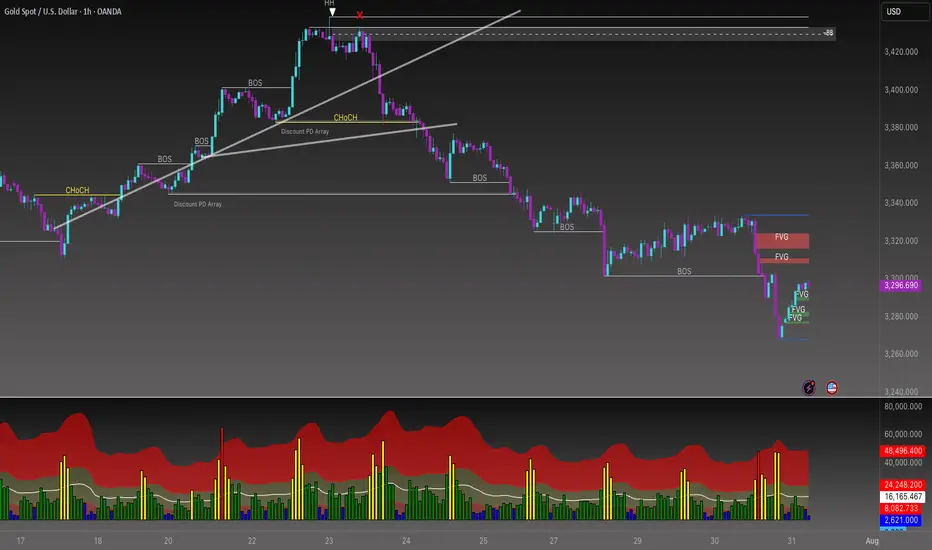
Gold (XAUUSD) has shown a clear reaction from a strong support zone near 3260, suggesting bullish momentum is gaining strength. The chart highlights multiple key market structure elements and confirms the potential for a bullish move.
Technical Highlights:
🔻 Strong Support Zone (3260–3280):
Price tapped into a well-defined demand zone with historical significance, initiating a bullish response.
🔺 Resistance Zone (3460+):
A strong resistance level lies ahead. This area may act as a potential target for bulls.
🔁 Break of Structure (BOS):
Multiple BOS marks on the chart indicate trend shifts and liquidity grabs. Most recent BOS aligns with potential reversal.
💹 Bullish Fair Value Gap (FVG):
A bullish FVG near mid-structure confirms institutional interest and adds confluence to the upside move.
📈 Target: 3,366.984 USD
Marked as the next probable short-term liquidity target. If momentum sustains, price may approach resistance above this.
Price Expectation:
If the current bullish momentum holds above the strong support zone, we may see a rally towards 3,366–3,400 USD.
This move could be driven by:
Buy-side liquidity grab above prior highs
Breakout traders entering above BOS
Reaction to macroeconomic calendar (highlighted on the chart)
✅ Educational Takeaway:
This is a textbook example of:
Support-resistance flip
Liquidity concepts (Buy-Side Liquidity)
Fair Value Gaps usage
Volume Profile confluence

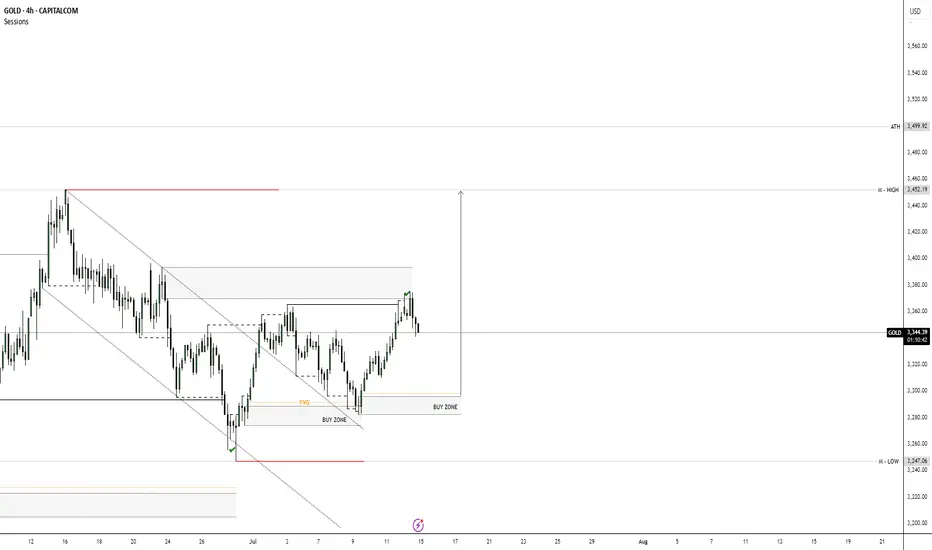
XAUUSD ANALYSYS 💸GOLD💸
Market Outlook: Bullish
• Price broke out of a downtrend channel and is now forming higher highs and higher lows — clear sign of a trend reversal.
• Current move is a pullback after a strong push up.
⸻
📍 Key Zones:
• Buy Zones and Fair Value Gaps (FVGs) are marked.
• These are areas where buyers may step in again.
• Price is pulling back into these zones — potential long entry area.
⸻
🎯 Target:
• The top red line marks a liquidity zone or resistance.
• Price is likely aiming to reach this area next.
⸻
📈 Trade Setup Idea:
• Buy on pullback to the FVG / Buy Zone.
• Stop Loss: Below the Buy Zone.
• Take Profit: At the previous high (resistance zone).
⸻
⚠️ Risk to Watch:
• If price breaks below the Buy Zone, bullish setup is invalidated — wait for new structure.
**"Gold Price Rebounding from Support:Potential Move Toward 3436This chart shows the **price movement of Gold (XAU/USD)** on a **daily timeframe**.
### Key Points:
* **Support Zone** : Around **\$3,266**, this is the area where price has bounced up multiple times, meaning buyers step in here.
* **Resistance Line**: Around **\$3,436**, this is the level where price has been rejected before, meaning sellers are strong here.
* **Current Price**: Around **\$3,293**.
### What the Chart Suggests:
* Price is near the **support** zone again.
* If the support holds, the green arrow shows a possible move **upward**.
* Price may first move up slightly, pull back, and then try to **break above resistance** at \$3,436.
Gold is in a sideways range. It's near a strong support level and might go up from here toward the resistance level, as shown by the green line.

Direct Buy In Gold : Coming Currently gold is trading under falling wedge pattern which will explode soon once volume will come . Buying here is good idea imao

XAUUSD: BUYThere are some good trading opportunities in the market. That's when to buy. Gold prices haven't fallen further since falling back to 3390. There's no further negative news. Therefore, there won't be a significant short-term decline. Our focus will be on tomorrow's non-farm payroll data update. This is a crucial factor that can cause gold prices to rise or fall significantly in the short term.
I'll update you with real-time buy and sell opportunities. This is based on research from the Swing Trading Center. It's highly authoritative. Don't miss out! Remember to stay tuned.
XAUUSD: BUY 3292-3282 TP 3320. SL 3265

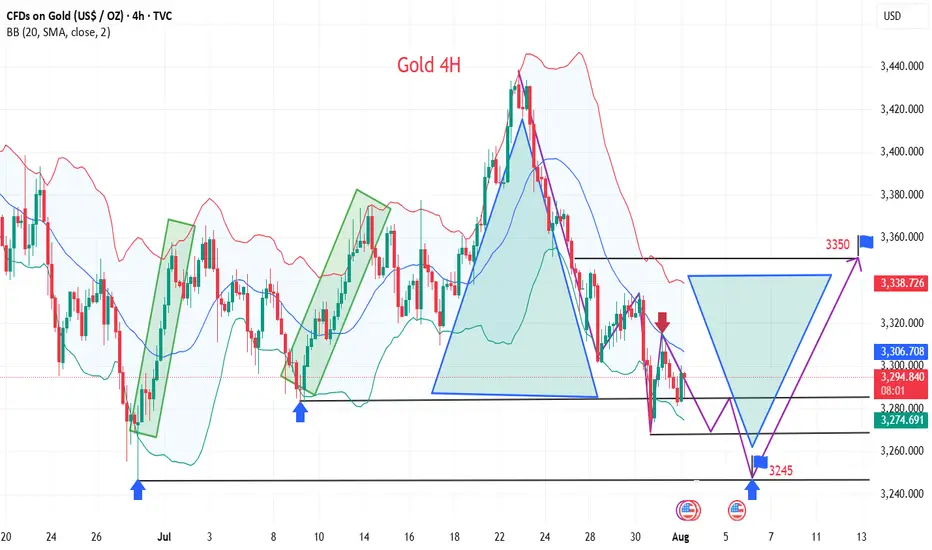
Gold non-farm payroll layout strategy
💡Message Strategy
Gold prices (XAU/USD) remained under pressure in Asian trading on Friday, trading below $3,300, not far from the January low reached earlier this week. Gold failed to extend its modest overnight rebound, primarily due to the strong US dollar.
The Federal Reserve's latest hawkish tone has prompted a reassessment of the timeline for interest rate cuts, boosting demand for the US dollar and weighing on the non-interest-bearing asset of gold.
The US dollar index rose for the seventh consecutive day, reaching a new high since late May, further weakening gold's appeal. Key to driving the dollar was the latest inflation data: the US PCE price index rose to 2.6% year-on-year in June, while the core index remained stable at 2.8%, exceeding market expectations and reinforcing the view that inflation is persistent.
The U.S. July non-farm payroll report, due on Friday, is seen as a key indicator for assessing economic resilience and the outlook for interest rates. It is expected that employment will increase by 110,000 and the unemployment rate will rise slightly to 4.2%.
📊Technical aspects
From the current technical perspective:
1: The technical pattern suggests a weak rebound and weak continuation.
2: The weak sideways trend is expected to trigger a third phase of bottoming out, stimulated by data.
To summarize: Technically, based on the data, the pattern suggests a downward trend, driven by negative data, leading to a bottoming-out and rebound. Therefore, caution must be exercised against this type of bottoming-out and rebound after the data has been released.
💰Strategy Package
Strategy: Fall first, then rise
Short Position:3310-3315,SL:3325,Target: 3245-3250
Long Position:3240-3250,SL:3220,Target: 3300-3320
Waiting for non-farm payroll dataGold prices (XAU/USD) remained under pressure in Asian trading on Friday, trading below $3,300, not far from the January low reached earlier this week. Gold failed to extend its modest overnight rebound, primarily due to the strong US dollar.
The Federal Reserve's latest hawkish tone has prompted a reassessment of the timeline for interest rate cuts, boosting demand for the US dollar and weighing on the non-interest-bearing asset, gold.
The US dollar index rose for the seventh consecutive day, reaching a new high since late May, further weakening gold's appeal. Key to the dollar's momentum lies in the latest inflation data: the US PCE price index rose to 2.6% year-on-year in June, while the core index remained stable at 2.8%, exceeding market expectations and reinforcing the view of persistent inflation.
"Both inflation data and GDP data suggest the US economy remains resilient, giving the Fed little reason to rush into easing," said a Fed observer. "This limits gold's near-term potential as a hedge."
Meanwhile, US President Trump signed an executive order on Thursday imposing import tariffs ranging from 10% to 41% on several trading partners, including Asian countries. Countries with trade deficits will face tariffs of at least 15%. This move has heightened global trade concerns, boosted market demand for safe-haven assets, and provided some support for gold.
Despite this, gold prices remain mired in a downward trend. Investors are generally maintaining a wait-and-see approach, awaiting Friday's release of the US July non-farm payroll report. This data is seen as a key indicator of economic resilience and the interest rate outlook. Expectations suggest an increase of 110,000 jobs and a slight rise in the unemployment rate to 4.2%.
The daily gold chart shows that prices are in a weak consolidation phase, capped by key resistance near $3,320. If gold prices fail to break through this area, there is a risk of further decline in the short term. Stronger resistance lies above $3,350. A breakout on strong volume could trigger a rebound towards the $3,380 area, potentially pushing the price above $3,400.
As for downside support, the 100-day moving average provides initial support near $3,270. A break below this could trigger further downward pressure, targeting the $3,240 area, the June low. A further break below this level would target the psychologically important $3,200 level.
In terms of indicators, the MACD death cross continues, with a shortening red bar, indicating weakening bearish momentum but no reversal. The RSI remains in neutral to weak territory, not clearly oversold.
The current gold trend is characterized by a "structurally bearish, sentimentally supportive" pattern. Despite the trade war and heightened global risk aversion, the Federal Reserve's caution about inflation and the strong dollar are exerting significant pressure.
If the July non-farm payroll data is strong, gold could test further technical support. Conversely, weak data or a pullback in the dollar could trigger a technical rebound. PEPPERSTONE:XAUUSD ACTIVTRADES:GOLD VANTAGE:XAUUSD FOREXCOM:GOLD EIGHTCAP:XAUUSD FOREXCOM:GOLD
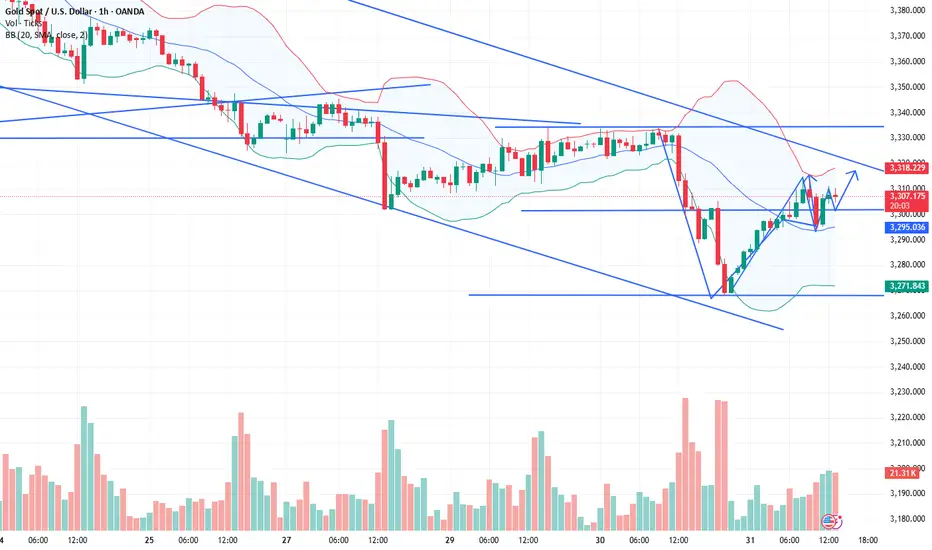
XAUUSD Price at Decision Point – Bounce or Breakdown?Gold (XAUUSD) is currently trading between two significant zones — a ⏫ 1H Order Block above and a 🛑 Major Support level at 3268.
At this stage, price action remains undecided, and we have a few key scenarios to monitor:
🔄 Potential Scenarios:
📌 Price taps into the 1H OB, then shows signs of rejection — this could trigger a move back down toward support.
⬇️ Price drops directly to 3268, where buyers may step in for a potential bounce.
🚀 If the price breaks through the OB, it may continue pushing up toward the liquidity area around 3248.
⚠️ If support fails, we could see a deeper bearish continuation.
These zones are crucial for both intraday and swing setups. Be patient and wait for a clean reaction to catch a high-probability move.

Gold bottomed out and rebounded, and gold is still rising!The latest news indicates that Trump has announced a 50% tariff on Brazilian products and a 25% tariff on Indian products, and has firmly stated that the tariffs will take effect on August 1st, with no further grace period. These positive factors will also support a rebound in gold.
As for tomorrow's big non-farm payrolls, considering that both the previous two times were negative and contrary to the ADP, it is very likely to be bullish for gold, which may help boost a steady rebound in gold, so there is no need to worry if you are stuck with gold.
Nothing rises forever, and nothing falls forever. Last week, the market rose in the first half, then fell in the second half. With the first half of this week's decline, the daily chart has already fallen to near the 100-day moving average. Be wary of a rebound in the second half. Gold is bearish today, but don't chase shorts. Focus on the 3300 resistance level. If it breaks above and stabilizes, expect a continued rebound to 3330-3345!
A real-time strategy is like a beacon guiding your investment journey. The market will never disappoint those who persevere and explore wisely. FX:XAUUSD VELOCITY:GOLD FXOPEN:XAUUSD ACTIVTRADES:GOLD PYTH:XAUUSD
Short position profit. Latest strategyYesterday's gold price fluctuated: it maintained sideways fluctuations in the morning and started a downward channel after the opening of the US market. The Federal Reserve's interest rate decision remained unchanged. In addition, Powell's speech suppressed expectations of a September rate cut. The gold price directly fell to around 3267 and closed the day with a negative line, which exceeded expectations.
Looking back at recent trends, gold prices saw a brief correction on Tuesday after four consecutive days of decline, but failed to sustain the upward trend, falling sharply again yesterday, demonstrating that the weak market remains intact. Judging from today's market, theoretically there is still room for further decline, but before yesterday's low is broken, we don't expect a big drop for the time being; if the support here is effective, the market may tend to correct.
Pay attention to the daily resistance near 3315, and try shorting with a light position; the hourly resistance is near 3301, which is also a good position for shorting; the intraday bull-bear watershed is near 3294. If the market falls weakly and rebounds here, there may be a decline. The target below will first look at 3275. If yesterday's low of 3267 is broken, look further to 3250: On the long side, pay attention to the 3249 support below. If it is close to broken, you can try short-term buying.
【Operation ideas】👇
The bearish strategy in the morning remains unchanged. The short position at 3315 was publicly set up in the morning. The market rebounded to 3314 and then went down directly. The idea of setting up short positions at 3301 in the morning session remains unchanged. Friends who did not follow up with the short positions at 3315 can now add short positions with a light position at 3300.
PEPPERSTONE:XAUUSD ACTIVTRADES:GOLD VANTAGE:XAUUSD ACTIVTRADES:GOLD ICMARKETS:XAUUSD VELOCITY:GOLD PYTH:XAUUSD

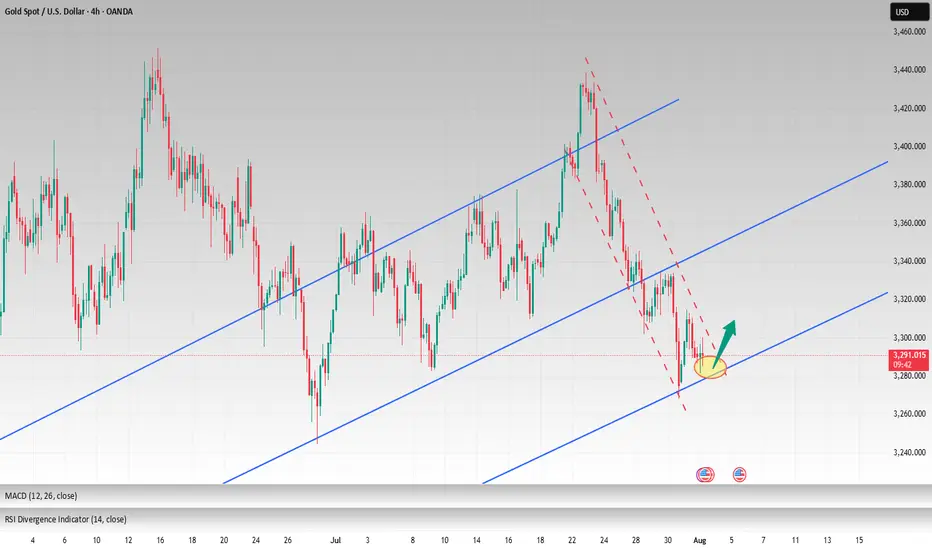
XAUUSD Long Setup – 1HGold (XAUUSD) has shown strong bullish rejection from the lower volatility band after a sharp selloff. The appearance of a Heikin Ashi reversal candle, suggests a short-term reversal is forming. Price has reclaimed key structure and is now targeting a reversion back to the mean, supported by Fibonacci retracement levels.
Entry: 3293.55
Target Zone: 3308.91 → 3333.76 (Fib 38.2% – 100%)
Stop Loss: 3253.35
Confluences:
✅ Bullish engulfing + Heikin Ashi trend shift
✅ Oversold bounce from lower channel extremity
✅ Fib retracement aligns with key structural resistance zones
✅ Custom signal confirmation (green dot)
✅ Clean R:R toward upper band and previous POI
Short-term counter-trend long targeting liquidity grab and mean reversion toward the 3308–3333 zone. Risk tightly managed with SL below local swing low.


XAUUSD and AUDUSD Analysis todayHello traders, this is a complete multiple timeframe analysis of this pair. We see could find significant trading opportunities as per analysis upon price action confirmation we may take this trade. Smash the like button if you find value in this analysis and drop a comment if you have any questions or let me know which pair to cover in my next analysis

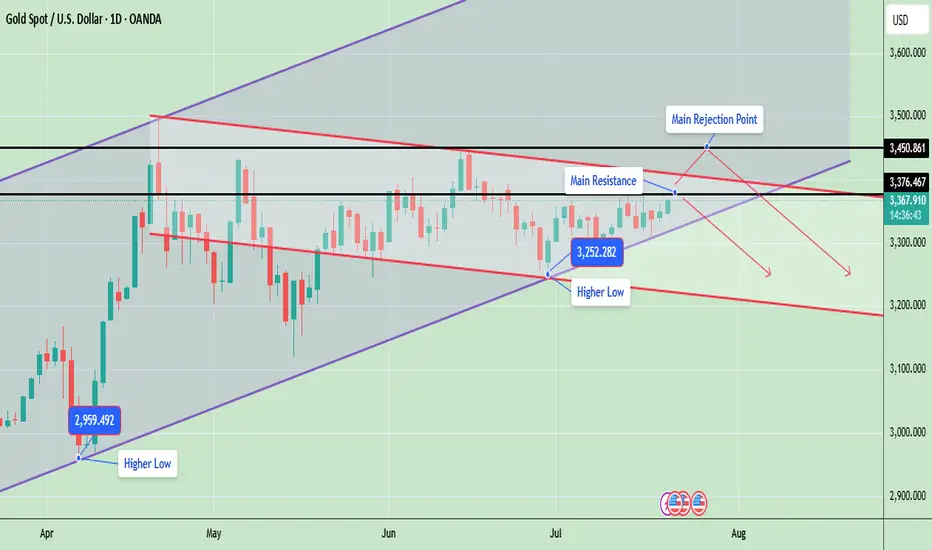
Gold Price Update – Testing Key ResistanceGold is currently trading around 3367, showing strong bullish momentum as it continues to form higher lows, which indicates an ongoing uptrend. The market structure is developing inside a rising wedge pattern, with the price consistently respecting both the ascending support and resistance lines.
Gold is now testing a key resistance zone between 3376 and 3450, an area that previously acted as a major supply zone and caused sharp rejections. A successful breakout and close above 3450 will likely confirm a bullish continuation and may open the door for a rally toward 3500 and possibly 3580. However, if gold fails to break this level, it could retrace back to the 3300 or 3250 support zones, especially if a rejection candle forms in the daily timeframe.
📊 Key Technical Highlights:
- Price has approached the upper resistance boundary of the wedge.
- Daily candle is bullish, indicating strong buying momentum.
- However, unless price closes above 3,376–3,450, there’s still a risk of rejection from the top channel and a pullback toward 3,300–3,250.
🔑 Key levels to watch:
- Gold is currently trading around $3,367, just below a crucial horizontal resistance at $3,376
- A strong breakout above $3,376, and especially above $3,450, could open the door for further bullish movement toward the $3,500–$3,600 range, following the upper trendline of the ascending channel.
- On the downside, if price fails to hold the higher low at $3,252, a drop toward $3,200 or even $3,100 is possible aligning with the downward red trendline.
- The structure remains bullish overall, as price is still making higher lows and staying within the rising channel
📊 Weekly Gold Chart Analysis
Gold is currently trading around $3,368, forming a symmetrical triangle pattern on the weekly timeframe. This pattern typically indicates a period of consolidation before a potential breakout in either direction. The price is getting squeezed between lower highs and higher lows, which is a sign of decreasing volatility and approaching breakout.
🔑 Key Technical Insights:
- ✅ Current Structure: Price has been consolidating within a triangle since April 2025 after a strong upward move. It is now near the apex of the triangle, suggesting a breakout is imminent—most likely in the next 1–2 weeks.
🔼 Bullish Breakout:
- If gold breaks above the triangle resistance (~$3,385–$3,393), it could trigger a sharp rally.
- Upside targets post-breakout: $3,450, $3,500, $3,600+ (if momentum continues)
🔽 Bearish Breakdown:
- A break below the triangle support (~$3,335–$3,325) may lead to a deeper correction.
- Downside targets post-breakdown: $3,285, $3,200
- Possibly $3,100–$3,050 if bearish sentiment intensifies
📉 Volume Drop:
As typical with triangles, volume has likely decreased, signaling indecision. Once volume returns, it will likely confirm the breakout direction.
Note
Please risk management in trading is a Key so use your money accordingly. If you like the idea then please like and boost. Thank you and Good Luck!
Beyond the Chart – GOLD Market Technical Analysis🧠 OANDA:XAUUSD Market Outlook: Gold (XAU/USD)
✅ Bullish Case (Upside Bias)
• Price has reclaimed multiple Fair Value Gaps (FVGs) on the way up.
• Holding above the 0.382 Fib level (3293) indicates moderate bullish momentum.
• A confirmed breakout above 3301 (0.5 Fib) may open the path to key resistance levels:
• 3308 (0.618 Fib)
• 3314 (0.705 Fib)
• 3319 (0.786 Fib)
📌 This move is likely a retracement rally within a broader downtrend — unless price reclaims above 0.786 with strength, confirming a shift in structure.
⸻
🛠️ Trading Plan
• Bullish Setup: Long above 3301, targeting 3308 → 3314, with tight stops.
• Bearish Setup: Look for rejection patterns at 3308–3314 zone, targeting a move back to the 3280 area.
⸻
📘 Disclaimer: This is educational content and not financial advice. Always do your own analysis and manage your risk accordingly
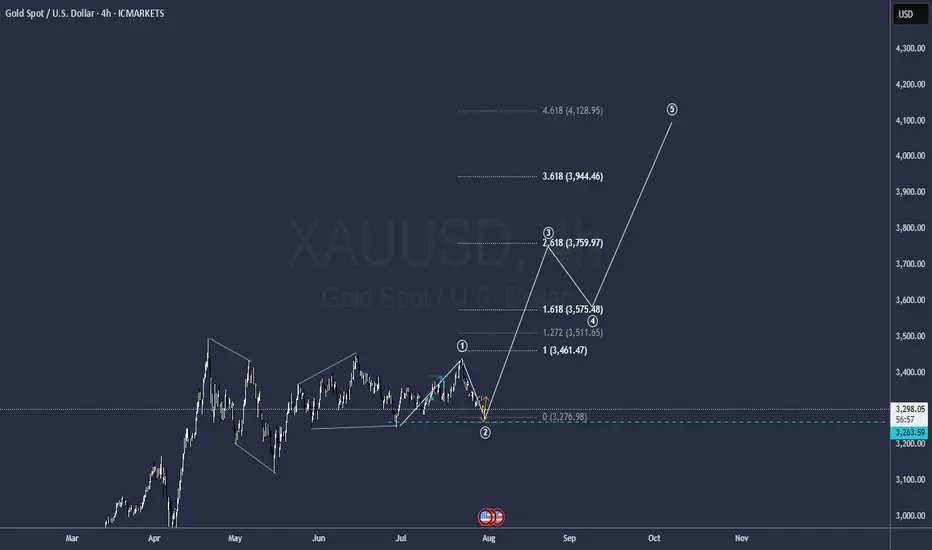
GOLD to all time highsIt is ready
a bitch wave one correction seems to be over so get ready to hit 4.000
GG