XAU/USD (Gold) chart EMA-based structureXAU/USD (Gold) chart EMA-based structure :
Trend Overview:
* **Short-term bias is bullish**, as price has broken above recent structure and is currently forming higher highs and higher lows.
* Price is **above the 7, 21, and 50 EMAs**, which are aligned bullishly and sloping upward — confirming upward momentum.
Key Levels:
Current Price:** \~\$3,319
* Trading just below **a strong resistance zone** (highlighted in green), indicating a potential challenge ahead for bulls.
Resistance Zone: \~\$3,323–\$3,336
* This area has previously acted as a **supply zone**, where price was rejected.
* Bulls need to break and hold above this level for continued upside toward **\$3,340+**.
Support 1 (S1):** \~\$3,314–\$3,310
* A recent breakout zone; if price retraces, this could be **retested as support**.
* If held, it may offer a **bullish continuation** setup.
Support 2 (S2):** \~\$3,302
* If S1 breaks, price may fall further to this **deeper demand zone**.
* A loss of this level would likely **shift short-term bias bearish** and target lower lows.
Scenarios
Bullish Path:
* Price holds S1 → pushes up → breaks resistance (\~3,323–3,336)
* Target: **\$3,340+**, then possibly \$3,350+ if momentum continues
Bearish Path:
* Price breaks below S1 and EMA support → retests S2 (\~3,302)
* If S2 fails, potential drop to **\$3,284–\$3,276 zone** (previous weak low zone)
Conclusion:
* **Bulls in control** short term as long as price stays above **EMA cluster (\~3,310–3,306)**
* A clean break above **\$3,336** confirms bullish continuation
* Break below **\$3,302** shifts bias bearish
Goldlong

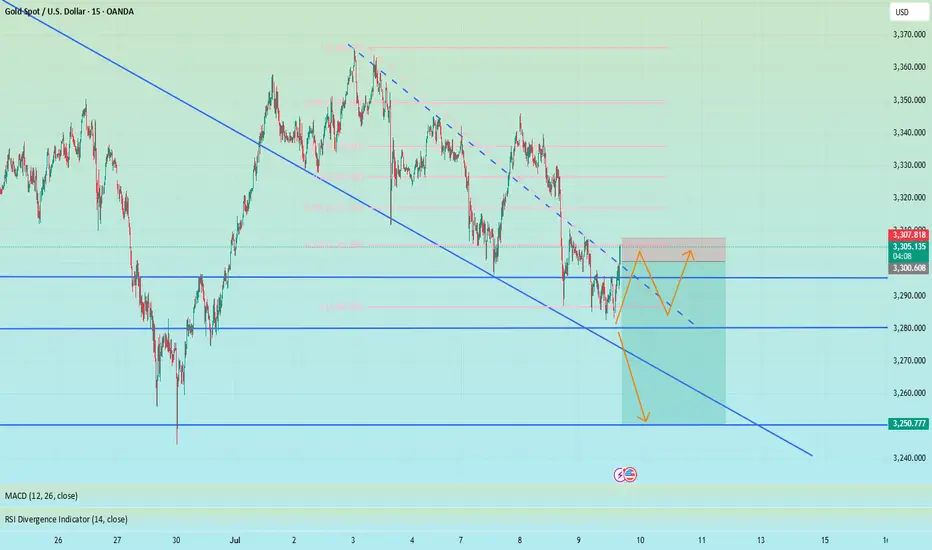
Gold fluctuates, consolidation in the 3330-3310 range📰 News information:
1. Waller meeting on interest rate cuts
2. Trump tariff issues
📈 Technical Analysis:
Waller will participate in the meeting in more than two hours and pay attention to whether there is any news of interest rate cut. The key is to operate around the 3330-3310 range. Continue to pay attention to the support of 3310-3305 at night. If gold falls below 3310,-3305 again, the downward trend will continue, and it is expected to touch 3280 again, or even 3250. If it rebounds above 3330, it is likely to continue to rise.
In addition to investment, life also includes poetry, distant places, and Allen. Facing the market is actually facing yourself, correcting your shortcomings, facing your mistakes, and exercising strict self-discipline. I share free trading strategies and analysis ideas every day for reference by brothers. I hope my analysis can help you.
TVC:GOLD FXOPEN:XAUUSD FX:XAUUSD FOREXCOM:XAUUSD PEPPERSTONE:XAUUSD OANDA:XAUUSD

XAG/USD (Silver) - Triangle Breakout (09.07.2025)The XAG/USD (Silver) pair on the M30 timeframe presents a Potential Buying Opportunity due to a recent Formation of a Wedge Breakout Pattern. This suggests a shift in momentum towards the upside and a higher likelihood of further advances in the coming hours.
Possible Long Trade:
Entry: Consider Entering A Long Position around Trendline Of The Pattern.
Target Levels:
1st Resistance – 3749
2nd Resistance – 3781
🎁 Please hit the like button and
🎁 Leave a comment to support for My Post !
Your likes and comments are incredibly motivating and will encourage me to share more analysis with you.
Best Regards, KABHI_TA_TRADING
Thank you.
Disclosure: I am part of Trade Nation's Influencer program and receive a monthly fee for using their TradingView charts in my analysis

Gold rebounds as expected, NY focuses on the Fed meeting📰 News information:
1. Federal Reserve meeting minutes
📈 Technical Analysis:
Gold fell into a narrow range of fluctuations during the European trading session. As I said this morning, gold is expected to rebound in the short term and the bullish momentum needs to be released. From a technical perspective, the overall market is still in a volatile pattern. The support at the 3280 level below is still a key point that needs attention in the short term. The European session has repeatedly tested this area. If it falls below this support, it is expected to touch the 3250 level as I said. While guarding against gold diving during the NY session, the upper resistance of 3315-3321 cannot be ignored to prevent bullish retaliation.
🎯 Trading Points:
SELL 3315-3321-3333
TP 3300-3290-3280-3250
In addition to investment, life also includes poetry, distant places, and Allen. Facing the market is actually facing yourself, correcting your shortcomings, facing your mistakes, and exercising strict self-discipline. I share free trading strategies and analysis ideas every day for reference by brothers. I hope my analysis can help you.
OANDA:XAUUSD PEPPERSTONE:XAUUSD FOREXCOM:XAUUSD FX:XAUUSD FXOPEN:XAUUSD TVC:GOLD
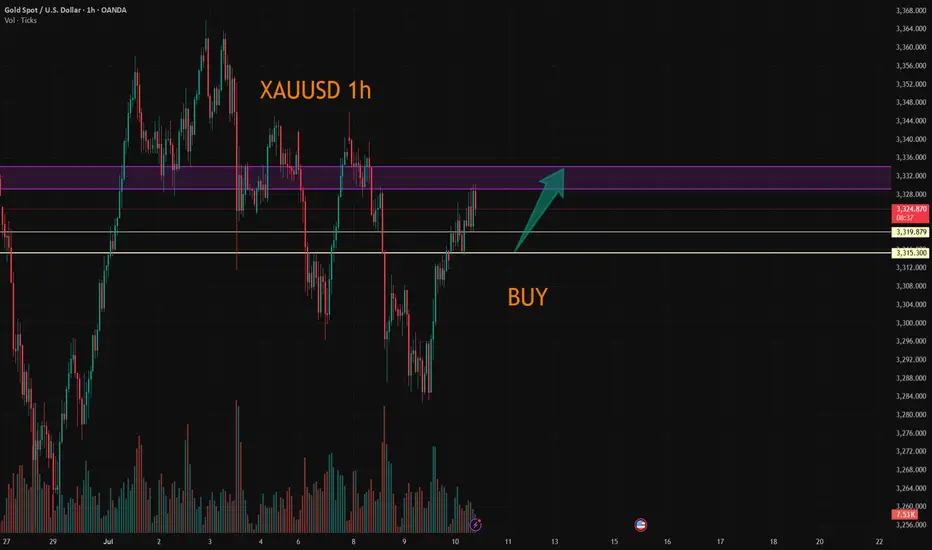
XAUUSD:Wait for 3315-19 to go long.
The market is experiencing short-term narrow-range fluctuations. There is a certain level of pressure at 3330. I tend to view it more positively as a breakthrough.The trading range for today has narrowed.
Trading Strategy:
BUY@3315-19
TP3329-34
I will closely follow up on every trading strategy I develop. If you are unsure about how to conduct a trade, you can simply come to me for help.
More detailed strategies and trading will be notified here ↗↗↗
Keep updated, come to "get" ↗↗↗
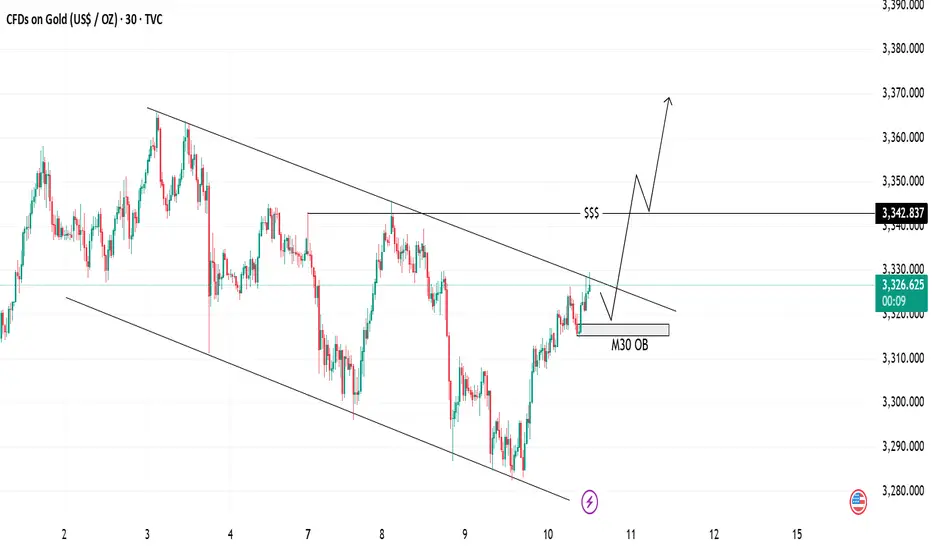
Gold Analysis Bullish Breakout | Trendline & OB Setup📈 Gold Analysis
We are currently seeing price action within a descending channel, testing key support at the M30 OB (Order Block). The price is pushing higher after bouncing off the support level, and the trendlines suggest a potential breakout to the upside.
💡 Key Levels:
Support Zone: 3326
Resistance Zone: 3342
The market is primed for a possible rally, indicated by the upward momentum and price breaking out above the trendline. Watch for confirmation as we approach the liquidity level for further bullish movement.
⚡ Trade Idea: Look for a long entry if price closes above the trendline for a continuation towards the next resistance.
XAUUSD:Stay long
Today's Shock Trading strategy:
Day traders can buy long positions at 3318-23 with a target range of 3340-45
Median traders please refer to the previous thinking unchanged.
More detailed strategies and trading will be notified here ↗↗↗
Keep updated, come to "get" ↗↗↗

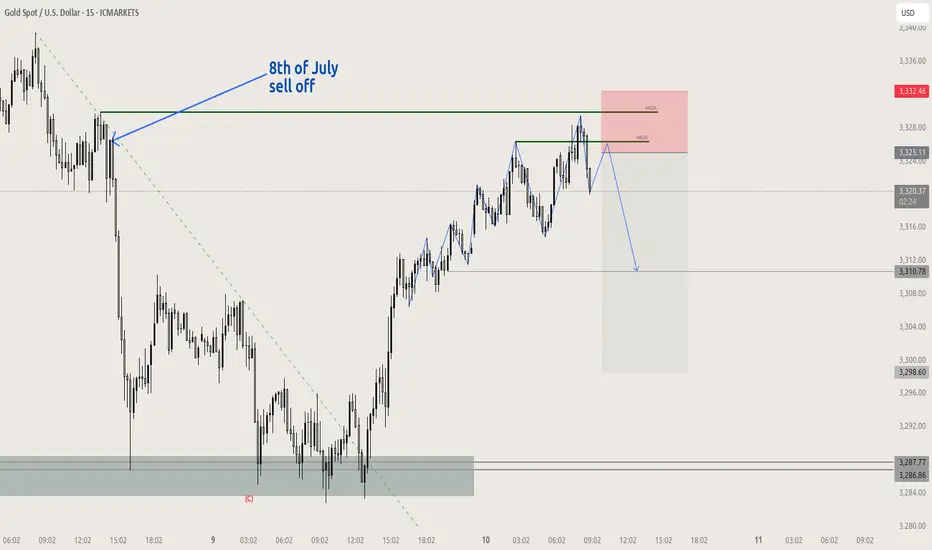
XAUUSD swing failure with FVGpotential short setup, loads of liquidity from 8th of july sell off, if no retest before reaching local new lows ( mid range of target) look for continuation buys
XAUUSD Idea: 4H Trendline First Breakout - Liquidity PlayFOREXCOM:XAUUSD
🔍 Analysis Overview:
Price has just broken above a 4H descending trendline for the first time. However, I remain cautious due to the following key observations:
📌 NOTES:
The broader market sentiment is still bearish due to recent tariff-related news, which often fuels risk-off behavior.
Historically, the first breakout of a strong trendline often fails, trapping early buyers.
This breakout is likely attracting buy-side liquidity, giving institutions an opportunity to hunt stops.
My observation shows buying interest started around the 3308–3313 range, suggesting smart money accumulation and a possible trap.
📉 I'm watching for a fake breakout and potential reversal targeting the liquidity zones marked below around 3307 and possibly lower.
The liquidity sweep below equal lows could offer a better risk-reward setup.
💡 Conclusion:
If price fails to hold above this breakout and shows signs of rejection, I will be anticipating a return towards the previous demand zone for a liquidity grab.
#XAUUSD #GoldAnalysis #SmartMoneyConcepts #LiquidityGrab #ForexTrading #TrendlineBreak #MarketPsychology #TradingSetup #SMC #PriceAction

Falling towards 50% Fibonacci supprt?The Gold (XAU/USD) is falling towards the pivot and could bounce to the 1st resistance which is a pullback resistance.
Pivot: 3,306.96
1st Support: 3,287.36
1st Resistance: 3,342.69
Risk Warning:
Trading Forex and CFDs carries a high level of risk to your capital and you should only trade with money you can afford to lose. Trading Forex and CFDs may not be suitable for all investors, so please ensure that you fully understand the risks involved and seek independent advice if necessary.
Disclaimer:
The above opinions given constitute general market commentary, and do not constitute the opinion or advice of IC Markets or any form of personal or investment advice.
Any opinions, news, research, analyses, prices, other information, or links to third-party sites contained on this website are provided on an "as-is" basis, are intended only to be informative, is not an advice nor a recommendation, nor research, or a record of our trading prices, or an offer of, or solicitation for a transaction in any financial instrument and thus should not be treated as such. The information provided does not involve any specific investment objectives, financial situation and needs of any specific person who may receive it. Please be aware, that past performance is not a reliable indicator of future performance and/or results. Past Performance or Forward-looking scenarios based upon the reasonable beliefs of the third-party provider are not a guarantee of future performance. Actual results may differ materially from those anticipated in forward-looking or past performance statements. IC Markets makes no representation or warranty and assumes no liability as to the accuracy or completeness of the information provided, nor any loss arising from any investment based on a recommendation, forecast or any information supplied by any third-party.

Gold Rebounds from 3283, Eyes 3315 Resistance📊 Market Overview:
• Gold dropped sharply to a low of $3283 earlier today before rebounding strongly back to around $3312, supported by renewed buying interest.
• The recovery is fueled by risk-off sentiment amid ongoing trade negotiation uncertainty and a mild pullback in the U.S. Dollar Index.
• Central bank buying continues to underpin gold’s base, despite mild pressure from rising U.S. bond yields.
________________________________________
📉 Technical Analysis:
• Key Resistance: $3315 – $3335
• Nearest Support: $3280
• EMA 09: Price is trading above the 9-period EMA, signaling a short-term bullish trend.
• Candle pattern / Momentum: A strong bullish engulfing candle formed after bouncing from $3283 on the H1 chart. MACD is crossing upward, and RSI is approaching the 60 level, suggesting bullish momentum.
________________________________________
📌 Outlook:
Gold may continue to recover in the short term if it holds above the $3300 level and successfully breaks through $3315 resistance. However, failure to break above this resistance could lead to a short-term pullback toward $3290–$3280.
________________________________________
💡 Suggested Trading Strategy:
🔻 SELL XAU/USD at: $3315–3325
🎯 TP: $3295
❌ SL: $3330
🔺 BUY XAU/USD at: $3285–3295
🎯 TP: $3315
❌ SL: $3280

7.9 Latest gold trend analysis and operation layout📰 News information:
1. Federal Reserve meeting minutes
📈 Technical Analysis:
Our decision to close our positions at 3305 yesterday was undoubtedly a very strategic one. After reaching a high of around 3310 last night, it began to fall. At the same time, I also gave VIP members the news that it might fall back to around 3300. Since the opening, the lowest point has reached around 3285. The overall trend is still under our control.
At present, gold will still usher in technical corrections in the short term. The current price of 3293-3290 support can be considered for long positions. If the European session continues to fall below the low, you can try to go short during the NY session. If the European session continues to maintain sideways consolidation, you can consider retreating and going long during the NY session. As long as the key support of 3250 below is held, gold will maintain its consolidation trend in short-term trading. On the contrary, once it falls below 3250, gold may directly touch the 3200 mark. Focus on the minutes of the Federal Reserve meeting, which may further influence the trend of gold.
🎯 Trading Points:
BUY 3293-3290-3285
TP 3305-3310-3320
In addition to investment, life also includes poetry, distant places, and Allen. Facing the market is actually facing yourself, correcting your shortcomings, facing your mistakes, and exercising strict self-discipline. I share free trading strategies and analysis ideas every day for reference by brothers. I hope my analysis can help you.

Big day for xauusd (gold)today fed (fomc ) will change the game , so i provide the level on chart. please check that levels . chart say #xauusd touch the level 3264 on negative news that level for buy and positive news for #gold 3296 and 3307 level and next t day 3328 and 3343 . so all thing on fed sir. and i am going for buy . thanks

XAUUSD Loses Short-Term Support – Deeper Decline May FollowGold (XAUUSD) is showing clear signs of short-term weakness after losing a key support zone around 3,287 USD – which previously aligned with the rising trendline and the 61.8% Fibonacci retracement level (3,295.20 USD) of the prior downward move.
1. Price Structure and Current Pattern:
Price has formed a descending triangle and just broke below its lower boundary with strong bearish candles.
Consecutive bearish candles with short lower wicks indicate strong selling pressure with little buying interest.
After being rejected at 3,304.25 USD – the most recent swing high – price has dropped toward the 0.0% Fibonacci level at 3,280.57 USD.
2. Fibonacci and Key Price Zones:
The 3,295.20 area (Fibo 0.618) has now become a strong resistance after a failed recovery attempt.
The 3,280 – 3,275 zone is the next target for bears if no strong reversal appears in upcoming sessions.
A break below 3,275.73 may open the path for further downside toward 3,268 – 3,260.
3. Trendlines and Candle Behavior:
The short-term rising trendline (in red) has been broken alongside increasing sell volume.
The upper descending trendline (in light blue) remains intact, confirming that the overall structure is still bearish.
Suggested Trading Strategy:
Sell on rallies: Prefer short entries around 3,290 – 3,293, with a stop loss above 3,296.
Short-term target: Look for potential take-profit zones at 3,275 – 3,268.
Avoid bottom fishing unless there’s a strong bullish reversal signal such as an engulfing or hammer candle backed by volume.
Conclusion:
Gold is under visible downside pressure below key technical resistance. If the price fails to hold above 3,280, the downtrend could extend further. Traders should remain cautious of weak pullbacks and look to enter in line with the dominant bearish trend.

Gold Price Analysis July 9GOLD XAU/USD ANALYSIS – CONFIRMING THE CONTINUATION OF THE BEARISH WAVE
Yesterday's D1 candle confirmed the downward momentum of gold when the selling pressure returned strongly below the liquidity candle wick. This shows that the selling pressure is still dominant and the downward momentum is likely to continue in today's session.
🔹 IMPORTANT RESISTANCE ZONE: 3297
The 3297 zone – which was a strong support in yesterday's session – has now turned into a resistance zone. This is a potential SELL zone for the day, especially if there is a confirmation signal from the sellers at this price zone.
🔹 CONFUSION RESISTANCE ZONE: 3310
The 3310 area is the confluence between the downtrend line and the resistance zone of the US session – which needs special attention in the SELL strategy. If the price approaches this zone, expect a reaction from the selling side to return.
🎯 SUGGESTED STRATEGY:
SELL when price does not break through 3297 (confirm selling pressure at resistance)
SELL DCA if price breaks down to 3276
Target: 3250
BUY only considered if price holds 3276 and has a bullish reaction
📌 Key Levels:
Support: 3277 – 3250
Resistance: 3297 – 3310 – 3328
Important reaction zone: 3377 (if price rebounds)

(XAU/USD) 3H Chart – Bearish Reversal Setup from Resistance Zon1. Entry Point (Sell):
Marked at 3,335.03
This is a key resistance level where price is expected to reverse downward.
2. Stop Loss:
Placed above at 3,354.88
This acts as a protection level in case the trade goes against the direction.
3. Take Profit Targets (EA Target Points):
TP1 (Downside): 3,245.65
TP2 (Upside - if Stop Loss is hit): 3,455.76 (in case of reversal or long position)
4. Price Action Observation:
Price is currently around 3,320.56, climbing back toward the entry zone.
The red 50-period moving average (EMA) and blue 200-period MA show convergence, often preceding volatility.
---
📉 Bearish Scenario (Main Setup)
Sell Bias is expected from the 3,335 region.
If price respects the resistance zone and breaks down again, the target is 3,245.65, yielding approximately 90-point move.
This is a risk-reward favorable setup, with:
Risk: ~20 points
Reward: ~90 points
RRR ≈ 1:4.5
---
⚠️ Bullish Invalidity (Stop Loss Hit)
If the price breaks and closes above 3,354.88, it invalidates the bearish setup.
Then, the market may shift towards targeting 3,455.76 — about 100 points to the upside.
---
🔧 Technical Factors Supporting the Setup
Supply zone marked by the purple box around the entry.
Trend previously bearish — recent upward move may just be a retracement.
Confluence with MAs: Price is testing MAs — rejection here would add bearish confirmation.
---
✅ Summary of Trade Setup
Element Value
Entry 3,335.03
Stop Loss 3,354.88
Take Profit 3,245.65
Alt Target 3,455.76 (if SL hit)
Risk-Reward ~1:4.5
Bias Bearish (Sell Setup)

Wednesday's Gold Trend Analysis and Trading RecommendationsGold surged on Tuesday but then kept pulling back during the U.S. session, hitting a recent new low, with intense seesawing between bulls and bears currently. The fluctuating U.S. tariff policies have triggered volatility in risk-averse sentiment, while the over 95% probability that the Federal Reserve will keep interest rates unchanged in July has provided support to the U.S. dollar.
Technically, focus should be on the key support level around 3260 and the strong resistance range of 3320 above. The hourly chart shows short-term moving averages diverging downward, with candlesticks under pressure and showing short-term weakness, suggesting there is still a need for a pullback tomorrow. The current bull-bear watershed lies at the 3390 mark; if gold fails to break through and stabilize above 3315 effectively, any short-term rebound can be seen as a good opportunity to enter short positions.
The 4-hour chart indicates that gold found support near 3287 and slowly recovered losses, but it remains trapped in a consolidation pattern recently. Although the 3287 support is effective, the consolidation range has not been broken. The future direction depends on the actual defensive strength of the 3260 support level and the direction of the range breakout.
For Wednesday's trading, the main strategy is to go short on rebounds. Focus on the resistance zone of 3315-3320, where short positions can be established. The downside targets are 3270 and the key support level of 3260 in sequence. If 3260 is broken through effectively, it may open up more downward space.
XAUUSD
sell@3315-3320
tp:3300-3280-3260
Investment itself is not the source of risk; it is only when investment behavior escapes rational control that risks lie in wait. In the trading process, always bear in mind that restraining impulsiveness is the primary criterion for success. I share trading signals daily, and all signals have been accurate without error for a full month. Regardless of your past profits or losses, with my assistance, you have the hope to achieve a breakthrough in your investment.

Bullish reversal off major support?XAU/USD has bounced off the support level which is an overlap support that lines up with the 76.4% Fibonacci projection and could rise from this level to our take profit.
Entry: 33,295.00
Why we like it:
There is an overlap support level that lines up with the 76.4% Fibonacci projection.
Stop loss: 3,278.48
Why we like it:
There is a pullback support level that aligns with the 100% Fibonacci projection.
Take profit: 3,338.86
Why we like it:
There is a pullback resistance level.
Enjoying your TradingView experience? Review us!
Please be advised that the information presented on TradingView is provided to Vantage (‘Vantage Global Limited’, ‘we’) by a third-party provider (‘Everest Fortune Group’). Please be reminded that you are solely responsible for the trading decisions on your account. There is a very high degree of risk involved in trading. Any information and/or content is intended entirely for research, educational and informational purposes only and does not constitute investment or consultation advice or investment strategy. The information is not tailored to the investment needs of any specific person and therefore does not involve a consideration of any of the investment objectives, financial situation or needs of any viewer that may receive it. Kindly also note that past performance is not a reliable indicator of future results. Actual results may differ materially from those anticipated in forward-looking or past performance statements. We assume no liability as to the accuracy or completeness of any of the information and/or content provided herein and the Company cannot be held responsible for any omission, mistake nor for any loss or damage including without limitation to any loss of profit which may arise from reliance on any information supplied by Everest Fortune Group.

XAUUSD h4 buying target levelsGOLD (XAU/USD) - 4H Analysis
Price is currently reacting from a well-defined support zone (demand area) near $3,250–3,270, which previously acted as strong resistance and now flipped to support.
🔍 I'm watching for bullish confirmation from this zone for a potential upward move toward the next resistance levels.
🎯 Targets:
Target 1: $3,400 (First key resistance)
Target 2: $3,460 (Major resistance & previous high)
📉 If price fails to hold above the support area, this setup will be invalidated. Risk management is key.
This idea is based on structure breakout and price respecting previous resistance turned support zone.
📊 Levels:
Support (Entry Area): $3,250 – $3,270
Target 1: $3,400
Target 2: $3,460
Invalidation Below: $3,240
#GOLD #XAUUSD #PriceAction #TradingSetup #BuySetup #4HChart #ForYou #BreakoutTrade #SmartMoney #ForexAnalysis #LiquidityGrab
CAPITALCOM:GOLD

Short-term gold bulls and bears are anxious,3330 becomes the keyAt present, the market has been fluctuating narrowly in the range of 3330-3320, and both bulls and bears are in a stalemate. However, gold has formed a double-layer head and shoulders bottom pattern, so the short-term bullish trend is definitely unchanged. In the previous post, I also mentioned that if the rebound in the European session is weak and gold continues to be below 3345, then the short-term NY session may usher in a retracement and a second bottom. Therefore, I still hold a long order of 3325-3315, and temporarily modify the TP to the 3335 line. I expect that there may be a retracement here, but there may also be a direct retracement. No matter what the situation is, we need to stabilize before entering the market.
In addition to investment, life also includes poetry, distant places, and Allen. Facing the market is actually facing yourself, correcting your shortcomings, facing your mistakes, and exercising strict self-discipline. I share free trading strategies and analysis ideas every day for reference by brothers. I hope my analysis can help you.
PEPPERSTONE:XAUUSD FOREXCOM:XAUUSD FX:XAUUSD FXOPEN:XAUUSD OANDA:XAUUSD TVC:GOLD

Gold Ranges at $3,330–$3,335 – Ready for the Next Move📊 Market Overview:
Gold is currently trading around $3,330–$3,335/oz, supported by a softer US Dollar and cautious sentiment ahead of key US labor data. According to TradingView, gold is consolidating in a tight range, reflecting market indecision while awaiting a clear breakout signal.
📉 Technical Analysis:
• Key resistance: $3,345–3,350 – a strong supply zone that recently rejected price.
• Nearest support: $3,320–3,330 – multiple bounce points observed here.
• EMA09: Price is hovering around the 09 EMA on both 1h–4h timeframes → neutral/slightly ranging.
• Candlestick / Volume / Momentum:
o A “bearish flag” pattern appears to be forming, suggesting potential for a downside breakout.
o Weak buying volume during upward moves signals limited bullish strength.
📌 Outlook:
• Gold may continue to consolidate between $3,330–$3,345.
• A break above $3,345 with strong volume could open the path to $3,360–$3,380.
• A break below $3,330 could lead to further correction toward $3,300–$3,320.
💡 Suggested Trading Strategy:
SELL XAU/USD at: 3,343 – 3,345
🎯 TP: 40/80/200 pips
❌ SL: 3,355
BUY XAU/USD at: 3,330 – 3,327
🎯 TP: 40/80/200 pips
❌ SL: 3,320

How to solve the problem of order being trapped in a loop📊 Gold Day Trading Strategy (Recommendation index ⭐️⭐️⭐️⭐️⭐️)
📰 News information:
1. The lasting impact of new tariffs
2. The impact of geopolitical conflicts
3. The Fed’s interest rate cut
📈 Technical Analysis:
The recent market conditions have been volatile. Many brothers have reported that they have been trapped recently. They have just been released from short positions, but have fallen into the situation of being trapped by long orders again. I have also encountered such a situation recently. Brothers who follow me must know that I have been trapped, but in the process of being trapped, I still share my trading ideas for the brothers who are trapped to check, so that we can all get out of the trap.
Gold fell as expected and hit the lowest point of 3287 before rebounding. The current 3300-3290 range given at the bottom has certain support. At present, I have answered it. As long as it does not fall below 3285, we can still go long and look for rebound correction. TP can temporarily look at 3305-3310. At present, the short-term upper watershed is near the 3321 line. As time goes by, the medium-term point can be seen at 3345. Only when the price stands above 3345 can the upward momentum continue to touch the 3380 line, or even 3400. In the short term, you can go long if you look at the support below. In the short term, pay attention to the resistance above 3315-3320. If it encounters resistance under pressure, it will fall back. On the contrary, after breaking through the first level of resistance, the upward trend will continue.
🎯 Trading Points:
BUY 3300-3290-3285
TP 3305-3315-3320-3345
SELL 3315-3321
TP 3300-3290
In addition to investment, life also includes poetry, distant places, and Allen. Facing the market is actually facing yourself, correcting your shortcomings, facing your mistakes, and exercising strict self-discipline. I share free trading strategies and analysis ideas every day for reference by brothers. I hope my analysis can help you.
TVC:GOLD OANDA:XAUUSD FXOPEN:XAUUSD FX:XAUUSD FOREXCOM:XAUUSD PEPPERSTONE:XAUUSD
Gold Price Setup: Bullish Continuation or Rejection? 🧠 Chart Analysis (XAU/USD – 1H):
Key Structure Highlights:
CHoCH (Change of Character) zones marked both up and down indicate a battle between bulls and bears.
Recent bullish CHoCH followed by a fair value gap (FVG) retest suggests potential continuation to the upside.
Price recently bounced strongly from demand zone, shown by the green arrows and strong candle reaction.
Ichimoku Cloud:
Price is trying to break back above the Kumo (cloud), a sign of bullish momentum building.
However, resistance is still present with the Kijun and Tenkan lines converging.
FVG (Fair Value Gap):
The current price is attempting to fill and break above the FVG zone.
A successful breakout above this area confirms bullish intention.
Fibonacci Levels:
Price is hovering around the 0.5 - 0.618 retracement zone, often a strong reversal or continuation point.
Upside targets lie near the 0.786 retracement (3352) and ultimate target at 3391, a major resistance level.
Risk Management:
Trade setup shows an excellent Risk:Reward ratio.
Stop-loss placed just below the last structure low.
Potential downside to 3290–3258 if breakout fails.
🟢 Possible Next Move:
Bullish Scenario: If price clears the FVG and breaks above 3353, expect continuation to 3391.
Bearish Rejection: If rejected at FVG/0.618 level, watch for a drop back to 3290 or even 3259.
