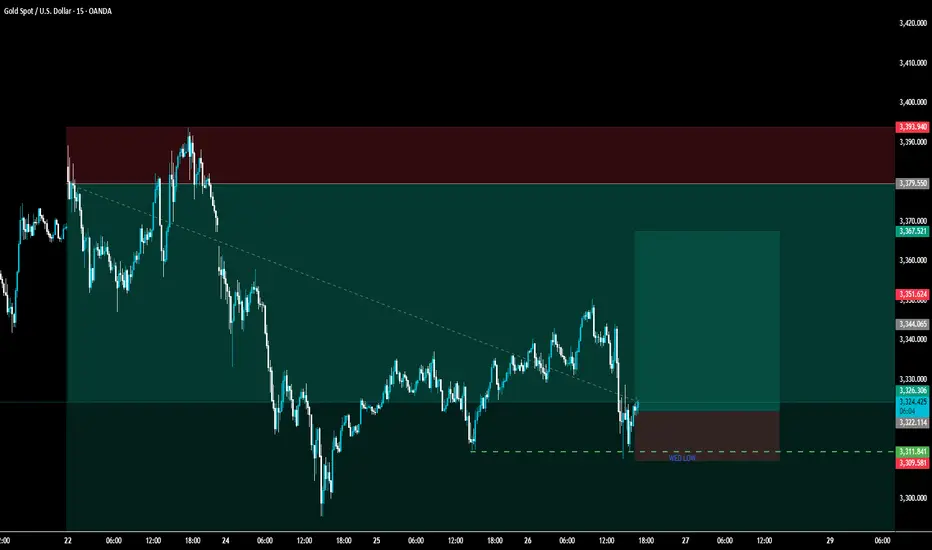
GOLD LONGSwept Wednesday low and internal liquidity. rejection on HTF targeting old highs and gap before the big drop to the downside
Goldlong
Gold fluctuates at high levels, intraday trading points📰 Impact of news:
1. Initial unemployment claims data
📈 Market analysis:
Gold has begun to show signs of bottoming out in the short term in the past two days. Since the daily line bottomed out and pulled up, the daily line closed positive yesterday, and the bulls began to counterattack, and the 1H low was rising. If it doesn't fall further in the short term, it will most likely bottom out and rebound. The upper pressure is at the Bollinger middle track of 3355, which is also the high point of Tuesday's decline. If gold breaks and stabilizes at this price, it will have a larger upward space, and the upper side will look at 3385. In the 4H chart, MACD temporarily forms a golden cross, which is a bullish signal; but the BOLL track pressure is still there, and gold bears still have momentum in the short term. Therefore, on the whole, in the short term, gold should pay attention to the 3350-3360 resistance above. If it encounters resistance under pressure here, it can consider shorting. Pay attention to the 3330-3320 support area below.
🏅 Trading strategies:
SELL 3350-3360
TP 3340-3330-3320
BUY 3330-3320
TP 3340-3350
If you agree with this view, or have a better idea, please leave a message in the comment area. I look forward to hearing different voices.
TVC:GOLD FXOPEN:XAUUSD FOREXCOM:XAUUSD FX:XAUUSD OANDA:XAUUSD

XAUUSD:Short sell at 3340-45
Today's trading needs to narrow down the range. There are signs that the center of gravity below is gradually moving upward. During the Asian session, the highest point reached around 3343. Friends who have already bought short positions here can wait for 3320-25 to take profits and exit. Those who haven't bought can wait for 3340-45 to short, with the target also being 3320-25
Trading strategy:
SELL@3340-45
TP:3320-25
It can be considered to go long when it reaches around 3320-25
More detailed strategies and trading will be notified here ↗↗↗
Keep updated, come to "get" ↗↗↗

It’s the right time to short goldThe daily gold line presents a three-top gathering pattern. The historical trend shows that the 3290-3280 area has triggered technical pullbacks many times, all of which rebounded to around 3350. The current 4-hour chart trend line suppression level coincides with the Fibonacci 0.618 pullback resistance from the previous high of 3450 to 3300 in the 3350-3360 range. This area constitutes the core pressure zone. If the price fails to effectively break through and stand above 3360 when it probes this area again, it is highly likely to replicate the previous two resistance and fall patterns. At that time, short orders will be arranged based on the 3350 first-line resistance area, with the goal of breaking the key support of 3300 and further looking down at the 3280 and 3260 levels. The overall bearish tendency is maintained, and the resistance to rebound is a signal to enter the market and sell short.
Gold recommendation: Gold is short around 3345-3352, target 3330-3320

XAUUSD: Breakout or Bull Trap?Gold (XAUUSD) on the daily timeframe is showing signs of a temporary rebound after a sharp drop from the resistance zone at 3,452 USD. Specifically, the price has bounced back from the support area around 3,291 – 3,298 USD – a region aligned with dynamic EMA support and the 0.382 Fibonacci retracement of the previous bullish leg.
1. Key Technical Structure:
A clear reversal candlestick pattern has formed at a strong support zone, paving the way for a short-term technical rebound.
The 0.5 Fibonacci level at 3,346.5 is currently acting as the nearest resistance – aligning closely with today’s closing price.
EMA 20 and EMA 50 are beginning to converge, indicating market indecision on the next directional move.
2. Short-Term Price Scenarios:
Bullish Scenario: If price holds above the 3,291 – 3,298 support zone and breaks above 3,348, it could retest the 3,400 – 3,452 highs in the coming days. In this case, strengthening EMAs and bullish candle momentum would support this setup.
Bearish Scenario: Conversely, if the price fails to break through the 3,348 – 3,352 resistance zone and falls below 3,291 again, the market may head toward deeper support levels at 3,240 – or even as low as 3,167 USD.
3. Trading Recommendations:
Short-term Buy if there is a confirmed bullish candle closing above 3,348 with strong volume; stop loss below 3,291.
Sell on rally around 3,348 – 3,352 resistance if no clear breakout is confirmed.
Apply strict risk management, especially in a choppy market environment ahead of key macroeconomic data at the end of the month.
Conclusion:
XAUUSD is currently in a “trend re-evaluation zone.” Closely monitoring the 3,291 – 3,348 range will be the key to timing efficient entries in the short term.

XAU/USD) Bullish trand Read The captionSMC trading point update
Technical analysis of Gold (XAU/USD) on the 1-hour timeframe, highlighting a breakout from consolidation supported by key levels and trend structure. Here’s the detailed analysis:
---
Technical Breakdown
1. Key Support Zone
Price has formed a strong base around 3,315–3,325, with multiple bullish rejections (green arrows).
This zone has acted as a demand level, reinforcing bullish structure.
2. Ascending Trendline Support
An uptrend line supports higher lows, showing momentum building to the upside.
3. EMA 200
Price is now challenging the 200 EMA (3,353.41) — a key dynamic resistance.
A successful breakout and retest above this EMA will likely fuel continued bullish movement.
4. Breakout & Measured Move Projections
The chart indicates a bullish breakout from a consolidation box (yellow zone).
Measured move targets based on the previous rally:
First target: 3,368.86 (1.17%)
Second target: 3,381.55 (1.75%)
5. RSI Confirmation
RSI (14) is around 57, showing bullish momentum but still below overbought—supporting further upside potential.
Mr SMC Trading point
---
Conclusion / Idea Summary
Bias: Bullish
Entry Zone: On pullback into 3,330–3,340 range or breakout retest above EMA 200
Targets:
3,368.86
3,381.55
Invalidation: Sustained close below 3,320 and break of the uptrend line
---
Please support boost 🚀 this analysis)

XAUUSD Possible Move 26.05.2025Gold is currently respecting an ascending channel, showing consistent higher highs and higher lows. Price is now testing the upper boundary of this channel and approaching a key supply zone (3353–3357), which previously triggered a strong sell-off.
Key Zones:
🔼 Sell Zone: 3353–3357 (confluence of supply + channel resistance)
🔽 Buy Zone: 3325–3329 (demand zone + channel support)
✅ Trade Ideas:
📍Buy Setup
Entry: 3325–3329
SL: Below 3310
TP: 3350–3355
📍Sell Setup
Entry: 3353–3357
SL: Above 3367
TP: 3330–3325
🔔 Important Note:
⚠️ Today's U.S. Jobless Claims data is critical. Expect volatility and possible breakout/fakeout scenarios around the time of release. Trade only on confirmation.

XAUUSD Technical Outlook – Rebound or Trap?1. Market Overview
After a sharp rejection near the 0.618 Fibonacci level, XAUUSD has pulled back and is now trading around 3,323 USD. Although price has stabilized somewhat, technical indicators suggest this is likely a corrective move within a prevailing downtrend.
2. Technical Analysis
Price Action
XAUUSD is currently hovering near 3,323 USD after a failed attempt to break above the resistance zone at 3,373–3,392 USD — an area marked by:
The 0.618 Fibonacci retracement from the recent downtrend
Repeated historical rejections.
The upper boundary of a sideways consolidation range from early June.
Recent candlesticks show indecision and rejection from higher levels, suggesting sellers are still in control.
Support Zone Behavior
The price recently bounced from the 3,294–3,317 USD range, where strong historical support and the 0.382 Fibonacci level align.
This zone continues to hold, but if broken, could open the door to deeper declines toward the 3,250 or even 3,224 USD levels.
RSI Indicator
RSI remains flat around the neutral zone, indicating a lack of bullish momentum.
No significant divergence or breakout signals are currently visible on the daily RSI chart.
3. Key Technical Levels
Resistance:
3,373 – 3,392 USD: Confluence resistance zone (0.618 Fib + historical supply).
3,435 – 3,453 USD: Previous swing high – key medium-term benchmark
Support:
3,294 – 3,317 USD: Immediate support, holding for now.
3,250 – 3,224 USD: Potential next target zone if bearish pressure resumes.
4. Trade Setup Scenarios.
Scenario 1 – Buy if support holds and bullish confirmation appears
Entry: 3,295 – 3,305 USD.
Stop-loss: Below 3,289 USD.
Take-profit: 3,340 – 3,355 – 3,370 USD.
Condition: Look for bullish reversal patterns (e.g., Bullish Engulfing, Pin Bar) on H1–H4.
Scenario 2 – Sell on rejection from resistance zone
Entry: 3,370 – 3,375 USD.
Stop-loss: Above 3,392 USD.
Take-profit: 3,330 – 3,310 – 3,290 USD.
Condition: Clear bearish rejection candlestick with diminishing volume
Note:
XAUUSD remains in a vulnerable state. The current move may be a technical rebound rather than a true reversal. Traders should watch closely how price behaves around the 3,373–3,392 USD zone in the coming sessions. A breakout could signal a new bullish leg, while another rejection would likely confirm a continuation of the bearish trend.
XAUUSD GOLD📈 GOLD (XAU/USD)
📊 Timeframes:
⏱️ 30-Min & 1-Hour
🟢 Long Trade Plan
🔍 Analysis Highlights:
✨ Bullish Divergence spotted
🚀 Breakout Trade
🎯 Trade Details:
🛑 SL: Marked on chart 🔴
✅ TP1: Mentioned on chart 🥇
🏁 TP2: Mentioned on chart 🥈
📌 Chart levels clearly labeled
📬 For any queries regarding chart: comment in message section
💡 Trade smart, manage risk! 📉📈
#Gold #XAUUSD #BreakoutTrade #LongSetup #BullishDivergence #TradingView #TradePlan

BTC continues to short at high levels during the day📰 Impact of news:
1. Geopolitical impact
📈 Market analysis:
BTC has reached an intraday high of 108,125, just one step away from the all-time high of 112,000. With the increase in trading volume and institutional sentiment turning bullish, the momentum seems to be in the bulls' favor. In addition to institutional buying, the ceasefire agreement in the Iran-Israel war is also an important factor in Bitcoin's sharp rebound. Trump's announcement of the end of the war almost immediately triggered a surge in the cryptocurrency market. However, the overall pattern has not changed, and the range resistance has not been broken, so we still keep the idea of shorting at high levels.
🏅 Trading strategies:
SELL 108000-107500
TP 104500-103500
If you agree with this view, or have a better idea, please leave a message in the comment area. I look forward to hearing different voices.

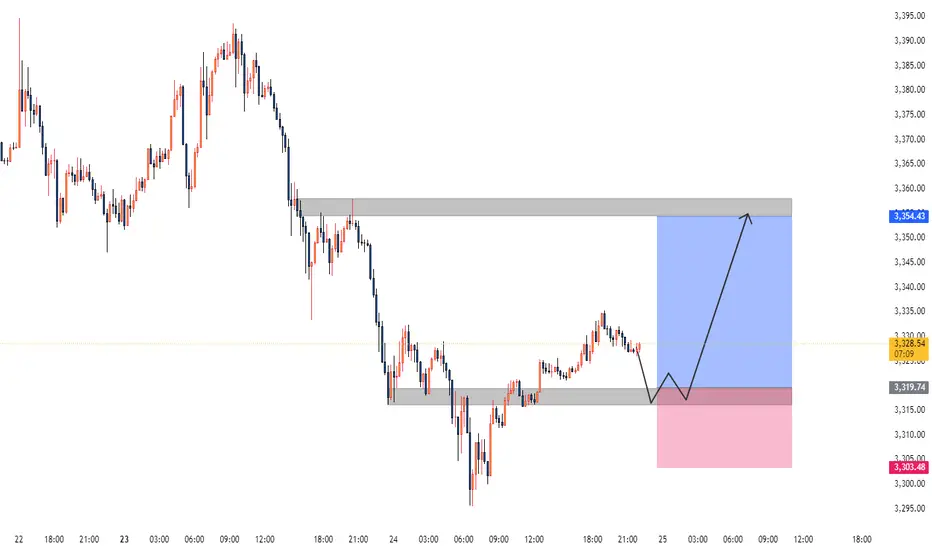
Gold XAUUSD Analysis 25.06.2025The Gold shows with a recent upward trend following a period of consolidation and a dip. Key observations:
The price previously fluctuated between a support level around 3,310-3,319 and a resistance near 3,354.
The current price is consolidating near the recent high, suggesting potential for further upward movement or a pullback.
Signal:
Buy signal is present in the range of 3,316-3,319, aligning with the support level, offering a good entry point for a potential upward move.
Suppression remains unchanged, the latest layout of gold📰 Impact of news:
1. Powell's testimony
2. Geopolitical impact
📈 Market analysis:
The short-term rebound of gold is the release of energy for the accumulated bulls. From the current market trend, 3340 above is the key point of the short-term watershed between bulls and bears. The short-term resistance above is around 3342-3348, and the short-term support below is around 33220-3315. If it falls below this, it will continue to look towards yesterday's low of 3290-3280. The daily level is under pressure and continues to see a decline and adjustment. If it touches 3340-3350 above, you can try to short. After it retreats to 3320-3315 and obtains effective support, you can consider going long.
🏅 Trading strategies:
SELL 3340-3350
TP 3330-3320-3315
BUY 3320-3315
TP 3330-3340-3350
If you agree with this view, or have a better idea, please leave a message in the comment area. I look forward to hearing different voices.
OANDA:XAUUSD FX:XAUUSD FOREXCOM:XAUUSD FXOPEN:XAUUSD TVC:GOLD

Bulls have made profits, gold layout in the evening📰 Impact of news:
1. Powell's testimony
2. Geopolitical impact
📈 Market analysis:
I have completed the long trade according to the previous trading strategy, and the long order has generated profit. In the short term, the overall trend of gold is still bearish. Only if it breaks through and stabilizes above 3350 can the bulls continue. If it rebounds to the 3330-3335 line and encounters resistance under pressure, you can consider shorting. If it rebounds to 3340-3350 but fails to stabilize, you can increase your short position. Pay attention to the support of 3320-3300 below. If it falls below 3300, it is expected to reach 3280
🏅 Trading strategies:
SELL 3330-3335-3340-3350
TP 3320-3310-3300-3280
If you agree with this view, or have a better idea, please leave a message in the comment area. I look forward to hearing different voices.
OANDA:XAUUSD FX:XAUUSD FOREXCOM:XAUUSD FXOPEN:XAUUSD TVC:GOLD

Gold Rebounds Slightly After Dropping to 3295📊 Market Update:
Gold bounced back to 3320 after dipping to 3295 amid USD strength and rising bond yields. The recovery was fueled by short-covering, but traders remain cautious ahead of upcoming U.S. PCE data – the Fed’s preferred inflation gauge.
📉 Technical Analysis:
• Key Resistance: 3330
• Nearest Support: 3295
• EMA: Price is hovering near the 09 EMA on the H1 chart → neutral to slightly bullish in short-term correction.
• Candle / Volume / Momentum: H1 candles show mild recovery with increased volume, but no clear reversal signal yet.
📌 Outlook:
Gold may range between 3295 and 3330 before a breakout, depending on incoming U.S. economic data. A break above 3330 could trigger a short-term rally.

Bearish direction remains unchanged, wait patiently
Since the sharp drop in gold last Monday (June 16), except for the correction of closing the cross positive line last Tuesday, the daily level has closed five consecutive negative lines since last Wednesday until now, fully demonstrating the weak characteristics of gold prices in recent trading.
From the technical indicators, the 5-day moving average and the 10-day moving average have formed a dead cross, which is an important signal of the weakening of the short-term market trend. The current gold price continues to run below these two moving averages, further verifying the current market situation where the shorts dominate. There is still no big fluctuation in the intraday, short positions are patiently waiting, and the operation still maintains our target of 3310-3305 unchanged.

GOLD/XAUUSD SellGold price is still bearish in the short term. The US dollar is currently being boosted. There are also geopolitical talks and indirect ceasefires. Therefore, the short-term risk aversion sentiment has declined. The gold price is now quoted at: 3323. We can focus on the lower target of 3300-3290.

Gold rebound is blocked, 3333 line is directly short
After the continuous rebound, the gold price also showed obvious stagflation near 3340. The intraday hourly line went out of a small double top, which can also be said to be a weak rebound. We also said at the opening that 3340 is a short-term key long-short conversion position. At present, the gold price is still under pressure below this, which means that the market is still short. Then the gold price began to fall. There is no problem with our thinking, and our internal strategy also started shorting directly at the 3333 line. The current position is making a profit.
The market is weak, there is no doubt about it. There are only two conditions that can change our thinking. One is that the gold price rises rapidly and sharply to stand at 3340, and the other is that the gold price bottoms out near 3300. However, before any of the conditions are met, the short position will continue.
Specific strategy
Gold 3333 short, stop loss 3343, target 3310

Pullback Before Bullish ContinuationGold is currently facing resistance near the mid-Keltner Channel zone. Based on current structure and momentum, we anticipate a two-phase move:
🔻 Phase 1 – Short-Term Pullback:
Price is likely to reject the current resistance and move lower into the demand zone around 3310–3315. This retracement aligns with a healthy correction within a larger structure.
🟢 Phase 2 – Bullish Reversal:
After the pullback, we expect a strong bullish continuation toward the 3370–3373 area. This level represents the next significant resistance and profit target for long positions.
📌 Key Zones to Watch:
Demand Support: 3310–3315
Bullish Target: 3370–3373
Stop-Loss for Longs: Below 3308

Gold May Dip Short-Term Amid Cautious Fed & Geopolitical Calm📊 Market Overview:
• Gold saw a slight correction as Middle East tensions eased following a ceasefire agreement between Iran and Israel.
• A weaker USD and lower U.S. Treasury yields offered some support to gold prices.
• However, the Fed’s cautious stance on rate cuts and upcoming testimony from Chair Powell continue to weigh on gold sentiment.
📉 Technical Analysis:
• Key Resistance Levels:
– $3,350–3,360 (21/50-day SMAs)
– $3,370–3,385 (Fibonacci zone and swing highs)
• Nearest Support Levels:
– $3,316–3,320 (intraday lows and psychological level)
– $3,300–3,305 (strong support), followed by $3,245–3,275 if broken
• EMA 09: Price is currently trading below the 09 EMA, indicating a short-term downtrend.
• Candlestick Pattern / Volume / Momentum:
– The 15-minute chart shows slight recovery signals, but with weak momentum; RSI is below average and MACD is slightly bearish.
– No strong reversal candlestick pattern detected; small-bodied candles (doji) suggest indecision and selling pressure remains near $3,340.
📌 Outlook:
Gold may decline slightly in the short term, potentially retesting the $3,316–3,320 support zone. A rebound is possible if the USD weakens further or the Fed unexpectedly signals rate cuts.
💡 Suggested Trading Plan:
🔻 SELL XAU/USD at: $3,335–3,340
🎯 TP: $3,330 - $3,325
❌ SL: $3,345
🔺 BUY XAU/USD at: $3,318 – 3,315
🎯 TP: $3,320 - $3,325
❌ SL: $3,312

GOLD H2 Intraday Chart Update For 25 June 25 Hello Traders, as you can see that market just try to broke 3300 psychological level yesterday but unfortunately that was not successful attempt
All eyes on 3337-3348 zone for the day if market successfully breaks that zone it will move towards 3365 Blind Structure Level else we might see 3305 level test soon on Intraday basis
Reminder: This is also FED Chair Powell 2nd of Testifies
Disclaimer: Forex is Risky

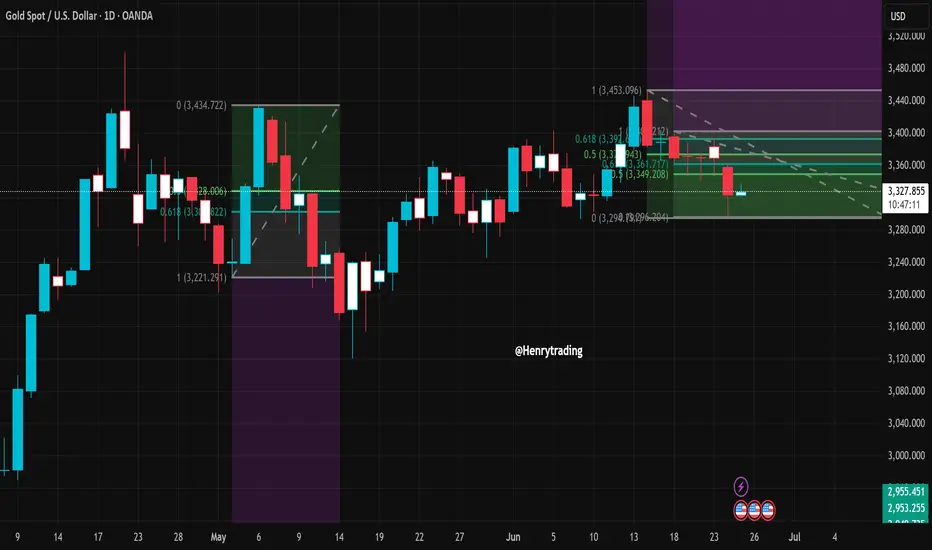
XAUUSD poised for a rebound?Gold (XAUUSD) is currently trading around the 3,327 level after breaking below a short-term ascending trendline that started in mid-May. While this break might suggest a potential bearish reversal, from a technical standpoint, it could simply be a corrective move within a larger bullish structure.
The current price pattern appears to be forming a classic ABC correction.
If the support zone around 3,320–3,325 holds, there’s a strong possibility that price will rebound toward the 3,400–3,480 region in the coming sessions.
This area is not only a technical support but also a previous demand zone where buyers stepped in aggressively. Close attention should be paid to any bullish price action signals here. A reversal candlestick or a volume spike could serve as confirmation for a rebound setup.
A potential trade idea is to consider a long position around 3,320–3,325, with a stop loss below 3,308.
First target is set at 3,400, and an extended target at 3,480 if bullish momentum continues. Conversely, if the price closes below 3,308 with strong volume, the bearish scenario will gain ground, potentially dragging price down to the 3,280–3,231 support area.
The setup remains open, and clear confirmation is needed. Patience is key—wait for solid signals before committing to a position.

GOLD XAUUSD TodayGOLD XAUUSD Today for me maybe finish down move
Next week I expect change direction to LoNG setups.
My target will be new high.

Gold Trading Analysis and Strategies for Sideways Decline MarketAfter Trump announced a comprehensive ceasefire agreement between Israel and Iran, market risk aversion significantly cooled, and gold prices plunged by more than $30 in early trading. Although the stability of the ceasefire agreement remains doubtful, the rebound in risk appetite has dominated market trends, with stock markets rebounding, oil prices falling, and demand for safe-haven assets declining.
From a technical perspective, the moving average system on the daily chart of gold shows an intertwined state, indicating a relative balance between bulls and bears. The current key resistance above is near 3350, which is an important psychological threshold. If effectively broken, it may open up upward space; the lower support is focused on the 3285-3290 range, which is the lower edge of the May consolidation platform. A break below this level may intensify correction pressure. The loss of the midline in the 4-hour chart further confirms the short-term weak structure, providing technical support for the downward trend.
XAUUSD
sell@3330-3340
tp:3320-3310
buy@3285-3290
tp:3310-3320
Investment itself is not the source of risk; it is only when investment behavior escapes rational control that risks lie in wait. In the trading process, always bear in mind that restraining impulsiveness is the primary criterion for success. I share trading signals daily, and all signals have been accurate without error for a full month. Regardless of your past profits or losses, with my assistance, you have the hope to achieve a breakthrough in your investment.
