Gold’s Geopolitical Launchpad: Eyes on $3,500+🟡 GOLD - Macro Fuel Meets Technical Momentum Trade Levels Inside
Gold continues to flex its haven status as geopolitical tensions flare once again—this time triggered by reports of a U.S. airstrike on Iranian nuclear facilities. That headline risk has lit the fuse under precious metals, and the reaction in futures markets has been swift.
Friday’s intraday washout—largely driven by hopes that President Trump would opt for diplomacy—was short-lived. The strong recovery into New York close left a long lower shadow, signaling buyers are already pricing in weekend escalation risk.
💡 Macro View:
- Analysts project a move toward $3,500–$3,700, driven by a twin-engine of geopolitical instability and sticky inflation.
- Central banks are staying long; ETF inflows are ticking up—this isn’t just speculative hype.
- Goldman’s base case: $3,700 EOY, $4,000 by mid-2026. Recession/volatility scenarios stretch targets up to $4,500.
🔧 Technical Setup:
- Bias across all time frames remains bullish. Open float pressure is stacking with long-side conviction.
- Key long trigger zone sits between $3,369–$3,375—I’m watching for confirmation here.
- Profit targets:
- First resistance: $3,440.48
- Second target: $3,500 zone
- Stretch: $3,520+ if volatility expands
Goldlong
Gold remains weak and is expected to fall below 3,300
Gold fell today due to the news of a comprehensive ceasefire in the Iran-Israel conflict. In addition, as Fed officials claimed that there was no need to cut interest rates at present, expectations of interest rate cuts fell, the dollar strengthened, and gold was under pressure. In the short term, it may continue to fall and further test 3291 to 3285. Therefore, today we should continue to operate short, pay attention to 3336-38 to suppress shorts, defend 3346, and look at 3300/3285 support.
Gold short-term trading: short near 3336, stop loss 3346, take profit 3300

Buy gold, there may be a rebound in the short termAt present, gold has touched the area of 3325-3315 mentioned in my previous article, and the lowest price is around 3316. At present, due to the current important support area of 3310-3300 below, gold still has a rebound demand in the short term; although gold has not rebounded sharply at present, the downward momentum has indeed slowed down, and gold may rebound after the short force is consumed. Moreover, the ceasefire between Iran and Israel has not yet been settled. Moreover, the ceasefire between Iran and Israel has not yet been settled. With the fluctuating situation in the Middle East, bulls may have opportunities to counterattack.
However, the current performance of gold is indeed relatively weak, so there is no need to expect gold to rebound and fill the upper gap area of 3360-3370 in the short term; in trading, the rebound expectation can be appropriately lowered, and long positions can continue to be held and look up to the 3340-3350 area.

GoldKey Data Points:
Current Price: 3,309.065 USD
Open: 3,358.435 USD
High: 3,363.900 USD
Low: 3,307.295 USD
Change: +1.77% (+59,760 points)
Volume: Not explicitly stated but implied by "1B" (likely 1 billion units).
Price Action & Technical Observations:
Trend:
The price is currently below the open (3,309.065 vs. 3,358.435), suggesting a pullback after an intraday high of 3,363.900.
The +1.77% daily gain indicates overall bullish momentum, but the candle shows rejection near highs (wick formation).
Support/Resistance Levels:
Resistance:
Immediate: 3,362–3,375 USD (previous highs/profit targets).
Strong: 3,406–3,425 USD (key profit levels).
Support:
Immediate: 3,288–3,265 USD (labeled "Entity" and "Profit" zones).
Strong: 3,250 USD (psychological level).
Profit Targets:
The chart marks three profit-taking levels:
3,323 USD (minor), 3,362 USD (mid), 3,406 USD (major).
This suggests traders are eyeing these levels for potential reversals or take-profit actions.
Volume & Momentum:
The "+59,760" change with "1B" volume implies strong buying interest, but the long upper wick hints at selling pressure near highs.
Potential Scenarios:
Bullish Continuation:
If price holds above 3,288–3,265 USD, a retest of 3,362–3,406 USD is likely.
Bearish Reversal:
A break below 3,265 USD could trigger a drop toward 3,250–3,225 USD.

XAU/USD) Bullish reversal analysis Read The captionSMC trading point update
Technical analysis of Gold (XAU/USD) on the 30-minute timeframe, based on technical signals and price action behavior. Here's the breakdown
---
Gold Bullish Reversal Setup – Targeting 3,384
---
Key Technical Highlights:
1. Support Zone & Price Reaction:
Price has tested a strong horizontal support level (highlighted in yellow).
Multiple bullish rejection wicks indicate buying pressure at this zone.
The green arrows show successful support bounces, hinting at bullish intent.
2. Trendline Analysis:
Price bounced near the lower boundary of the falling wedge/downtrend channel.
An uptrend line convergence supports potential reversal.
A breakout above the short-term descending trendline is indicated.
3. EMA & Target Projection:
EMA 200 at 3,364.33 may act as dynamic resistance, the next short-term hurdle.
Target zone projected at 3,384.04, offering a potential move of +65.67 pts (~1.98%).
4. RSI Indicator:
RSI(14) is oversold (~29.93), signaling a potential reversal.
A bullish crossover may be forming, supporting upward momentum.
---
Trading Plan:
Entry Zone: Near current support area around 3,325
Target: 3,384
Stop Loss (Suggested): Below 3,300, under support structure
Risk/Reward: Favorable based on support hold and breakout projection
Mr SMC Trading point
---
Conclusion:
This setup suggests a short-term bullish reversal from a key support area, with confirmation likely if price breaks above the descending trendline and clears the 200 EMA.
Please support boost 🚀 this analysis)

Gold updateAfter the previous level was broken and structure shifted, we’re now entering a new phase of analysis.
In this fresh setup, we’re looking for buy opportunities — but not blindly!
As always, waiting for a clean pullback to the new zone and a solid entry signal.
Experience teaches us: real profits come from patience and planning.
Here’s my new gold analysis — high probability, low risk.
For detailed entry points, trade management, and high-probability setups, follow the channel:
ForexCSP

Weakness continues, continue to short the bear market📰 Impact of news:
1. Pay attention to Powell's speech in New York
2. Pay attention to geopolitical influence
📈 Market analysis:
Gold opened lower and showed a weak situation. The 1H moving average was arranged downward. In the short term, bears still occupied the main trend. From the 4-hour analysis of gold, the bulls still had repeated resistance before breaking down. Once it breaks down, the market will go further bearish. Pay attention to 3330 below. 3400 is still the key above in the short term. Only by breaking through the bulls can the rebound continue. In terms of operation, high-altitude and low-long are temporarily maintained. Pay attention to the short-term resistance of 3355-3365 above, and the support of 3340-3330 below. Pay attention to the breakthrough! Pay attention to Powell's speech in the New York session.
🏅 Trading strategies:
SELL 3370-3365-3355
TP 3340-3330
BUY 3340-3335-3320
TP 3345-3355-3365
If you agree with this view, or have a better idea, please leave a message in the comment area. I look forward to hearing different voices.
TVC:GOLD FXOPEN:XAUUSD FOREXCOM:XAUUSD FX:XAUUSD OANDA:XAUUSD

Gold is under pressure and continues to focus on weekly support
The Israeli-Iranian conflict that broke out on June 13th lasted for 12 days before a ceasefire agreement was reached. Iran retaliated against the US military base but did not block energy transportation. Trump called its response weak, and market concerns cooled. Gold and oil prices gave up their gains. Spot gold closed at $3,368.98 per ounce, close to flat. U.S. crude oil fell 9% from a 5% increase. Trump announced on Tuesday that Israel and Iran had reached a ceasefire agreement. After mediation by Qatar, Iran agreed, and Israel also hoped to end the conflict within a few days.
Gold fell as the situation eased and the demand for safe-haven assets weakened. Oil prices fell more due to the lack of risk in the Strait of Hormuz, and U.S. stock index futures rose. Federal Reserve Vice Chairman Bowman unexpectedly said that interest rates may be cut in July. U.S. Treasury yields fell and the U.S. dollar index fell, but did not support gold prices. The U.S. economy is facing inflation and growth slowdown pressure. If the situation in the Middle East worsens, oil prices may soar, exacerbating the risk of stagflation. Short-term ceasefires and differences with the Federal Reserve suppress gold prices. Medium- and long-term geopolitical risks and expectations of interest rate cuts support gold. Investors can pay attention to relevant developments and diversify their allocations.
In terms of gold, the overall price of gold fell on Monday. The highest price rose to 3396.68 on the day, and the lowest price fell to 3346.92, closing at 3368.94. On Monday, gold jumped higher in the early trading, and then came under pressure again. It continued to rise after the European and US trading to test the opening high. The price fell very weakly overnight, and finally ended with a big negative. At present, gold is still in a volatile decline.
From a multi-cycle analysis, first observe the monthly rhythm. The price ran according to the rhythm in May as the author said, and finally in a cross state. For June, focus on the gains and losses of the highs and lows in May. The price will only be a real break if it really closes above this position. The long-term watershed is at 2780. From a weekly level, the gold price is supported by the 3280 regional support level. From a mid-term perspective, we are still in a mid-term bullish position, but we need to pay attention to the market's retracement to the weekly support. At the same time, the price will be further under pressure only if it breaks the weekly support. From the daily level, the price breaks the 3365 daily watershed. The overall follow-up still focuses on the pressure performance, and the focus below is on the retracement to the weekly support. At the same time, according to the four-hour level, we need to pay attention to the 3360 position temporarily. Since gold is currently in a volatile decline, it will continue to be short before breaking 3405. In the short term, we will first focus on the four-hour and daily resistance pressure, and focus on the 3320 and 3280 area support below.
Gold 3360 and 3365 range is under pressure, and the target is 3320-3280

GOLD Intraday Chart Update For 24 June 2025Hello Traders, As you can see that GOLD fell sharply this morning due to Israel- Iran Cease fire scenario
Further more FED Chair POWELL Testifies Starts from Today and end on Tomorrow make sure to manage you trading accordingly
Right now GOLD is in Strong Bearish Trend only clear Breakout of 3368 level for the day below this market remains Bearish
All eyes on 3300 Psychological Digit for now if market breaks 3300 Successfully then it will move towards 3250 soon
Disclaimer: Forex is Risky

Gold, Will USA-Iran-Israel conflict affect it? The USA-Iran-Israel conflict can significantly impact gold prices. Gold is a safe-haven asset, so demand often rises during geopolitical tensions, pushing prices up
3406 gonna be first target for me, if it breaks this lvl with huge volume and FVG on 1h+ then most likely we will see ATH in near future
bearish scenario(lest likely) - price breaks down 3340 and close with nice volume and fvg on 1h+ which will open move all the way down to MO

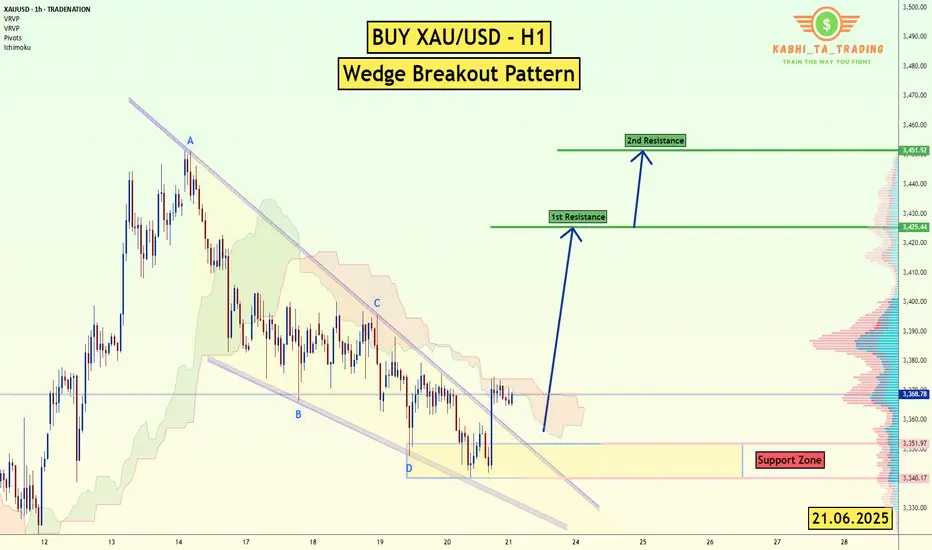
XAU/USD (Gold) - H1 - Wedge Breakout (21.06.2025)The XAU/USD pair on the H1 timeframe presents a Potential Buying Opportunity due to a recent Formation of a Wedge Breakout Pattern. This suggests a shift in momentum towards the upside and a higher likelihood of further advances in the coming Days.
Possible Long Trade:
Entry: Consider Entering A Long Position around Trendline Of The Pattern.
Target Levels:
1st Resistance – 3425
2nd Resistance – 3451
🎁 Please hit the like button and
🎁 Leave a comment to support for My Post !
Your likes and comments are incredibly motivating and will encourage me to share more analysis with you.
Best Regards, KABHI_TA_TRADING
Thank you.
Disclosure: I am part of Trade Nation's Influencer program and receive a monthly fee for using their TradingView charts in my analysis.
Gold Trading Strategy June 23The last two D1 candles have continuously drawn out the wicks. The Sellers may no longer be interested in dominating the market.
Currently, Gold is moving sideways in a wide range. 3345 and 3375 are the two Breakout zones of the gold price in today's trading day. When breaking out of the breakout zone, the price will continue its strong trend. Limit trading against the trend when the price breaks out.
Trading signals may also appear if there is confirmation from the candle that does not break out of this breakout zone.
Resistance and support zones remain the same as last week.
Resistance 3400-3415-3443
Support 3322-3296
Break out: 3375-3345
Recommended good trading signals
SELL 3399-3401 Stoploss 3405
BUY 3322-3320 Stoploss 3306

Gold bottoms out and tests resistance, long positions at night📰 Impact of news:
1. Bowman hinted at a July rate cut
2. Fed Governor Kugler and FOMC permanent voting member and New York Fed President Williams hosted the "Fed Listening" event.
📈 Market analysis:
Gold will maintain a short-term volatile trend. Although the United States intervenes in the conflict between Iran and Israel, the geopolitical situation will affect the market trend to a certain extent. However, the remarks of Federal Reserve Board member Bowman hinting at a rate cut in July have eased market volatility to a certain extent. Gold maintains a narrow range of fluctuations at the 4H level, and the technical pattern is gradually adjusted. The K-line stands firmly on the short-term moving average. The short-term trend shows that it is necessary to observe the second opportunity for pull-up after the confirmation of the retracement. At the hourly level, the short-term moving average diverges upward, and the short-term volatile and strong pattern is maintained. In the evening, pay attention to the upper resistance area of 3395-3405, focus on the suppression of the 3405 line, pay attention to 3375-3365 below, and further pay attention to the 3345 support line if it breaks through.
🏅 Trading strategies:
SELL 3385-3395-3405
TP 3370-3365-3345
BUY 3375-3365-3355
TP 3390-3400-3405
If you agree with this view, or have a better idea, please leave a message in the comment area. I look forward to hearing different voices.
TVC:GOLD FXOPEN:XAUUSD FOREXCOM:XAUUSD FX:XAUUSD OANDA:XAUUSD

XAU/USD Double Bottom Breakout Bullish Momentum Incoming!XAU/USD Double Bottom Breakout 💥 | 🚀 Bullish Momentum Incoming!
Analysis:
🟡 Double Bottom Pattern: Two clear lows have formed around the $3,340 support, signaling a potential reversal.
🟦 Accumulation Zone: The price consolidated in a range, indicating strong buying interest before the breakout.
🟣 Bullish Momentum: Recent aggressive bullish candles show strong buying pressure.
📈 Breakout & Retest Zone: If the price holds above $3,370, a bullish continuation toward $3,409 and possibly $3,445 is expected.
🧭 Target Area: Marked with a blue box, the upside potential is clearly projected.
Conclusion:
A successful retest of the breakout level may lead to a strong bullish run. Keep an eye on $3,370 as the pivot zone. 🎯

Conflict breaks out, risk aversion rises, can 3400 be broken?Bowman's dovish comments in the afternoon eased the market, by which time risk aversion was deepening as sudden geopolitical conflicts continued to deepen. Will the USA make a corresponding response to this matter? This series of events has once again put gold into a complicated situation. Can gold hit the 3,400 mark today?
Free trading strategies are updated daily🌐. All trading strategies released since this month have been verified and can serve as a good reference📈.👇 I sincerely hope that these strategies can be helpful to you👇.
OANDA:XAUUSD FX:XAUUSD FOREXCOM:XAUUSD FXOPEN:XAUUSD TVC:GOLD

PAXGUSDT 4H levels 6/23/25Not much change on the 4H levels from the previous week. There were a few nice spikes that profit could have been taken from. Liquidity was swept and price dropped down to one of the marked levels. I'm looking for price to hit those levels once again.

GOLD - AnalysisHello Traders,
Gold is still consolidating in this range 3350 to 3390. Long term we're targeting 3450 buys.
Currently in buys from 3362.
Trade with care. Note that this is not a trading call.
Thanks

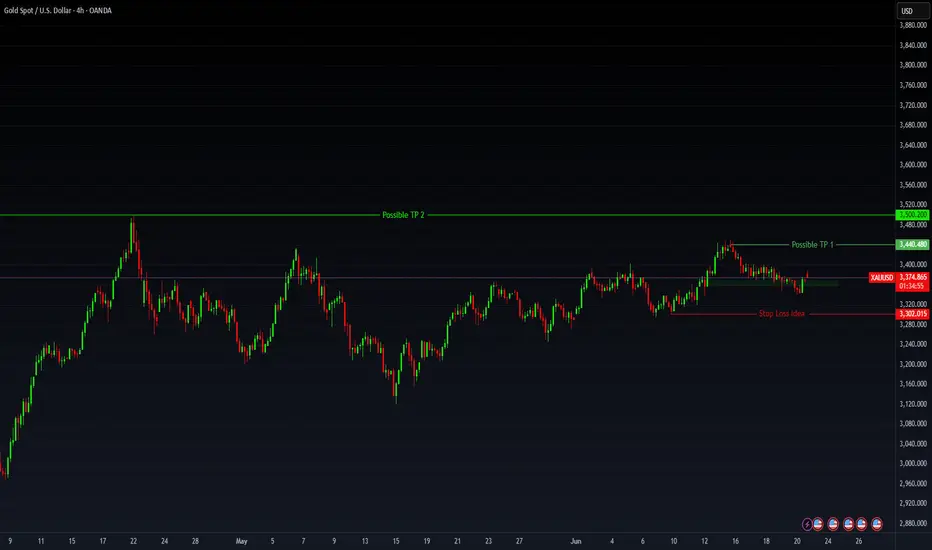
Gold XAU/USD Bullish Reversal Setup – Targeting $3,454.65Price: $3,384.41
Strategy: Buy/Long
🟦 Key Levels:
Entry Zone: Around $3,345.76
This level aligns with a previously tested support zone marked in purple.
Stop Loss: $3,331.56
Below the support zone, providing downside protection if the setup fails.
Target (TP): $3,454.65
Marked as EA TARGET POINT, suggesting a potential upside of 3.16% (~$105.83 gain).
📊 Technical Indicators:
Moving Averages:
200 EMA (blue): Near the entry level, adds strength to the support zone.
50 EMA (red): Recently crossed below price, indicating early bullish momentum.
Price Action:
Sharp bounce from support suggests buying interest.
Potential inverse head and shoulders pattern forming, which is a bullish reversal pattern.
🧠 Trade Idea:
Buy near $3,345.76,
Stop Loss at $3,331.56,
Take Profit at $3,454.65
Risk/Reward Ratio ≈ 1:3.3 — favorable setup for long positions.

Gold price PMI positive, slight increase⭐️GOLDEN INFORMATION:
Gold prices (XAU/USD) edge higher toward $3,375 in early Asian trading on Monday, driven by heightened geopolitical tensions following US President Donald Trump’s decision to intervene militarily in the Israel-Iran conflict. The move significantly escalates the situation in the Middle East, fueling demand for safe-haven assets like gold.
The US launched airstrikes on three Iranian nuclear facilities early Sunday, marking a direct entry into the conflict despite Trump’s prior pledges to avoid new overseas wars. The intensifying turmoil has sparked a wave of risk aversion, supporting bullion prices amid rising uncertainty. Meanwhile, investors will closely monitor the preliminary S&P Global US Purchasing Managers’ Index (PMI) for June, due later in the day, for further market direction.
⭐️Personal comments NOVA:
Gold prices continue to be supported around the 3340 mark, positive with today's US PMI news data
⭐️SET UP GOLD PRICE:
🔥SELL GOLD zone: 3380- 3382 SL 3387
TP1: $3370
TP2: $3360
TP3: $3350
🔥BUY GOLD zone: $3318-$3316 SL $3311
TP1: $3326
TP2: $3338
TP3: $3349
⭐️Technical analysis:
Based on technical indicators EMA 34, EMA89 and support resistance areas to set up a reasonable BUY order.
⭐️NOTE:
Note: Nova wishes traders to manage their capital well
- take the number of lots that match your capital
- Takeprofit equal to 4-6% of capital account
- Stoplose equal to 2-3% of capital account

Insist on bullish trend and wait for upward trend
Today's market analysis and interpretation:
First, gold weekly level: Last week, it closed negative, and continued to follow the yin-yang cycle. This week, it is likely to close positive again, and rely on the short-term 5-day and 10-day gradual shocks and strength; the medium-term trend continues to be bullish, and the nine-week wide consolidation is about to end. In fact, the big positive K last week has ended the shock and is ready to move upward. However, under the gradual warming of the geopolitical situation last week, it fell back and closed negative. It is indeed unexpected. It belongs to the control period. The risk aversion will always come. Wait patiently
Second, gold daily level: It closed with a long lower shadow cross K for two consecutive days. The lower track of the rising channel has always been effective support, including today, and it was only pierced, and it is still bottoming out and pulling up; the key point is When the closing price effectively stands on the 5-day moving average, then we should continue to attack upward to test the upper track of the channel, although the time cycle will basically approach 3490-3500;
Third, the gold 4-hour level: opened high to 3396, then fell back with a big negative, and did not stand on the middle track. At this time, the European session bottomed out and pulled up, breaking through the middle track again. Once the closing at 22:00 is confirmed to be above the middle track, accompanied by the golden cross below the zero axis of macd, this cycle will begin to gradually strengthen;
Fourth, the gold hourly level: the geopolitical situation is still fierce over the weekend and continues to heat up. Today's opening jumped high to 3396, then fell all the way back to 3347, and then stabilized and attacked to 3380. The overall situation is still discontinuous shock and the washing force is getting stronger each time, which shows that the competition between bulls and bears is becoming more and more intense, and they have been fighting for the gains and losses of the lower track of the daily channel; from the channel distribution, the key pressure is 3390. As long as it breaks through and stabilizes, it will be difficult to have a large-scale decline and wash; on the contrary, before 3390 breaks through and stands above, there is no need to rush to chase the rise for the time being. Pay attention to the support of 3360-65 and 3355-50. Continue to be bullish on dips and insist on pulling down and bullish. It is only a matter of time before 3390 breaks through or even stands above 3400, and this time is expected to be very near; because during the European session, the US dollar and gold continued to rise simultaneously, and gold performed quite resistant to declines, unlike last week, when it was suppressed immediately after a short sharp pull. This shows that gold's safe-haven properties are gradually recovering and returning.

Gold opens high and moves lower, focus on 3340 support📰 Impact of news:
1. Federal Reserve Board member Bowman speaks on monetary policy and the banking industry
2. The United States intervenes in the Iran-Israel conflict and pays attention to the geopolitical situation
📈 Market analysis:
In the early Asian session, gold prices surged but failed to break through the key watershed of 3405. The current risk aversion conflict failed to break through the key resistance level, so the short-term trend is still weak and bearish. On the hourly chart, gold continues to retreat. As the current short-selling momentum continues to gain momentum, we will first look at whether the double bottom support of 3340 is effective. If it fails to break through while retreating, we can consider a short-term upward rebound in the support and consider going long. Looking at the second decline point at 3370-3375, unless the news stimulates the gold trend, you can still consider placing short orders if it touches the 3370-3380 line! On the whole, pay attention to the resistance line of 3370-3380 above and the support line of 3345-3335 below.
🏅 Trading strategies:
BUY 3350-3345-3335
TP 3360-3370-3380
SELL 3370-3380
TP 3360-3350-3345
If you agree with this view, or have a better idea, please leave a message in the comment area. I look forward to hearing different voices.
OANDA:XAUUSD FX:XAUUSD FOREXCOM:XAUUSD FXOPEN:XAUUSD TVC:GOLD

Gold Market Analysis and Trading Recommendations for TodayLast Friday, the overall gold price on the technical side continued to be under pressure, retracing and oscillating in adjustment. Eventually, it stabilized at the 3340 level before the close, rebounding and oscillating to close. The daily K-line reported an oscillating digital K. The overall gold price continued the recent suppressed oscillating consolidation.
However, over the weekend, the US military attacked Iranian nuclear facilities, intensifying geopolitical tensions in the Middle East, and market risk-aversion sentiment heated up. This morning, the gold price gapped up, piercing the 3390 level, reaching a high of around 3398 before retracing and falling into oscillation.
In the short term, it is highly probable that the gold price will continue to operate in a wide-ranging oscillating interval between long and short positions, continuing to trade time for space. Although the gold price opened high and moved low, it still has not broken the long-term trend channel. Looking for opportunities to go long on retracement is also the current trend.
From the current market trend, today's technical support on the downside focuses on around 3350 - 3345, and the short-term resistance on the upside is around 3380 - 3385, with a key focus on the 3395 - 3405 level. For the day, first, rely on this interval to maintain the main tone of participating in the long - short cycle. For positions in the middle range, always observe more and trade less, and be cautious about chasing trades. Patiently wait for key points to enter the market.
XAUUSD
buy@3345-3355
tp:3370-3390-3410
Investment itself is not the source of risk; it is only when investment behavior escapes rational control that risks lie in wait. In the trading process, always bear in mind that restraining impulsiveness is the primary criterion for success. I share trading signals daily, and all signals have been accurate without error for a full month. Regardless of your past profits or losses, with my assistance, you have the hope to achieve a breakthrough in your investment.

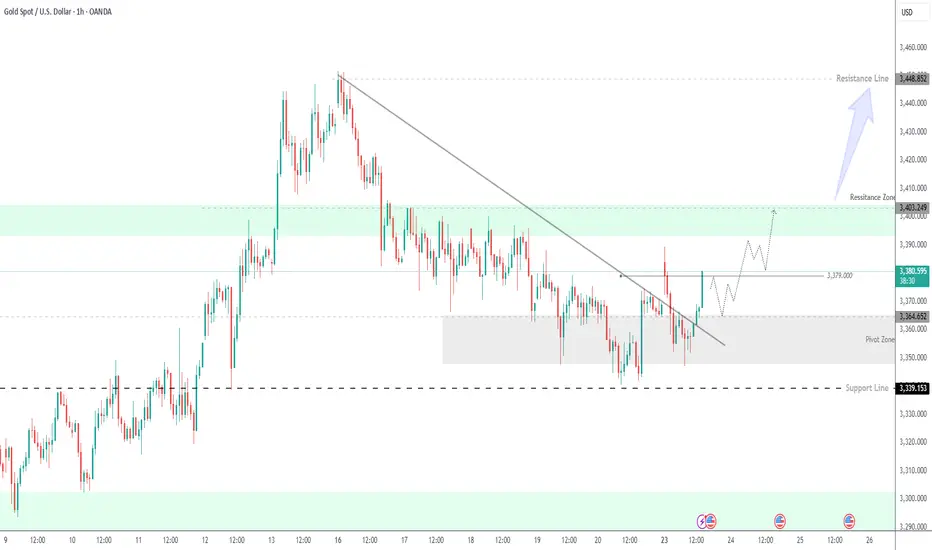
GOLD Outlook: Bullish Above 3379, Correction Likely BelowGOLD – Technical Overview
Gold maintains bullish momentum, driven by heightened geopolitical tensions in the Middle East, which are increasing safe-haven demand.
The price is approaching the pivot level at 3379. A confirmed 1-hour close above this level would likely extend the bullish trend toward 3393 and 3404.
However, if the price remains below 3379, we may see a short-term bearish correction toward 3364, potentially dipping as low as 3339 before resuming the upward trend.
Key Levels
• Pivot: 3379
• Resistance: 3393, 3404
• Support: 3364, 3339