Analysis and layout of gold trend in the US market📰 Impact of news:
1. Initial jobless claims data is positive
2. The White House is tough on the court ruling: Trump will win! Three trade agreements are close to being reached
📈 Market analysis:
I think the current rebound should not be directly judged as a unilateral trend. From a technical point of view, in the 4H cycle, the upper 3320-3325 line has a certain suppression force in the short term. If the gold price runs below 3325, we need to be alert to the risk of a high rebound. We can try to arrange short orders based on the 3320-3325 range, and bet on the high selling opportunities in the volatile market. Independent trading with a good stop loss. However, it should be noted that if the price quickly breaks through the 3330 line in the short term and stands above it, it is expected to rise to the 3340-3350 area. At the same time, I think the support below can first look at the 3300 line, with a focus on the 3290-3285 line support.
🏅 Trading strategies:
SELL 3320-3325
TP 3310-3300
BUY 3295-3285
TP 3300-3310-3320
If you agree with this view, or have a better idea, please leave a message in the comment area. I look forward to hearing different voices.
Goldlong

The golden range strategy continues to workGold bottomed out and rebounded as expected today. Friends who follow me should be able to clearly feel that I have been insisting on analyzing the trend of "bottoming out and rebounding" recently. Today, gold opened at 3300, and rebounded after the lowest price fell to around 3291. So far, the highest price has reached 3325. Overall, the support below gold is still strong, but the suppression above cannot be ignored. Therefore, the market performance yesterday and today was relatively stable, with small fluctuations as the main trend.
In terms of operation ideas, continue to pay attention to the support level of 3290-3295. If it falls back and does not break, maintain a bullish mindset. At present, the long orders in the 3290-3295 range have been notified to enter the market as planned, and are currently in the profit stage. If you encounter difficulties in the current gold market operation, I hope my analysis can help you. Welcome to communicate at any time.
From the 4-hour cycle chart, the support below gold is around 3290-3295, and the pressure above is concentrated in the 3330-3340 range. In the short term, the watershed between long and short is around 3275-3283. Before the daily level effectively falls below the watershed, it is still in a long-short shock pattern, maintaining the main theme of "high-altitude and low-multiple" cycle participation.
Gold operation strategy: If gold falls back to the 3290-3295 line, you can try to go long. If it further falls back to the 3280-3285 line, you can consider covering long orders, and the target is around 3316-3320.

Gold shocks extreme pull, US market layout🗞News side:
1. Musk issued the "strongest" condemnation of Trump
2. Trump and Netanyahu failed to reach an agreement, and the US-Iran negotiations may be "disrupted" by Israel
📈Technical aspects:
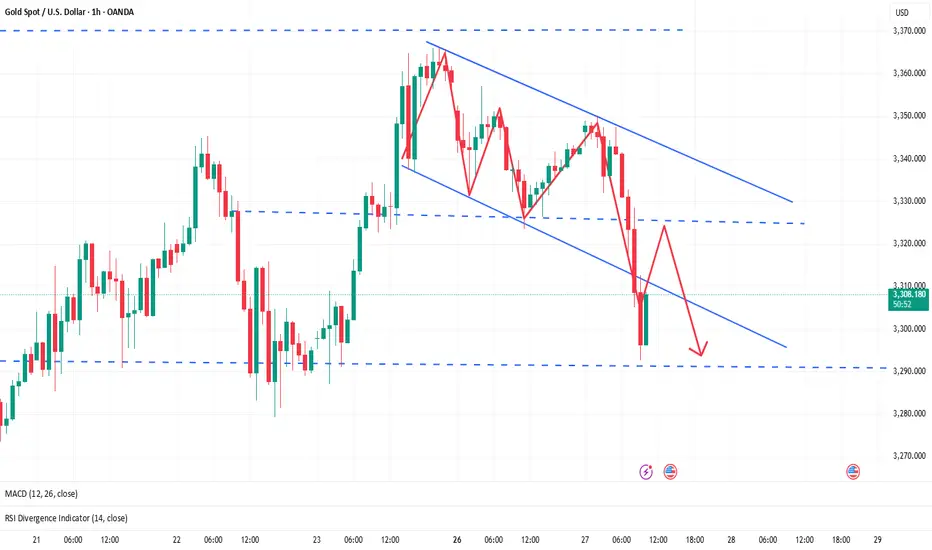
The trading strategy we have given is still valid. The current gold price trend on the hourly chart shows a standard descending flag pattern. If this pattern continues to be effective, there is a high possibility that the gold price will fall below 3285-3280. Once it falls below this range, as we gave in the strategy this morning, it may fall to the 3260-3250 line. However, the premise for this expectation to be established is that the gold price cannot break through and stabilize on the upper track of the consolidation channel, otherwise the descending flag pattern will be invalid. Therefore, for US market operations, short positions can be arranged around the upper rail of 3325, paying attention to the suppression effect; for the lower rail, first pay attention to the support effect of 3300.
sell 3325-3330
TP 3310-3300
buy 3290-3280
TP 3310-3320
If you agree with this view, or have a better idea, please leave a message in the comment area. I look forward to hearing different voices.
FOREXCOM:XAUUSD FXOPEN:XAUUSD TVC:GOLD FX:XAUUSD OANDA:XAUUSD

Gold ABC Pattern Suggest Powerful BreakoutGOLD ANALYSIS 🟡 | Bullish Setup Building
Price is retracing after completing a corrective wave structure (A–B–C) under major descending trendline resistance. We're now sitting just above the 200 EMA and entering key demand zones aligned with ascending trendline support.
🔹 Confluences:
Trendline support + demand zone
200 EMA holding as dynamic support
Corrective structure complete (Wave C)
Higher timeframe bullish structure intact
📌 Buy Zones: $3,220 – $3,180
🎯 Target: Retest of $3,434
🛑 Invalidation: Clean break below $3,160
Price is setting up for a potential bullish continuation — watching for bullish confirmation from these demand zones. Patience is key.

Gold trading zones: 29-May-2025Good morning! Find today's Gold trading zones and enhance your market analysis.

Trade Idea:XAUUSD Short ( SELL LIMIT )📉 Multi-Timeframe Breakdown
🔹 H4 Chart (Macro Bias)
• Trend Context: Price is still broadly in an uptrend on the H4, but it’s testing the 50 SMA from above.
• MACD: Bearish crossover below the signal line suggests waning bullish momentum.
• Volume: Slight uptick in bearish volume as price pulls back from the recent highs.
• Bias: Neutral to Bearish Short-Term (H4 trend remains up, but weakening).
🔹 M15 Chart (Setup Zone)
• Structure: A sharp selloff broke both the 20 SMA and 50 SMA.
• Momentum: RSI ~16, oversold—but that can persist in strong trends.
• Volume: Large spike on the breakdown candle = strong bearish interest.
• ATR: 7.97 = elevated volatility.
• Bias: Bearish momentum, potential pullback retest opportunity.
🔹 M3 Chart (Execution Focus)
• Price Action: Freefall with clean rejections at the 20 SMA.
• Volume Spike: Bears in control, RSI also confirms momentum exhaustion but no reversal confirmation yet.
• Bias: Bearish with potential for bounce/pullback retest entry.
⸻
✅ Primary Trade Setup
Type: 🟥 Sell Limit
Rationale: Let price retrace into resistance before fading it, using structure for confirmation.
Entry Zone: 3270–3276 area (prior support becomes resistance near 20 SMA on M15 and 50 SMA on M3).
Stop Loss: Above structure high → 3283
Take Profit: Next key support zone ~3245–3250 (measured move + demand zone on M15/M3).
📌 Sell Limit Order
• Sell Limit @ 3273
• SL @ 3283
• TP @ 3248
FUSIONMARKETS:XAUUSD

GOLD - LET CLIMB THE MOUNTAIN OF GOLDTeam, I was being patience for a week, did couple of long position, then short then long.
But this time I wait and wait until it reach my entry range price
GOLD is good to entry NOW
target 1 at 3272-3276
Target 2 at 3283-3306
STOP LOSS at 3232 - Once it hit our first target - bring stop loss to BE
i expect the GOLD will likely recover a little during TOKYO, but definitely fly back during UK market opening..
so therefore you need to be patience on this.. as the TRENDING still down trend.

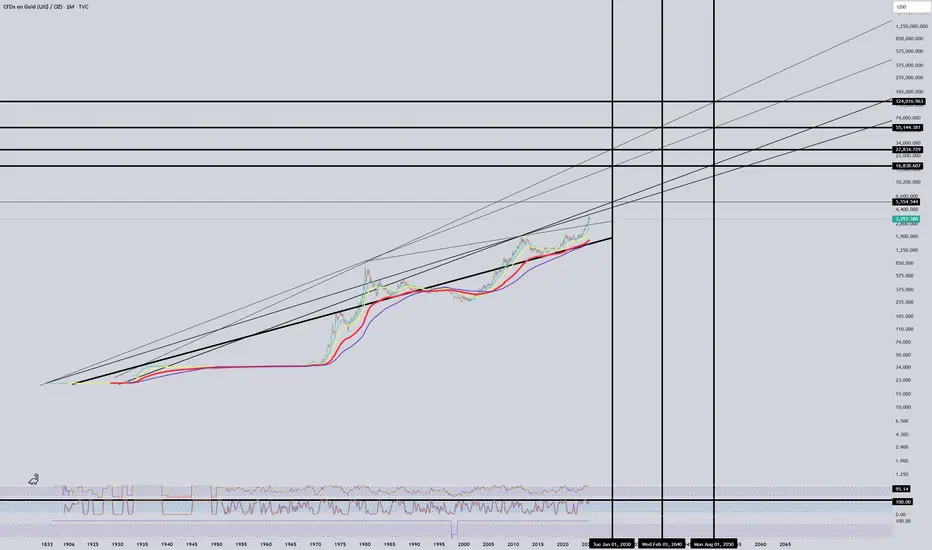
A break above $5500 would be huge. If this breaks above $5500 by 2030, the sky is the limit. Lots of key horizontal lines to reach above!
Gold fluctuates repeatedly, and the opportunity has come
Gold hit 3325 in the European session, and fell under pressure in the US session. It can be seen that the market still has no continuity, and the recent volatility is narrowing compared to the previous period. The whole month of May was a wide range of roller coaster fluctuations.
The oscillating market is to operate at the point of card. Wait for a one-sided trend and then follow the trend. Short-term US market rebounds to 3315 to short, and use the intraday high as defense. The 1H cycle support below 3280/3290 is long in batches, and other positions are not involved.

Is Gold’s Momentum Strong Enough to Break $3,400?📊 Market Overview:
Gold prices retreated slightly as stronger-than-expected U.S. consumer confidence data boosted expectations that the Federal Reserve may keep interest rates elevated for an extended period. This lent strength to the U.S. dollar, weighing on gold. Meanwhile, a more stable geopolitical tone—particularly in U.S.-EU trade discussions—has reduced safe-haven flows into gold.
📉 Technical Analysis:
• Key Resistance: $3,345 – $3,355
• Nearest Support: $3,270 – $3,280
📌 Outlook:
Gold may remain under pressure in the short term if the U.S. dollar stays firm and the Fed’s hawkish stance persists. However, the $3,270 support zone remains a key pivot for any potential rebound.
💡 Suggested Trading Strategy:
SELL XAU/USD at: $3,345 - $3,350
🎯 TP: $3,325
❌ SL: $3,355
BUY XAU/USD at: $3,270 – $3,280
🎯 TP: $3,290
❌ SL: $3,260

Golden Jedi counterattack! Key support ignites the bull engine📌 Gold Technical Analysis & Operation Strategy Update
Gold bottomed out and rebounded as expected, and the trend basically met recent expectations - oscillating upward around the support range below.
💡 Key Point Review
Today, gold opened at around 3300, with a minimum of 3291, and then rebounded, reaching a maximum of 3325. The overall trend still fluctuates within the range, with strong support below and obvious suppression above, and the overall performance is a narrow range of fluctuations.
📉 4-hour chart analysis
Support focus: 3285-3295 area
Pressure focus: 3330-3340 area
Short-term long-short watershed: 3275-3283 line
🔎 Before effectively falling below the watershed, it is still mainly seen as range fluctuations, and the high-altitude low-multiple strategy continues to be implemented.
📈 Operation strategy suggestions
1️⃣ Try to go long with a light position if the price falls back to 3295-3300
2️⃣ If the price falls back to 3280-3285, you can add to your position appropriately
🎯 Target focus: 3316-3320, and look to 3330-3340 after breaking through
⚠️ Risk control suggestions: strictly set stop loss, control position, and prevent the risk of range breakout.

XAUUSD Long PositionI've just entered this Long position on Gold and I'm looking to hold this position and eventually sell when price reaches the short-term resistance level at around the "3,360.00" area.
#GOLD #XAU #XAUUSD #LONG #BUY OANDA:XAUUSD

Gold May Undergo Short-Term Correction as USD Rebounds📊 Market Overview:
Gold (XAU/USD) is trading around $3,320/oz on May 28, 2025, after failing to break above a key resistance zone. The US dollar’s recovery and rising Treasury yields are putting short-term pressure on gold, despite lingering geopolitical tensions.
📉 Technical Analysis:
• Key Resistance: $3,330 – $3,360
• Nearest Support: $3,280 – $3,235
• EMA 09: Price is currently above the EMA 09, indicating that the upward trend remains intact.
• RSI Indicator: RSI stays above the 50 level, suggesting momentum is still bullish.
• Candlestick Pattern: A doji near the $3,330 zone signals market indecision.
📌 Outlook:
Gold may see a mild correction if the USD continues to strengthen. However, holding above $3,280 would keep the bullish momentum alive.
💡 Suggested Trading Strategy:
🔻 SELL XAU/USD at: $3,330
🎯 TP: $3,310 (200 pips)
❌ SL: $3,340
🔺 BUY XAU/USD at: $3,285
🎯 TP: $3,305 (200 pips)
❌ SL: $3,275

Is Gold’s Recovery Pausing or Gaining Momentum?Macro approach:
- Gold rebounded sharply from mid-May lows, fueled by renewed safe-haven demand following Moody’s downgrade of the US credit rating.
- However, the rally lost momentum near a two-week high as profit-taking and easing US-EU trade tensions cooled demand.
- Longer-term fundamentals remain supportive, with persistent central bank buying, particularly from China, underpinning bullish sentiment.
Technical approach:
- Technically, XAUUSD broke above its descending channel and retested the breakout. The price remains range-bound between 3285 and 3560, and we await a clear breakout.
- Closing above 3560 could open to 3430.
- On the contrary, a break below 3285 risks a decline toward 3135.
Analysis by: Dat Tong, Senior Financial Markets Strategist at Exness

Gold trading insights: 28-May-2025Gold trading insights for today: Explore our zones for informed decision-making.


XAU/USD Bounces Off Strong Support Zone – Bullish MomentumGold (XAU/USD) has shown a strong bounce from the clearly defined support zone around the 3280–3290 level on the 1-hour timeframe. This zone has held multiple times in the past, confirming its significance. Additionally, the 200 EMA (red) is aligned with this horizontal support, creating a strong confluence area. Price action has respected this level, forming a bullish reversal candle setup, indicating potential for upside movement.
Based on this structure, a long (buy) trade can be considered around the 3300–3305 range, ideally after a bullish confirmation candle or price holding above the EMAs. This entry provides an opportunity to ride the next wave upward while maintaining a favorable risk-to-reward ratio.
The stop loss for this trade should be placed just below the support zone—around 3275 USD. Placing the stop slightly below this area protects against fakeouts while still maintaining good risk control. This is a logical level where the setup would be invalidated if breached.
For targets, the first potential resistance and partial profit booking zone is near 3335–3340 USD. This zone acted as resistance during previous price swings. If momentum sustains, the second target zone is around 3360–3370 USD, which marks a previous swing high and a likely destination for bullish continuation. For extended upside potential, traders can aim for 3385+ USD, especially if the price action is supported by volume and broader market sentiment.
This setup offers a clean technical play with a risk-reward ratio of approximately 1:2.5 or higher. Traders can also trail their stop-loss once the price crosses above the first target to protect gains while riding further upside.
=================================================================
Disclosure: I am part of Trade Nation's Influencer program and receive a monthly fee for using their TradingView charts in my analysis.

Today we will focus on the 3281 support
Gold fell below 3300, today we focus on the support of 3281
We are making a profit from the long suggestions given during the day, focusing on the support near 3281. If this position is not broken, the price will fluctuate and may re-stand on 3300 and go above 3320. Therefore, we insist on the long idea today, short around 3287-90, stop loss 3280, take profit at 3310-20, pay attention to the risk.
May 27 gold short-term trading: long near 3288, stop loss 3280, take profit at 3320
Be careful, if it breaks 3280, it is expected to reach 3260, and you can go bearish.

3300 becomes the dividing line between long and short positions🗞News side:
1. The situation in the Middle East and between Russia and Ukraine has escalated again
2. Pay attention to the opening of US stocks today
📈Technical aspects:
Good morning, bros. Gold is currently testing the important support of 3300. Once it falls below 3300, it can be officially confirmed that the correction trend is coming. Today's opening of the U.S. stock market is critical. If the U.S. stock market opens higher, it is very likely to pull down gold prices. The stable operation suggestion for the day is to go long when it retreats to 3295-3290, and then rely on the upper side of the previous low point for protection, that is, look at the vicinity of 3325-3330. If it encounters resistance and pressure near 3330-3340, you can consider entering a short position and continue to be bearish. At present, the first focus below is the support of 3290-3280. If it continues to fall, it may touch the 3266 line.
If you agree with this view, or have a better idea, please leave a message in the comment area. I look forward to hearing different voices.
OANDA:XAUUSD FX:XAUUSD TVC:GOLD FXOPEN:XAUUSD FOREXCOM:XAUUSD
Just continue to maintain the bullish idea of high-altitude an
On Monday, gold closed slightly lower as Trump's comments on EU tariffs boosted market risk appetite. Today, it retreated and rose in the morning and now fell below our early long position again. In the short term, gold has lost its positive momentum, but it is impossible to fall more sharply. As investors weigh the prospects of improved trade relations between the United States and the European Union, the demand for safe-haven assets has cooled, and gold prices have maintained a downward trend.
Today's risk data warning!
At 20:30 today, the initial value of US durable goods orders in April will be released, and the monthly rate is expected to fall by 7.9%, after an increase of 9.2% in March
At 22:00 today, the US Conference Board Consumer Confidence Index for May will be released, and it is expected to be 87.2, and the previous value is 86.0.
Views on the trend of gold in the European session!
Gold rose and then fell yesterday, and the final rebound stopped at 3365. The trend is in line with our trend of volatility. As for today's market decline and break, it is a normal market! In addition, it has not broken through 3370 and has been under pressure, and the decline continued in the morning today. Since the support position of 3300 is close to the bottom, it is not appropriate to chase the short position!
In terms of trend, gold lacks the upward momentum at the 4-hour level, and the market falls after the upper resistance. This week's market has been maintained in the small range of 3330 and 3370. It is inevitable that the breakout will accelerate. At present, the bulls are under pressure. Unlike last week's continuous rise, this week has a bit of weak volatility. Then we continue to maintain the high-altitude bearish and low-level bullish ideas unchanged!
Gold: Enter long orders near 3290, defend 80, and target 3325-30! Continue to follow up with short orders above 3340, defend 50, and target 3300-05!
A reliable person has an explanation for everything, a solution for everything, and a response for everything. I have been committed to the market. I will write analysis that is useful to investors and make fewer mistakes. I believe that time will tell the true heart of a person. I am Yulia. Thank you for your likes. I love you.

XAUUAD UPDATE : 27 - 5 - 2025The chart you've shared is a 1-hour candlestick chart of Gold (XAU/USD), showing a technical analysis with support and resistance zones, along with a projected bearish movement. Here's a detailed breakdown:
Key Observations:
1. Current Price Level:
Gold is trading around $3,322.79, slightly below a key resistance zone.
2. Resistance Zone (Top Yellow Box):
The resistance area is marked between approximately $3,360 and $3,372.
Price has previously been rejected from this zone, indicating strong selling pressure.
3. Support Zones:
Middle support zone around $3,280 – minor support where price might temporarily bounce.
Bottom support zone around $3,211.90 – strong support and likely target zone for the projected move.
4. Bearish Projection (Blue Arrows):
The analysis anticipates a potential minor retracement or consolidation, followed by a sharp move downward.
Final target appears to be just above $3,211, suggesting a potential short trade setup.
5. Volume Analysis:
Volume spikes correlate with major price movements, showing increased participation in those zones.
Possible Interpretation:
This chart suggests a bearish outlook for gold in the short term.
A trader might consider a short position if price fails to reclaim the resistance zone and confirms a break below the minor support near $3,280.
Risk management would likely involve placing a stop above the resistance zone ($3,360–$3,372), and taking profit near the $3,211 support area.
Would you like help creating a trading plan based on this chart?

Gold May Face Short-Term Correction at $3,350 Resistance📊 Market Overview:
- Gold is trading around $3,329/oz on May 27, after a slight decline due to President Donald Trump's postponement of the 50% tariffs on the EU until July 9, easing trade tensions.
- However, end-of-month USD selling pressure from portfolio rebalancing and concerns over U.S. debt continue to support gold prices.
📉 Technical Analysis:
- Key Resistance: $3,350
- Nearest Support: $3,295
- Candlestick Patterns / Volume / Momentum: The 14-day RSI is at 57, suggesting bullish momentum persists. However, price is testing strong resistance at $3,350. Failure to break through may lead to a pullback towards $3,295.
📌 Outlook:
Gold may experience a short-term pullback if it fails to break above the $3,350 resistance level and if market sentiment continues to be influenced by geopolitical and monetary policy factors.
💡 Suggested Trading Strategy:
SELL XAU/USD at: $3,345 – $3,350
🎯 TP: $3,330
❌ SL: $3,350
BUY XAU/USD at: $3,295
🎯 TP: $3,310
❌ SL: $3,390

Gold trading zones: 27-May-2025Today's Gold trading zones: Identify potential opportunities and plan your strategy.
