Gold is rising strongly, can it retreat and go long today?🗞News side:
1. US officials said Trump's statement was related to the Golden Dome Project, which may affect the flow of funds
2. The tension in the Middle East has intensified, and the risk aversion sentiment has increased, which is good for gold
3. Although the withdrawal of Indian and Pakistani troops has eased the regional situation, geopolitical risks still exist
4. Trump mentioned the tax bill, which affected economic expectations and affected gold investment sentiment to a certain extent.
📈Technical aspects:
Yesterday we gave the view that there would be suppression at the 3290 level above, but affected by geopolitics, risk aversion sentiment rose again. Today, the moving average spread upward, and the Bollinger Bands opened and expanded, and the situation is still bullish. At present, we need to pay attention to the key short-term support level, focusing on the 3280-3285 support line. If the price retreats to this level and does not weaken, it can be considered as an opportunity for us to go long. If the resistance of 3320 is broken through strongly, the upper target will move up, and the lower support will also move up accordingly. 3300 will be converted into an entry opportunity for bulls to pull back. Therefore, we need to observe the price continuity in the European session. If the European session continues to break highs, the US session's correction will still be mainly based on long positions. During the day, it is recommended to wait for gold to retreat to 3290-3280 and try to arrange long positions, looking upward to 3320-3330.
If you agree with this view, or have a better idea, please leave a message in the comment area. I look forward to hearing different voices.
FOREXCOM:XAUUSD FXOPEN:XAUUSD TVC:GOLD FX:XAUUSD OANDA:XAUUSD
Goldlong

Gold fluctuates, short-term pullback continues to go long
Gold fluctuated and retreated on Tuesday, testing the lowest line of 3205 downward. It can be seen that the market still does not have continuity, and the fluctuation space is also narrowing. The 1H cycle began to close, and the market was brewing a unilateral trend. After the daily line rebounded, it fluctuated around the short-term moving average. The direction was not clear. Short-term trading should not be pursued and sold at a loss. Operations should be carried out at a certain point.
From the perspective of the hourly line cycle, it is testing the low point of Monday's retracement, forming a short-term double bottom structure. Pay attention to short-term retracement and long positions, pay attention to 3218/3226 support for long positions, and pay attention to 3252/3265 positions above.

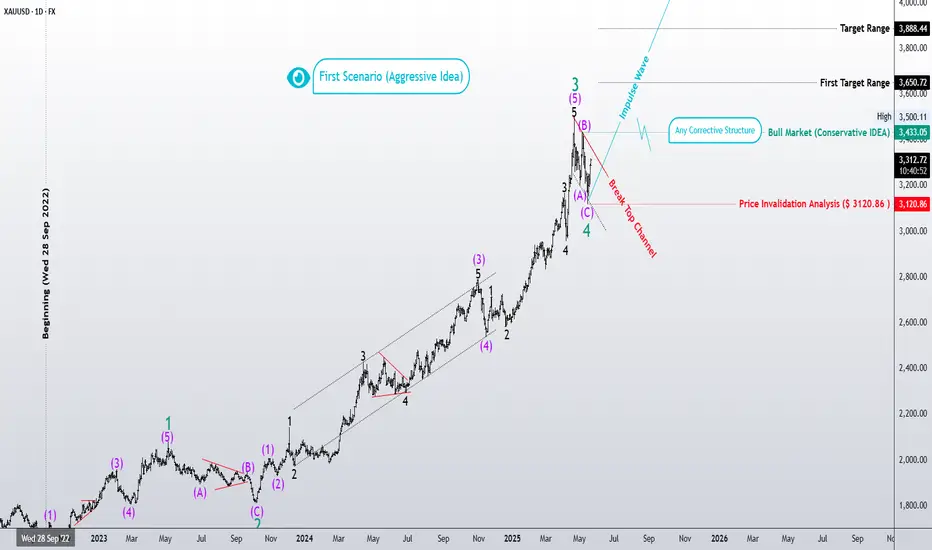
“Gold Surfer – Is Wave 5 About to Begin?”📈 This daily Elliott Wave analysis of the gold market (XAUUSD) tracks the impulsive advance from the September 2022 low ($1614). We now stand at a critical juncture: has Wave 4 completed, opening the path for Wave 5?
🔹 **Aggressive Scenario:** If the correction (ABC) is over, a new bullish Wave 5 could take gold first toward the $3884 zone, and potentially to expanded targets of $4126–$4275.
🔹 **Conservative Scenario:** If the correction continues, alternate patterns (flat, triangle, or complex correction) may still unfold. However, as long as price holds **above $3120**, the bullish wave structure remains valid.
🔻 **Invalidation Level:** $3120.86
🟢 The wave structure so far aligns with Elliott’s classic principles, and the bullish momentum still has room to unfold.
– Patterns whisper. I listen.
– Mr. Nobody 🎧📊
Trend trading is the core strategyGold opened at 3290 and rebounded, reaching 3314 and retreating. Last night, gold broke through the box and oscillated, so it is reasonable to continue to move up. The gold moving average continues to cross upward and diverge. The strength of gold bulls is still there. The decline of gold is an opportunity to continue to go long. Gold is now at the top and bottom conversion position of 3275-85. Gold falls back to 3275-3285 and continues to go long. Gold has repaired the gap of the previous gap. In the short term, pay attention to the suppression of 3315-21. Try not to chase the high position. We will intervene in the long position when it falls back.
Today, the support below is around 3275-85, and the upper short-term focus is on the 3315-21 line. If it does not break, you can short. The important resistance is 3340-45. The short-term long-short strength and weakness watershed is 3253-60. The daily level stabilizes above this position and continues to maintain the same low-long rhythm. Shorting can only enter the market at key points, and enter and exit quickly, and do not fight.
Gold operation strategy:
1. Go long when gold falls back to around 3275-85, with a target of 3300-3320.
2. Go short when gold rebounds around 3340-45, with a target of 3320-3300.

Gold 1h Analysis - What to expect from Gold today 21st May🌏 XAU/USD Outlook – Asian Session, May 21, 2025
Market Bias: 🔼 Strongly Bullish
Current Price: $3,299.34
Timeframe: 1H (with 5 & 21 EMA)
📊 Chart Breakdown:
Gold has surged cleanly through $3,243.28 and $3,268.13, now testing near-term resistance at $3,301.88.
Momentum is strong — candles are full-bodied with minimal wicks, showing solid buyer control.
EMAs are sharply angled and separated, indicating high momentum. No signs of reversal yet.
This is the strongest 1H push since the bounce from $3,157.35.
🔍 Key Levels:
Immediate Resistance: $3,301.88
Next Targets: $3,329.84 and $3,363.11 if breakout continues
Support Zones: $3,268.13 (structure low) → $3,243.28
Break below $3,268 would be first sign of a pullback starting
🗓️ News Ahead:
No major events during Asia session
Watch for U.S. Existing Home Sales later in NY
Big focus this week remains on FOMC Minutes (Wed) and PMIs (Thu)
📌 What to Expect:
Gold is entering the Asian session on strong bullish momentum
If buyers hold above $3,268, we could see another leg toward $3,329 during the London or early NY session
Likely to see sideways or slight pullback during Asia, but buyers are clearly in control — dips into structure may attract entries

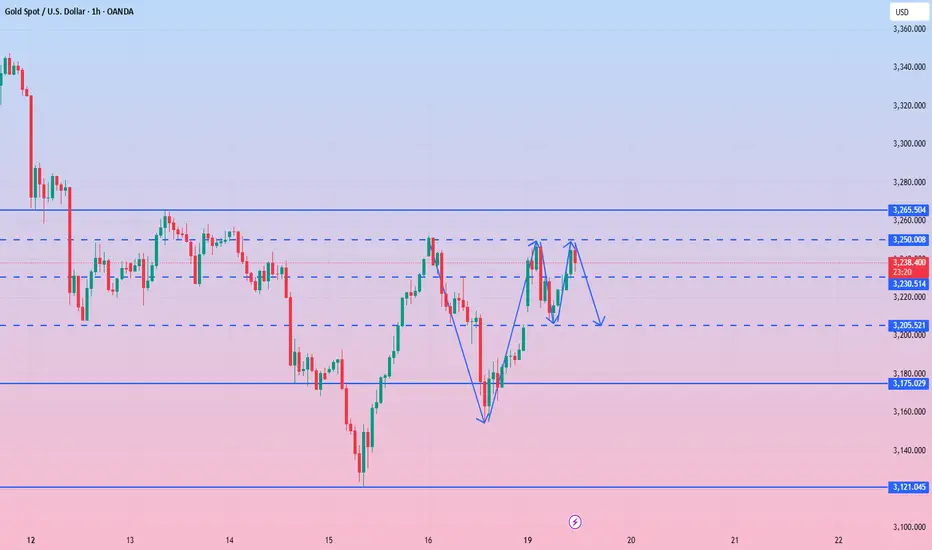
Inverse H&S + Triangle = Gold’s Perfect Setup for a BreakoutAs I expected in my previous idea , Gold ( OANDA:XAUUSD ) started to rise after a correction and made another attack on the Resistance zone($3,280-$3,245) .
Gold is currently moving near the Resistance zone($3,280-$3,245) and Yearly Resistance (2) .
If we look at the Gold chart from a Classic Technical Analysis perspective, two Classic Patterns are clearly visible.
1- Inverse Head and Shoulders pattern , which is a good sign for a Resistance zone($3,280-$3,245) breakout.
2- Symmetrical Triangle Pattern is also a sign of a continuation of the recent bullish trend
In terms of Elliott Wave theory , Gold seems to have completed the corrective waves , and we can expect the start of an impulsive wave . Breaking the Resistance zone($3,280-$3,245 ) can be a good sign for the start of an impulsive wave and a gold pump .
I expect Gold to trend higher in this week , and the first sign could be a break of the Resistance zone($3,280-$3,245) . The targets are clear on the chart.
Note: If Gold touches $3,179 , we should expect a drop.
Gold Analyze ( XAUUSD ), 1-hour time frame.
Be sure to follow the updated ideas.
Do not forget to put a Stop loss for your positions (For every position you want to open).
Please follow your strategy; this is just my idea, and I will gladly see your ideas in this post.
Please do not forget the ✅' like '✅ button 🙏😊 & Share it with your friends; thanks, and Trade safe.

Gold Breaks 3300 – Rally or Pullback Ahead?Gold has just broken through the critical support level at 3300 USD/oz and is currently trading around 3307. This movement aligns with previous forecasts, as gold continues to maintain a short-term bullish cycle. The next target investors are eyeing is the 3350 zone — a new resistance level that could define the upcoming trend.
📈 Technical Analysis:
• EMA 09: Candles are consistently closing above the EMA 09 line, indicating that bullish momentum remains dominant.
• Momentum remains strong, though profit-taking pressure could emerge as prices approach the 3310–3320 range.
• Short-term support: 3290 – a potential rebound area in case of a pullback.
• Major resistance ahead: 3350 – a key level that must be breached to confirm continued upside momentum.
💡 Short-Term Trade Scenarios:
🔻 SELL XAU/USD
Entry Zone: 3348 – 3350
Take Profit (TP): 3328 – 3330
Stop Loss (SL): 3360
🔺 BUY XAU/USD
Entry Zone: 3305 – 3307
Take Profit (TP): 3325 – 3327
Stop Loss (SL): 3295

GOLD at a Decision Point – Inverse Head & Shoulders vs. Channelhello guys!
Gold is currently forming a potential Inverse Head and Shoulders pattern at the bottom of a descending channel. This setup typically signals a reversal, but it faces a critical test at the neckline resistance and channel midline.
📌 Scenarios to Watch:
1️⃣ Bullish Breakout:
If the neckline is broken with strong momentum, we could see a continuation toward the upper resistance near $3,340, aligning with the descending channel’s top.
2️⃣ Bearish Rejection:
Failure to break the neckline could result in a sharp rejection, pushing gold back down toward the demand zone at $3,055–$3,075, especially if price respects the mid-channel resistance.
🔍 Key Technical Insights:
🧩 Inverse Head & Shoulders pattern forming
📉 Still trading inside a bearish descending channel
🛑 Neckline and midline confluence = strong resistance
🔻 Below neckline = bearish continuation risk

GOLD: Look To Buy After The RetracementPrice is showing bullish structure on M15/H1/H4. Price is tapping into a H4 bearish supply zone 3295-3310 so we may see a retracement to fill some imbalances or retest demand.
Possible Buy Limit Zones: 3275-3280 or 3251-3245
Set those alerts!

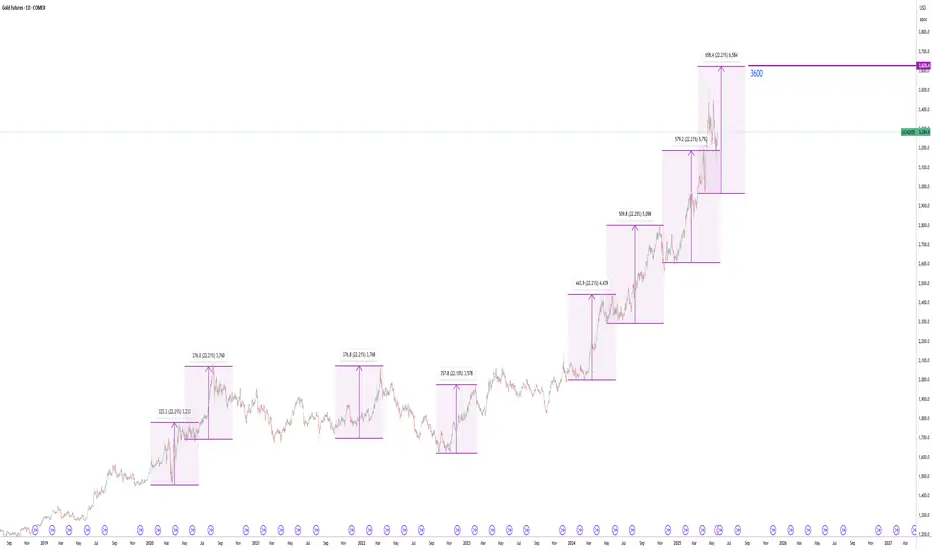
Gold is heading to 3600, her is whyReason 1
www.tradingview.com
Reason 2
Look at the chart, 22% rally is written all over the place. This give a target of 3600
Reason 3
We all know that. Bond yield spiking, Trumps big beautiful tax bill, weakness in USD blah..blah..
XAUUSD Chart 4H Analysis BUY GoldXAUUSD Chart 4H Analysis BUY Gold Doesn't Have To Be Hard Profit Surging!
The provided XAUUSD (Gold Spot/U.S. Dollar) 4-hour chart outlines a structured technical setup with clearly defined entry points, retracement zone, and multiple take-profit (TP) targets.
The current price at the time of analysis is **$3,198.67**, with the potential for a bullish continuation upon confirmation within the valid setup zone. Let’s break this down in detail:
**Current Price and Entry Strategy**
* **Current Price:** $3,198.67
* **Recommendation:** Look for better entry around or near the green support zone. The setup is bullish-biased, suggesting a buy-on-dip opportunity.
* **Support/Invalidation Zone:** If the price **closes below the green zone**, the setup will be **invalidated**. Hence, risk management and confirmation are crucial before taking any position.
**Target Levels Identified**
Three Take-Profit (TP) levels are established in the chart, each indicating potential upward momentum if the price respects the support and begins to rise again:
* **TP1: $3,220.67**
✔️ Gain of **22 USD (220 pips)** from current price
✔️ Represents an initial move post-entry confirmation
✔️ Ideal for short-term scalpers or conservative traders
* **TP2: $3,252.67**
✔️ Gain of **54 USD (540 pips)** from current price
✔️ Mid-level target indicating strong bullish continuation
✔️ Can be a good point for partial profit booking
* **TP3: $3,284.67**
✔️ Gain of **86 USD (860 pips)** from current price
✔️ Long-term or full swing trade target
✔️ Represents full bullish momentum with higher reward-to-risk ratio

Gold Price Update: Strong Rally Surpasses $3,250 SupportGold is experiencing a sharp rally, breaking through the key support level of $3,250/oz and currently trading around $3,280/oz.
- The main drivers behind this uptrend include:
- Increased demand for safe-haven assets amid global economic uncertainty.
- Fears of a potential recession and prolonged inflationary pressures.
- If gold sustains above $3,258, it is highly likely to continue its upward move toward the psychological level of $3,300.
- Should prices break above $3,300, the next potential target could be around $3,350.
📌 However, investors are advised to closely monitor key support and resistance zones to adjust their trading strategies accordingly.
📊 Short-Term Trading Strategy
🟢 Buy
Entry Price: $3,265
Take Profit (TP): $3,300
Stop Loss (SL): $3,245
🔴 Sell
Entry Price: $3,298
Take Profit (TP): $3,270
Stop Loss (SL): $3,310
Rationale: The $3,300 area is a strong resistance level, and a short-term pullback may occur.

XAU/USD (Gold) – Long Opportunity from Ascending Triangle 🟡 XAU/USD (Gold) – Long Opportunity from Ascending Triangle Breakout
Gold is showing a strong bullish structure with a well-formed ascending triangle on the chart, often a signal of continuation in an uptrend.
🔸 Key Technicals:
Rising trendline of higher lows indicates strong buyer interest.
Horizontal resistance at $3,255 has been tested multiple times.
Volume and structure suggest a potential breakout above resistance.
🔸 Trade Idea:
Entry: Upon breakout and retest of the $3,255 zone.
Stop-Loss: Below recent support and trendline (~$3,223).
Take Profit 1: $3,322 – Move SL to breakeven once hit.
Take Profit 2: $3,388 – Based on the height of the triangle projected upward.
This setup offers a clean 4% move with solid risk-to-reward. Ideal for swing traders watching Gold’s reaction to macroeconomic events.
📌 Always wait for breakout confirmation and manage risk wisely.
Let’s see if the bulls have what it takes to push through! 🚀

Gold price fluctuates, 3200 becomes a key watershed🗞News side:
1. Yesterday, Russia and Ukraine had a positive development on the issue of war and peace
2. The situation in Israel has become more serious
3. The United States and the European Union have further negotiations on tariffs
📈Technical aspects:
At present, gold is in a volatile situation in the short term. From a technical point of view, the monthly chart of gold shows an upward trend, and the long-term trend is neutral to bullish; the weekly chart is in a high-level stagflation situation, and the medium-term trend is expected to be a stagflation correction; the daily MACD top divergence, there may be a rebound demand in the short term, and the 4H forms a double top suppression near 3250. We need to pay attention to the range breakthrough trend during the day. At the same time, on the news front, the situation in Israel is becoming increasingly serious. Before any major news comes out, we will focus on the support effect of the 3200 line in the short term, and focus on the 3240-3250 resistance range on the upside.
🎁BUY 3210-3200
🎁TP 3230-3250
🎁SELL 3242-3250
🎁TP 3230-3210
If you agree with this view, or have a better idea, please leave a message in the comment area. I look forward to hearing different voices.
FOREXCOM:XAUUSD FXOPEN:XAUUSD TVC:GOLD FX:XAUUSD OANDA:XAUUSD

Gold Move 20 May 2025🔍 Buy Setup Analysis – 3222–3225 Zone
Price is expected to retrace into the 3222–3225 demand zone during the London session. This level if holds and aligns with potential bullish interest.
✅ Entry Signal Criteria
Price enters 3222–3225 zone
Target: 3235/3245
SL: Below 3212
Bullish CHoCH or MSS appears
FVG forms and holds
Strong bullish candle closes above FVG
If these align, consider executing a long position with proper risk management.

Gold Analysis and Signals
Updated analysis of the beginning of the week in the form of micro-waves on the 4-hour time frame, important support/resistance areas and possible direction... Orders in the reward of R2 profit and risk-free with the price so that the highest possible reward can be obtained, of course, if there is no stop lol...

4H FVG level is indicating a strong bullish sentiment.Market Analysis – Gold (XAU/USD)
Gold is currently trading within a bullish Fair Value Gap (FVG) on the 4-hour timeframe, accompanied by notable volume activity. Just below this zone lies a weekly FVG, and multiple other FVG and Breaker Block (BPR) formations have emerged in the same region. The price action around the 4H FVG level is indicating a strong bullish sentiment.
However, on the 1-hour chart, the market has recently formed a bearish FVG in the 3214–3220 range. If the price breaks above this level with strength, the bullish momentum could potentially drive the market toward the following upside targets: 3233, 3240, 3250, and 3260.
Let’s monitor closely and remember: Do Your Own Research (DYOR).

Gold Price Soars After Moody's US Downgrade: What's Next?Gold's Resurgence: A Deep Dive into the Moody's Downgrade and Market Tremors
The world of finance is a complex ecosystem, where a single event can trigger a cascade of reactions across global markets. Recently, such an event unfolded as Moody's Investors Service, one of the leading credit rating agencies, delivered a significant blow to the United States' financial standing by downgrading its sovereign credit rating. This unexpected move, occurring after a period of notable decline for gold, sent shockwaves through the financial landscape, prompting a sharp rally in the precious metal's price. In the early hours of Asian trading, gold surged by as much as 1.3%, reaching approximately $3,245 an ounce, a clear testament to its enduring appeal as a safe-haven asset in times of uncertainty.
The Catalyst: Moody's Downgrade and its Implications
Credit ratings are critical indicators of a borrower's ability to meet its debt obligations. For a sovereign nation, its credit rating influences borrowing costs, investor confidence, and its overall standing in the international financial community. Moody's decision to lower the U.S. sovereign credit rating by one notch, from the pristine Aaa to Aa1, was not taken lightly. The agency pointed to a confluence of persistent and concerning factors. Chief among these were the United States' chronic budget deficits, which have shown little sign of abatement despite various economic cycles. Moody's also highlighted a perceived erosion of political will and institutional strength to effectively address the nation's deteriorating fiscal trajectory. The growing burden of national debt and the escalating costs of servicing this debt were explicitly mentioned as significant concerns underpinning the downgrade.
This wasn't the first time the U.S. had faced a credit rating downgrade. In 2011, Standard & Poor's (S&P) stripped the U.S. of its top-tier AAA rating, a move that also sent tremors through global markets. The parallels are noteworthy, as both instances underscored deep-seated concerns about the sustainability of U.S. fiscal policy. A sovereign downgrade, particularly for an economy as pivotal as the United States, has far-reaching consequences. It can lead to higher borrowing costs for the government, potentially impacting everything from infrastructure spending to social programs. Furthermore, it can dent investor confidence, leading to capital outflows or a re-evaluation of risk associated with U.S. assets.
The immediate market reaction to Moody's announcement was a textbook flight to safety. The U.S. dollar, typically a beneficiary of global uncertainty, found itself under pressure. As the world's primary reserve currency, the dollar's value is intrinsically linked to the perceived strength and stability of the U.S. economy. A credit downgrade, by questioning that stability, naturally led to a weakening of the greenback. This weakening, in turn, provided a direct tailwind for gold. Gold is priced in U.S. dollars, so a cheaper dollar makes gold more affordable for investors holding other currencies, thereby stimulating demand.
Simultaneously, U.S. Treasury bonds, long considered one of the safest investments globally, experienced a sell-off. This might seem counterintuitive, as a flight to safety often includes government bonds. However, a credit downgrade directly impacts the perceived creditworthiness of those bonds. Investors demand a higher yield (return) to compensate for the increased perceived risk, leading to a drop in bond prices (yields and prices move inversely). The Treasury yield curve, which plots the yields of bonds with different maturities, steepened, indicating greater uncertainty about longer-term economic prospects and inflation. U.S. stock futures also registered declines, reflecting concerns that higher borrowing costs and diminished confidence could negatively impact corporate earnings and economic growth.
Gold: The Evergreen Safe Haven
Amidst this turmoil, gold shone brightly. Its rally was a classic demonstration of its role as a premier safe-haven asset. Throughout history, gold has been a store of value, a tangible asset that retains its worth when paper currencies or other financial instruments falter. Its appeal transcends economic cycles and geopolitical shifts. Unlike fiat currencies, which can be devalued by inflation or government policy, gold's supply is finite, giving it an intrinsic scarcity value.
In times of economic stress, such as those signaled by a sovereign credit downgrade, investors flock to gold for several reasons. Firstly, it acts as a hedge against currency depreciation. If the U.S. dollar weakens significantly, holding gold can preserve purchasing power. Secondly, gold is often seen as a hedge against inflation. If a government resorts to inflationary policies to manage its debt burden, the real value of money erodes, while gold tends to hold or increase its value. Thirdly, in periods of heightened geopolitical risk or systemic financial instability, gold provides a sense of security that other assets may not offer. It is a universally accepted medium of exchange and store of wealth, independent of any single government or financial institution.
The downgrade by Moody's amplified concerns about the U.S.'s fiscal health, a narrative that has been building for some time. Commentators pointed to over a decade of what they termed "fiscal profligacy," where successive administrations and Congresses have struggled to implement sustainable long-term solutions to the nation's growing debt. The phrase "ticking debt timebomb" resurfaced in financial commentary, underscoring the anxieties surrounding the long-term implications of current fiscal policies for the world's largest economy. These anxieties naturally fueled demand for gold as a protective measure. Adding another layer to these concerns were reports of a U.S. House panel approving proposed tax cuts, which, according to some economic analyses, could add trillions more to the national debt, further exacerbating the fiscal imbalance.
The Preceding Slump: A Market Breather
The vigorous rally in gold prices was particularly striking given its performance in the preceding week. The metal had been on a downward trajectory, poised for what was described as its steepest weekly decline in six months. This earlier weakness was primarily attributed to a strengthening U.S. dollar and an apparent easing of trade tensions between the United States and China. When geopolitical risks appear to subside and economic optimism grows, investors often rotate out of safe-haven assets like gold and into riskier assets, such as equities, in pursuit of higher returns. This is often referred to as a "risk-on" environment.
The announcement of a 90-day pause on tariffs between the U.S. and China had injected a dose of optimism into the markets. This temporary truce in the protracted trade war improved investor sentiment, reducing the perceived need for the kind of insurance that gold provides. Consequently, capital flowed towards assets perceived to benefit more directly from improved global trade and economic growth, leading to a pullback in gold prices. However, the Moody's downgrade swiftly reversed this trend, highlighting how quickly market sentiment can pivot in response to unexpected news.
Navigating a Complex Web of Global Influences
Gold's price is rarely determined by a single factor. It is subject to a complex interplay of global economic data, geopolitical developments, central bank policies, and investor sentiment. While the Moody's downgrade was the immediate catalyst for the recent rally, other elements continue to shape the landscape.
Ongoing geopolitical tensions in various parts of the world provide a persistent undercurrent of support for gold. Any escalation of conflicts or emergence of new geopolitical flashpoints can quickly send investors seeking refuge in the yellow metal. Furthermore, mixed economic data from major economies contributes to market volatility. For instance, softer-than-expected economic indicators from China, the world's second-largest economy, can dampen global growth expectations and influence risk appetite, which in turn affects gold.
Statements from key policymakers also carry significant weight. Comments from U.S. Treasury Secretary Scott Bessent regarding the potential reimposition of "Liberation Day" tariffs if trade negotiations with certain partners were not conducted in "good faith" served as a reminder that trade uncertainties remain. Such pronouncements can easily reignite concerns and support gold prices.
The Long-Term Horizon: Bullish Undertones Persist
Despite the short-term volatility, many analysts maintain a constructive long-term outlook for gold. Several underlying factors are expected to provide structural support for the precious metal in the coming years. One such factor is the potential for ongoing U.S. dollar weakness, driven by the country's twin deficits (budget and current account) and a gradual shift by some central banks to diversify their foreign exchange reserves away from an overwhelming reliance on the dollar. This diversification trend, if it continues, could provide a sustained tailwind for gold.
Moreover, the policies of major governments and central banks can also influence gold's trajectory. For example, periods of expansionary monetary policy, characterized by low interest rates and quantitative easing, can reduce the opportunity cost of holding gold (which yields no income) and potentially lead to inflationary pressures, both of which are typically gold-positive.
It's important to note that gold had already demonstrated strong performance in 2025, even before this latest surge. Year-to-date, the metal had appreciated significantly, reportedly by around 23%, and had even briefly surpassed the $3,500 an ounce mark for the first time in history during April. This underlying strength suggests that broader market forces were already favoring gold.
Major financial institutions have also echoed this optimistic long-term view. JPMorgan, for instance, has projected that gold could average $3,675 an ounce by the end of the year, with a potential to reach $4,000 before the close of 2026. Similarly, Goldman Sachs maintained its forecast of $3,700 by year-end and a $4,000 target by mid-2026. These forecasts often consider a range of scenarios, including the path of Federal Reserve interest rate policy and the likelihood of a U.S. recession. Even with expectations of delayed Fed rate cuts and a potentially lower U.S. recession risk, these institutions see considerable upside for gold.
Investor Strategy in a Shifting Landscape
For investors, the recent events serve as a potent reminder of gold's role in a diversified portfolio. While gold can be volatile in the short term, its ability to act as a hedge against various risks makes it a valuable component for long-term wealth preservation. The Moody's downgrade and the subsequent market reaction underscore the importance of not being complacent about sovereign risk, even in developed economies.
Retail investors might consider gold through various avenues, including physical bullion (coins and bars), gold exchange-traded funds (ETFs) that track the gold price, or shares in gold mining companies. Institutional investors, such as pension funds and endowments, often allocate a portion of their portfolios to gold as a strategic hedge and a diversifier.
The key is to view gold not as a speculative tool for quick profits, but as a long-term strategic holding that can provide stability and protection during periods of economic or geopolitical stress. The optimal allocation to gold will vary depending on an individual's risk tolerance, investment goals, and overall market outlook.
Conclusion: Gold's Enduring Relevance
The sharp rebound in gold prices following Moody's downgrade of the U.S. credit rating is a multifaceted event with significant implications. It highlights gold's unwavering status as a safe-haven asset, its sensitivity to shifts in U.S. dollar valuation, and the profound impact of sovereign creditworthiness on global financial markets. The downgrade served as a stark reminder of the underlying fiscal challenges confronting the United States and their potential to create ripples of uncertainty that benefit traditional stores of value.
Looking ahead, investors and market observers will be keenly focused on upcoming U.S. economic data, pronouncements from the Federal Reserve regarding monetary policy, and the evolving geopolitical landscape. While short-term fluctuations are inevitable, the fundamental factors that have historically supported gold – its role as an inflation hedge, a currency hedge, and a crisis commodity – remain firmly in place. As the global economic and political environment continues to navigate complex challenges, gold is likely to retain its allure as a critical component of a well-diversified investment strategy, a timeless guardian of wealth in an ever-changing world. The recent bounce may be more than just a fleeting reaction; it could be a reaffirmation of gold's enduring value proposition in an era of increasing uncertainty.

(XAU/USD) Buy Trade Setup – Entry, Target & Risk Management PlaEntry Point:
3,140.34 USD
This is the suggested level to enter a long (buy) trade.
Stop Loss (SL):
3,121.66 USD
A protective level to limit losses if the trade goes against the setup.
Target Point (Take Profit - TP):
3,251.33 USD
This is the EA target point — where profits are expected to be taken.
---
3. Risk/Reward Ratio:
Risk: From 3,140.34 to 3,121.66 = 18.68 points
Reward: From 3,140.34 to 3,251.33 = 110.99 points
Risk/Reward Ratio ≈ 1:6, which is very favorable.
4. Resistance Point:
Around 3,222.45 - 3,227.27
This area might act as a challenge for price movement, potentially leading to temporary retracements.
5. Indicators:
Moving Averages: Red (shorter period) and Blue (longer period) lines help indicate trends.
The price is moving above the short-term MA but currently under the long-term MA, which might suggest a short-term bullish move within a broader downtrend or sideways range.
Conclusion:
This is a bullish setup, anticipating a reversal or continuation to the upside after a pullback:
Buy Zone: 3,140.34
Stop Loss: 3,121.66
Take Profit: 3,251.33
If the price drops to the entry point zone

3235 line becomes short-term resistance? Golden layout at night!🗞News side:
1. Trump's dialogue with Russia and Ukraine on ceasefire
2. The seriousness of the situation in Israel
📈Technical aspects:
In the short term, the three key factors affecting the gold market are the certainty of tariff policies, geopolitical risks, and the pace of the Fed's interest rate cuts. The Russian-Ukrainian conflict is a tail risk that deserves attention. Its impact on the global order far exceeds other geopolitical conflicts. It is expected that the conflict may see a key turning point in May and June, and the Fed's interest rate cut is likely to be implemented in the third quarter. At that time, the gold and silver markets may face greater negative pressure, and prices may fall back to 3000-2800 or even lower. Technically, the double top pattern at the daily level has been established. Although there is a certain resistance at the 3235 line of gold in the short term, considering the tail risk, the possibility of evolving into a triple top cannot be ruled out, and we need to be vigilant against the inducement of multi-money rises and washes.
🎁BUY 3220-3215
🎁TP 3230-3240
🎁SELL 3250-3255
🎁TP 3235-3225
If you agree with this view, or have a better idea, please leave a message in the comment area. I look forward to hearing different voices.
OANDA:XAUUSD FX:XAUUSD TVC:GOLD FXOPEN:XAUUSD FOREXCOM:XAUUSD

Beware of a sharp surge at the beginning of the week!🗞News side:
1. The India-Pakistan conflict has been eased, but India has increased its troops in Kashmir
2. The situation between Russia and Ukraine has escalated again
3. Trump has asked Walmart to absorb the impact of tariffs on its own
📈Technical aspects:
Gold jumped higher in the Asian session in the morning and once tested the 3250 resistance line. In the short term, the upward space is limited and there is a certain suppression. At present, gold is testing the 3210-3200 support level again. Judging from the 4H chart, if the gold price breaks through this short-term support level, it is likely to go to the 3170 level next, or even test the strong support level of 3150. If it gets effective support at 3210-3200, gold may test the resistance area again. Therefore, in the short-term trading in the Asia and Europe sessions, maintain the high-level short-selling and low-level long-selling cycle to participate. On the upside, focus on the 3250-3260 resistance area. If it breaks through, it is expected to look towards the 3300 line. On the downside, focus on the 3210-3200 support line. If it breaks through this support, look to the 3170-3150 important support.
If you agree with this view, or have a better idea, please leave a message in the comment area. I look forward to hearing different voices.
FOREXCOM:XAUUSD FXOPEN:XAUUSD TVC:GOLD FX:XAUUSD OANDA:XAUUSD

GOLD(1H)📌 Gold Analysis (XAU/USD) - Key 1H Levels
🔍 Critical Zones:
▫️ Resistance: $3265
▫️ Support: $3120
▫️ Trend: Short-term bullish above $3120
⚡️ Trading Plan:
• Entry Zone: $3120-$3155
• Target: $3325 | SL: $3120
• Risk: Max 1% capital
💬 Engagement:
"Which scenario do you think is more likely?
1) Break above $3348
2) Rejection from $3320
Comment your answer! ↓"

It’s the right time to shortUS President Trump recently criticized Fed Chairman Powell again, calling him "slow to act" and emphasizing that the Fed should cut interest rates as soon as possible to support the economy. Trump believes that delaying interest rate cuts may lead to the risk of recession in the US economy, but the Fed still takes inflation and employment data as the core of decision-making, and the two sides have obvious differences in policy positions.
At present, the Fed's interest rate cut expectations have been postponed and the magnitude has been reduced. Coupled with the expectation of rising US bond yields, the gold market sentiment has weakened. The world's largest gold ETF recently reduced its holdings by 8.98 tons to 918.73 tons, reflecting the cooling of institutions' short-term bullish enthusiasm for gold. Technically, gold prices continued to weaken after breaking through key support last week, and the weekly closing was negative, suggesting that shorts were dominant; the daily level was constrained by the 20-day moving average, and the volatile downward trend may continue in the short term. Focus on the 3250-3265 line resistance during the day. If it cannot break through, the $3,200 mark below may face a test.
Gold recommendation: short sell when it rebounds to 3245-3252 range. Target 3230-3220.