Gold: Entering a long position on gold (long-term ). R/R: 1:5
Hello everyone,
This is not a scalp position — you’ll need to hold it for a few days, possibly longer. However, the risk-to-reward ratio is reasonable.
Please note: maximum risk is 1%.
Goldlong
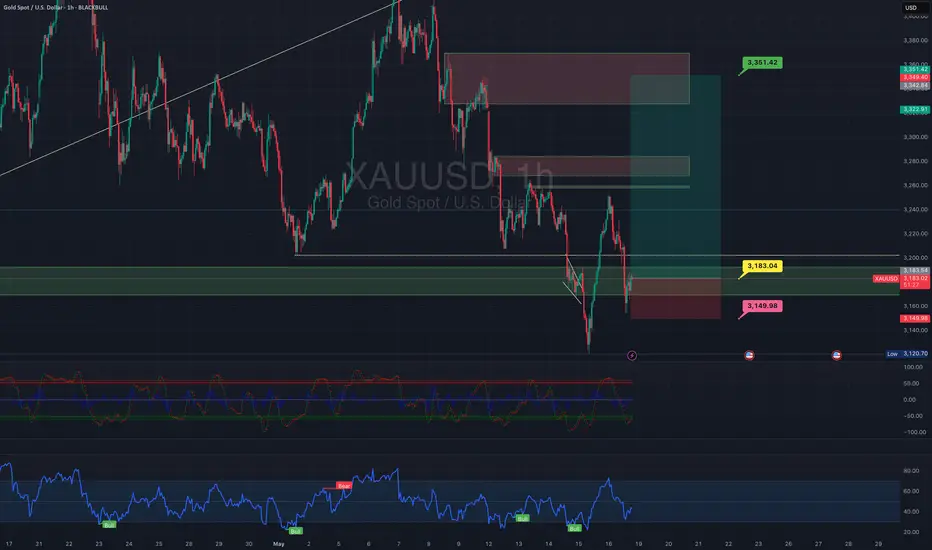
PATIENCE PAYS 〉BEARS TRAPPED - HODL TO $4,000As illustrated, Im trying to visualize the beginning of the next impulse toward $4,000
This is an intraday - swing trade opportunity to 1H highs; however, it would be just the first move toward a longer term path to ATH above $3,500
Ride this wave as you can, but know that the yellow metal still has a lot of strength and power to continue growing.
June might still behave strangely as it is a consolidation month on average 5-10-15 years; however, It wouldn't surprise me if market structure holds important support prices instead of ranging back below $3,200 - $3,150 ; in other words, that range might be strong longterm support.
--
GOOD LUCK!
SECURE PROFITS.
persaxu

Long orders are trapped,what should we do with the US gold marke🗞News side:
1. India considers using new Indus River project to cut water supply to Pakistan.
2. Pay attention to the news of Russia-Ukraine ceasefire negotiations today
📈Technical aspects:
Gold once fell to around 3170, which is in line with our judgment of bullish weakness. This is why we are not in a hurry to participate in long orders today. I know that many bros also listened to the outside world and went long around 3200, which led to being trapped. At present, the gold price is constantly testing the 3170 support line. If it falls below, it will look to the 3150 support line. If it does not break, it will be treated as a shock. On the top, temporarily pay attention to the 3205-3215 line of resistance. If it encounters resistance and pressure, go short. On the bottom, first pay attention to the 3170 support line, and then pay attention to the 3150-3140 support line. Hold if it breaks.
If you agree with this view, or have a better idea, please leave a message in the comment area. I look forward to hearing different voices.
OANDA:XAUUSD FX:XAUUSD TVC:GOLD FXOPEN:XAUUSD FOREXCOM:XAUUSD

Gold Bullish Outlook - Gold BullishFollowing strong buying momentum observed yesterday, gold is currently consolidating within a falling wedge pattern — a typically bullish setup. A breakout from this pattern could trigger a fresh upward move in the price of gold.
Post-Breakout Bullish Targets:
Target 1: 3230
Target 2: 3240
Target 3: 3250
Target 4: 3275
Disclaimer: This is a technical analysis-based outlook. Please assess your risk-to-reward ratio and follow your individual trading strategy. This is not financial advice — trade responsibly and according to your plan.

XAUUSD TRADE Entry from Support with Targets at 3,347 and 3,503Entry Point: 3,219.45
Stop Loss: 3,171.35
Target Point One: 3,347.49
EA Target Point (Final Target): 3,503.87
Trade Plan:
Risk Zone: Between entry (3,219.45) and stop loss (3,171.35). The trader risks roughly 48.1 points.
Reward Zone: From entry to:
Target Point One: ~128 points.
Final Target (EA Target): ~284.4 points.
Risk-Reward Ratios:
To Target Point One: ~2.66:1
To EA Target Point: ~5.9:1
Indicators and Signals:
Price appears to be bouncing off a support zone near 3,212–3,219, indicating a potential reversal.
200 EMA (blue) and 50 EMA (red) are shown; price is slightly above the 200 EMA, suggesting long-term support.
There is a downtrend before the bounce, so this might be a counter-trend trade or the start of a new trend.
Summary:
This setup is a classic bounce from a demand/support zone with a clear upside potential. The risk is tightly managed, and the reward is significantly higher, aligning with favorable risk-reward principles. However, the position is speculative and relies on bullish follow-through from the support level. Watch price behavior near the 3,288 and 3,347 resistance zones to assess momentum.

GOLD 1H Chart Analysis – Market Structure Shift & Liquidity ZoneThis 1-hour chart for XAU/USD (Gold Spot vs. U.S. Dollar) from TradingView displays a detailed technical analysis highlighting key market structure events such as Break of Structure (BOS), Change of Character (CHoCH), and liquidity zones. A descending trendline indicates bearish pressure, while recent CHoCH suggests a possible bullish reversal. Key supply and demand zones are marked in red, with liquidity grabs and imbalances visualized using shaded areas. Price currently hovers around the 3,211 level, approaching a resistance zone after reclaiming bullish momentum. Traders may look for reactions near the supply zone or a break above trendline resistance for confirmation.

Gold has a strong deep V, 3200 support is good for longThe 1-hour moving average of gold begins to turn and continue, so the momentum of gold bears begins to weaken, and gold bulls may begin to exert their strength. However, gold started to rise all the way from 3120 to 3252 yesterday. Gold rose by about 130 points, so the volatility began to increase. Therefore, we must wait patiently for gold to adjust. Because of such a large fluctuation, an adjustment will also be tens of dollars. We must wait patiently for the adjustment and stabilize before going long. After gold breaks through 3192, it is considered a strong deep V breakthrough of important resistance. Then 3192 of gold has now become an important support level. If it falls back to 3192 in the Asian session, go long on dips. If gold falls back to near the 3200 mark, you can try to go long.
Since gold has started to reverse strongly, gold bulls have begun to show their muscles. In the short term, we should not be stubbornly bearish anymore. We should be flexible and adapt to the market. The market is like this, changing rapidly. We should adapt to the market and not be too obsessed with bears or bulls. Obsession is a trap. Gold bulls are strong now, so gold is now the home of bulls. Go long when the Asian session falls back.

Bullish Momentum Builds as Gold Trades Within 3200–3250 RangeSHORT-TERM GOLD ANALYSIS – XAUUSD
🟢 GOLD SURGES TO $3250 FOLLOWING FED CHAIR'S SPEECH
Gold prices spiked to the $3250 region after a reassuring speech by the new Fed Chair, which helped calm market sentiment. The move reflects renewed demand for safe-haven assets.
📉 Currently, XAUUSD is trading around the 3220 area, testing short-term resistance levels and potentially building momentum for another upward push.
🔎 Key short-term price zone:
In the short term, gold is likely to range between $3200 and $3250, forming a short-term trading zone where accumulation and directional moves may develop.
✅ Short-Term Trade Setup
🔹BUY:
Entry: 3205
Take Profit (TP): 3210
Stop Loss (SL): 3200
🔹SELL :
Entry: 3241
Take Profit (TP): 3236
Stop Loss (SL): 3246
⚠️ Notes:
These setups are best suited for short-term traders using lower timeframes (M15–H1).
Monitor price action closely around 3200 and 3250 for confirmation before entering trades.
Always apply proper risk management to avoid overexposure, especially with ongoing market reactions to Fed news.

Gold Bulls Reloading from 3239 | Break-and-Retest Long SetupGold (XAUUSD) is still riding a solid bullish wave after yesterday's strong move. The price surged sharply and is now setting up a classic break-and-retest pattern around the 3239 demand zone on the 30-minute chart.
After hitting a local peak, the price pulled back to the previous breakout level, creating a potential re-entry point for buyers. This movement fits well with the intraday structure and momentum, making it a high-probability continuation setup.
As long as the 3231 support level holds, the bullish outlook stays intact. The rejection wick from this area shows early signs of buyer interest, and a small bullish candle confirmation from here could spark another upward move.
🔹 Trade Plan:
Entry: 3239 (retest of broken structure)
Stop Loss: 3231 (below rejection wick & minor support)
Take Profits:
TP1: 3248 – minor resistance
TP2: 3255 – price imbalance fill
TP3: 3264 – extended target / top liquidity zone

Gold Potential Bullish Continuation (Potential HH formation)With with continued global tariff war between USA and China, Gold price still seems to exhibit signs of overall Bullish momentum as the price action may form a prominent Higher High with multiple confluences through key Fibonacci and Support levels which presents us with a potential long opportunity.
Trade Plan:
Entry : 3178
Stop Loss : 2946
TP 0.9 - 1 : 3399 - 3408

Gold is abnormal, we still need to go long when we find an oppor
Gold has a perfect V-shaped reversal today. It opened at 3177 and fell unilaterally in the Asian session. It hit 3120 at noon and then rose slowly. As of the time of writing, it has completely recovered the decline and is currently trading around 3195. I have analyzed the European session. After the gold price broke through the extreme drop of 3200, it needs to be repaired, but it has taken another rebound correction. The analysis also gave attention to 3156 to 3168 to continue to be bearish. With the slow rise and break, the bearish view is invalid. Now make a new analysis.
Since the gold price has been rising slowly since 3120, let’s not guess whether this wave of upward movement is a rebound or a trend reversal. In terms of operation, I suggest to follow the trend and look at its upward movement first. Because we have analyzed the general trend before, it is still in the second wave of decline since the high-level decline and has not reached the trend target; secondly, the rebound of 70 points from the low level is not enough to judge the trend reversal. So first pay attention to the stagflation after this wave of slow bull trend and then make a trend judgment.
At the hourly level, the gold price has been rising slowly since the opening of the US market. This slow rise is generally not a top. We will wait for a correction and break through the previous hourly K before analyzing it. In terms of specific operations, we can first follow the trend and enter the market with long orders, with protection at 3176. The upper target is 3110. After breaking through, wait for a correction of 8-10 points to continue to go long and look at 3239. Then pay attention to whether the 3200 mark can be stabilized at the close of today, which is related to our layout ideas at the end of the week.

The rebound in gold prices is for better short selling
After gold fell below 3200 this week, the current trend is as shown in the figure. The end of this wave is tentatively set at around 2900. There may be a rebound during the period, but it is only a rebound. After the news faded, I emphasized that the gold price of 3500 was a top to look at the retracement in my analysis after the 9th of this month. I also gave a short-selling strategy and the staged support position below. Now the support level has been broken one after another, so we can continue to look at the target according to the trend.
The last wave of decline at the short-term level has gone through several shock adjustments along the way. Now the gold price has rebounded again near 3120, and the highest rebound reached 3153. I also gave some people a reminder to continue shorting along the way. Now I will mainly make a brief analysis of the hourly line. After the sharp drop, the gold price must be repaired. One is shock adjustment repair, and the other is rebound repair. Under this extreme decline trend, gold does not have the conditions for a rebound, so I think the rebound here at 3120 is just caused by some short orders choosing to sell for profit, so the market will continue to fall in the future.
Now there are two main positions to focus on above. The first is the previous low point near 3168 during the decline, and the other is the starting point of the last wave near 3156. If the rebound does not cross these two positions, we can continue to see gold testing or even breaking through the recent low of 3120. Pay attention to the step support below near 3088.

Gold going to re-test 3270 ?There is a potential bullish move on the 4 hour chart.
Gold is trading in the Resistance zone, near the lower line of the channel.
Stop loss: 3127
Take profit: Around 3270

Gold, let's fall like crazy
Gold is consistent with our previous analysis. It has reached a new low recently, breaking through the key position of $3,220, ushering in a new round of decline. Some people directly said: It can't hold on.
This time, after the gold price opened lower on Monday, it has been hovering above $3,200-3,220, fluctuating back and forth, and finally failed to rebound successfully.
There are various opinions on the market about the reasons for the decline, and the key point I emphasize is: whether the decline is over must depend on whether the high point before the last decline is lost, and if the key support position is lost, it can no longer be defended.
For example: Yesterday we first entered the market near $3,220 and rebounded to around $3,243, and we have always emphasized the gains and losses of the key position of $3,215. When it is lost here, we must adjust our thinking in time. The difference between us is who can change their thinking faster at the critical moment.
For physical gold or accumulated gold, it is very passive without hedging tools. For example, when the price breaks the key position, it can only be solved by cutting losses. Because of chasing in at a high position, there is no follow-up funds to lower the cost. At the same time, the funds account for too large a proportion of their own cash flow, which will lead to passive beating.
Therefore, the market will not always rise and never fall, nor will it only fall and never rise. The key is how to balance the allocation of funds and risks, whether the key position can be accepted in time after it is lost, rather than holding on to it. Trading is not a simple one-trick win, but a flexible response. For example, gold ETF: I have always been investing weekly, from last year to now, and the proportion will not be too large. The rise and fall in the middle has almost no effect on me, and the leverage method must be to make a day-to-day settlement. If you encounter a unilateral long-term, you will take a bite, and if you don’t encounter it, you will seize the moment.
Okay, let’s talk about today’s gold market:
On Wednesday, the formula for gold application is: Asian market falls, European market continues, and the rebound before the US market is to lure more, and go short when you see a high. The Asian session fell from the high point to $3220 and has been fluctuating repeatedly. After rebounding to $3243 in the European session, it did not continue, but started a wave of decline. The key position of $3215 was broken during the US session, and the short position was confirmed at this time.
Also, today is: the previous day's weak bottom closing, the next day's early trading can still be shorted, today's pressure position is around $3195, the rebound pressure is the position of the early morning high, and then it breaks down to $3150, and the key pressure at this time is the top and bottom conversion.
As shown in the figure, after the bottom oscillation, a new high point moves down and the low point breaks, which is a typical decline. The early morning high of $3195 is the key long-short dividing point, and the top and bottom conversion becomes today's new entry position for shorting. Remember one sentence: Never look for support to go long in a falling market, but look for pressure to go short. When will the decline end: the high point before the last 1-hour or 4-hour decline is broken and closed above this position. The retracement confirms that there is no new low. The market outlook will rebound or reverse. There is no need to guess when the bottom will be reached. The bottom is found, not guessed! ! ! !
Today, gold rebounded and went short in the range of 3165-70. This is the pressure point for the top and bottom conversion. There are three short periods today: the opening rebound high, the top and bottom conversion of the European session rebound, and the rebound before the US session after the European session weakened. The defensive position is above 3195 US dollars, and the focus below is 3145-40-32 US dollars.

GOLD support @ $3100There are a lot of things that show the price about $3100 for Gold is a really important & strong support for now.
We have 61% & 70.2% of Fibonacci retracement about this area.
The bear flag target on 4H TF is at $3100.
Even the target for double top is at that area.
In the past the price of $3100 was a support as well.

Gold Holds Key Support Ahead of CPIOANDA:XAUUSD Gold (XAU/USD) edged higher to $3,255 early Tuesday as traders awaited the US April CPI report. While the 90-day US-China tariff truce improved market sentiment and limited gold’s upside, geopolitical tensions in Ukraine, the Middle East, and South Asia continue to drive safe-haven flows. A de-escalation in US-China trade tensions triggered the recent pullback, with price failing to reclaim the $3,271 resistance. The $3,213 area remains a major support. A break above $3,271 is needed to resume bullish momentum, while failure to hold $3,213 could expose $3,127.
Resistance : $3,271 , $3,305
Support : $3,213 , $3,127

Gold heads towards 3100 price zone, long or short?
📌 Driving Events
Gold prices (XAU/USD) fell for the second straight session on Thursday, the third decline in the past four days, and fell to a more than one-month low below $3,150 during the Asian trading session. The continued downward pressure is largely due to renewed optimism after signs of a substantial de-escalation in the Sino-US trade dispute, a development that has dampened demand for traditional safe-haven assets such as gold.
The announcement of a 90-day trade truce between the world's two largest economies also helped ease recession fears in the United States, prompting investors to reduce expectations for aggressive monetary easing by the Federal Reserve. The shift supported the continued rise in US Treasury yields, further suppressing demand for the non-interest-bearing gold.
📊Comment Analysis
Downtrend, bears continue to exert downward pressure on the market, heading towards the 3100 price area
⭐️Set Gold Price:
💰Strategy Package
🔥Sell Gold Area: 3178-3188 SL 3191
TP1: $3180
TP2: $3170
TP3: $3160
🔥Buy Gold Area: $3101 - $3099 SL $3094
TP1: $3110
TP2: $3120
TP3: $3130
⭐️ Note: Labaron hopes that traders can properly manage their funds
- Choose a lot size that matches your funds
- Profit is 4-7% of the fund account
- Stop loss is 1-3% of the fund account

Gold continues to fall seize the opportunity to enter the market
📌 Driving factors
China-US container shipping routes rose sharply - factories rushed to produce overnight, taking advantage of the tariff cooling-off period, those who should stock up are working overtime to complete the tasks. This is the situation seen on the first day after the tariff reduction, indicating the complementarity between China-US trade.
The long-awaited US-Japan and European and American tariffs have not yet ushered in substantial benefits, but Europe said that this is an unfair negotiation and has not been concluded yet.
Trump went to the Middle East and signed a 100 billion weapons order, stabilizing the Middle East before Europe.
📊Comment analysis
The Asian session fell in the morning, pay attention to a few points:
1. The upper watershed opened at 3193 in the morning, the short watershed.
2. Directly break the 3168 long watershed, the next support is at 3145, 3130.
3. For now, the Asian session will continue to fall in a cycle, the European session will pull back after breaking the bottom, and the US session will continue to retreat.
💰Strategy Package
For short-term operations, short selling can be done near 3166, stop loss 3169, target 3140, 3135.
Labaron believes
Guaranteeing the principal is the bottom line for survival, controlling risks is the armor for survival, earning profits is a stage medal, and long-term stable and continuous profits are the only proof of being able to stand up from the sea of blood and corpses.

High R Risk Long Strategy 3160 Old Bulls Awaiting AttackNew version:
After a significant drop in gold prices, we're starting to notice some encouraging signs of a bullish trend taking shape. The price has bounced off the 3145–3160 demand zone several times, hinting at possible accumulation. The recent candle patterns are showing higher lows, and it looks like buyers are stepping in to protect the liquidity just below 3160.
This setup is all about price action, liquidity sweeps, and structural changes. The 3160 zone is a crucial decision point where we expect buyers to take charge. It also coincides with a previous imbalance fill and a short-term order block.
Right now, this phase presents a great risk-to-reward opportunity for bulls, as long as the stop loss at 3145 holds firm.
Entry: 3160
Stop Loss: 3145 (just below the liquidity sweep and order block)
Targets:
TP1: 3180 (a minor resistance / reaction zone)
TP2: 3196 (liquidity above the last high)
TP3: 3208 (a key breakout target zone)

Short selling on the rebound is determined to winAfter gold fell below 3202 in the US market, it rebounded to 3198 at its highest. This rebound was just an oversold rebound, and then continued to fall back. Although it has not refreshed the low point for the time being, the pattern has weakened and it is difficult to rise again in the evening. Weak shorts can hardly get past 3198. The short-term support below is 3150-3140. Gold continues to cross downward shorts in 1 hour. The short strength is still there. The rebound continues to give shorts opportunities. There is no obvious sustained upward momentum in the short term. Then such a market is just a rebound. Gold rebounds in the US market and continues to be short. On the whole, the short-term operation strategy for gold today is recommended to be short on rebounds and long on pullbacks. The short-term focus on the resistance line of 3202-3205 is on the upper side.
Gold operation strategy reference:
Strategy 1: Short gold near 3195-3205, target near 3180-3170.
Strategy 2: Long gold near 3160-3150, target near 3170-3190.


Gold falls below 3200, continues to look at 3100
📌 Driving factors
As Sino-US trade tensions ease, market concerns about a global recession ease, investors' risk appetite rises, and gold's attractiveness as a safe-haven asset declines, gold prices fell on Wednesday (May 14). After the tariff truce announced over the weekend, the stock market rose sharply, weakening gold's safe-haven appeal in the short term, which was an important factor that pushed gold prices to new highs in the previous few months, and it is also the starting point for the current large-scale selling!
📊Commentary Analysis
The price trend of gold on Tuesday showed a significant repeated shock feature. Although it ended up rising, it experienced two tortuous processes of first falling and then rising in the process, which led to a relatively limited overall increase. After the previous day's correction, the current 5-day moving average and the 10-day moving average formed a dead cross and continued to extend downward. From the perspective of intraday trading, the resistance level formed by these two moving averages has become the focus of market attention.
In the morning article, I repeatedly emphasized that gold is expected to break below 3200. Sure enough, it broke below without hesitation today. It is currently at 3185. The short position of gold near 3250 that we gave yesterday has expanded its profit again today, and it is easy to make a profit of nearly 100 points. Today, the US market operation is still mainly shorting, and it can continue to short near the rebound of 3200.
💰Strategy Package
Today, the US market operation is still mainly shorting, and it can continue to short near the rebound of 3200, with the target near 3170-3180.
Labaron believes
Guaranteeing the principal is the bottom line for survival, controlling risks is the armor for survival, earning income is a staged medal, and long-term stable and continuous profit is the only proof that it can finally stand up from the mountains of corpses and seas of blood.

GOLD ANOTHER CHANCE TO SHINETeam, earlier GOLD hit our target,
Now Gold at currently 31813183, we should have good support at 3267-63
We are looking first round at 3217-3222,
However above 3205, we bring stop loss to BE for safety
Our second target at 3243-3247
