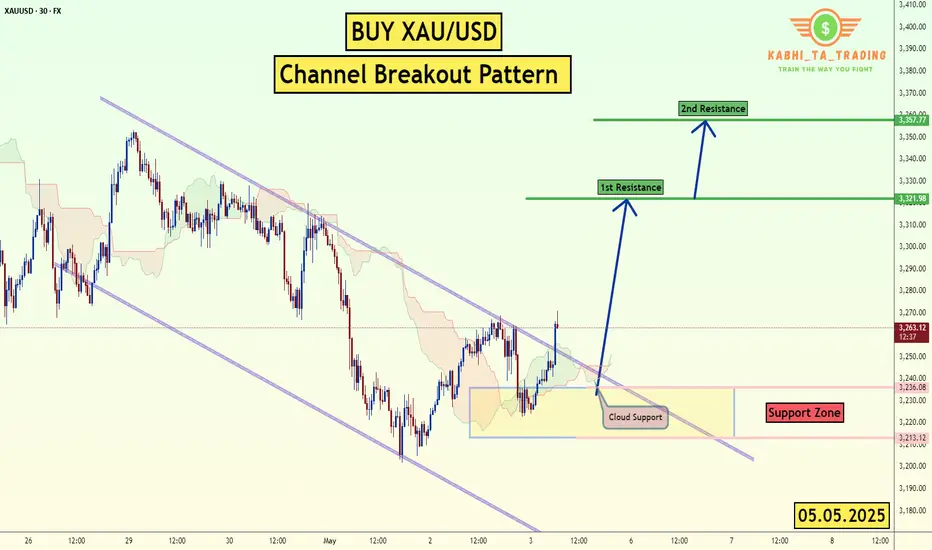
XAU/USD - Channel Breakout (05.05.2025)The XAU/USD pair on the M30 timeframe presents a Potential Buying Opportunity due to a recent Formation of a Channel Breakout Pattern. This suggests a shift in momentum towards the upside and a higher likelihood of further advances in the coming hours.
Possible Long Trade:
Entry: Consider Entering A Long Position around Trendline Of The Pattern.
Target Levels:
1st Resistance – 3321
2nd Resistance – 3357
🎁 Please hit the like button and
🎁 Leave a comment to support for My Post !
Your likes and comments are incredibly motivating and will encourage me to share more analysis with you.
Best Regards, KABHI_TA_TRADING
Thank you.
Goldlong
Gold Buy Call #XAUUSDGold has broken out of a key resistance level at, $3,265 with strong bullish momentum and above-average volume, confirming the breakout. This move is supported by rising RSI and MACD crossover, indicating strength in the trend. The breakout from the consolidation zone signals renewed investor interest, likely driven by macro uncertainty and safe-haven demand.
Traders can consider initiating long positions at current levels with a stop-loss and take profit levels defined in the charts.

Gold (XAU/USD) - Bullish Reversal Pattern in Play Hello guys!
Let's analyze Gold!
Gold has recently broken out of a descending wedge pattern, a classic bullish reversal signal, with confirmation coming from a clear bullish divergence near the $3,200 zone. After reaching the target of the descending pattern, the price rebounded sharply and is now forming an ascending channel.
Currently, the price is approaching a key resistance zone around $3,280–$3,290. If bulls manage to push through this level, we could see a rally toward the next major resistance around $3,320 and beyond.
🔍 Key Points:
✅ Descending wedge breakout confirmed
✅ Bullish divergence near the bottom signals a momentum shift
✅ Price respecting ascending channel structure
📈target of long position: $3,290–$3,320
📉 target of short position and the entry for long: $3,240 zone
Outlook: Bullish bias remains valid as long as the price is above the $3,240–$3,250 support area. Watch for a breakout above resistance for further upside continuation.

How to arrange when gold fluctuates upward🗞News side:
1. Pay attention to the recent trade situation and news about the Fed's interest rate cuts
2. Be wary of DXY trends
3. The situation of the Russian-Ukrainian war and the follow-up events of the India-Pakistan conflict
4.Trump imposes 100% tariff on non-US films
📈Technical aspects:
In the morning, we seized the opportunity to short and earn a wave of profits. Then gold fell back to 3255 and rebounded again, moving upward in a fluctuating manner. From the hourly chart, Friday's low was around 3220 and today's high was around 3270. In this trend, 3255 may be the short-term low for short-term trading. From the daily chart, gold has closed the cross star. The current gold price is more critical. If it breaks through 3285, it may continue to rise to the 3295-3300 line. If the gold price fails to effectively break through 3285, it may usher in a wave of retracement. It will be a good time for us to go long.
If you agree with this point of view, or you have a better idea, please leave a message in the comment area. I look forward to hearing different voices.
TVC:GOLD FOREXCOM:XAUUSD FXOPEN:XAUUSD FX:XAUUSD OANDA:XAUUSD

what is fair value gap ? what is fair value gap ?
-This Analysis is based on educational purposes using the concepts of Smart Money and Liquidity Sweep area
- We create two fair Value gaps in which market will act on that
first one is between 3247 to 3260 area expecting move down from that point and touched 3192 to 3165 which is a strong liquidity zone

GOLD 4H CHART ROUTE MAP UPDATE & TRADING PLAN FOR THE WEEKHey Everyone,
Please see our updated 4h chart levels and targets for the coming week.
We are seeing price play between two weighted levels with a gap above at 3282 and a gap below at 3224. We will need to see ema5 cross and lock on either weighted level to determine the next range. We have a bigger range in play then usual.
We will see levels tested side by side until one of the weighted levels break and lock to confirm direction for the next range.
We will keep the above in mind when taking buys from dips. Our updated levels and weighted levels will allow us to track the movement down and then catch bounces up.
We will continue to buy dips using our support levels taking 30 to 40 pips. As stated before each of our level structures give 20 to 40 pip bounces, which is enough for a nice entry and exit. If you back test the levels we shared every week for the past 24 months, you can see how effectively they were used to trade with or against short/mid term swings and trends.
The swing range give bigger bounces then our weighted levels that's the difference between weighted levels and swing ranges.
BULLISH TARGET
3282
EMA5 CROSS AND LOCK ABOVE 3282 WILL OPEN THE FOLLOWING BULLISH TARGET
3343
EMA5 CROSS AND LOCK ABOVE 3343 WILL OPEN THE FOLLOWING BULLISH TARGET
3404
EMA5 CROSS AND LOCK ABOVE 3404 WILL OPEN THE FOLLOWING BULLISH TARGET
3439
EMA5 CROSS AND LOCK ABOVE 3439 WILL OPEN THE FOLLOWING BULLISH TARGET
3503
BEARISH TARGETS
3224
EMA5 CROSS AND LOCK BELOW 3224 WILL OPEN THE FOLLOWING RETRACEMENT RANGE
3190
3138
EMA5 CROSS AND LOCK BELOW 3138 WILL OPEN THE SWING RANGE
SWING RANGE
3088 - 3046
EMA5 CROSS AND LOCK BELOW 3046 WILL OPEN THE SECONDARY SWING RANGE
SECONDARY SWING RANGE
3015 - 2988
As always, we will keep you all updated with regular updates throughout the week and how we manage the active ideas and setups. Thank you all for your likes, comments and follows, we really appreciate it!
Mr Gold
GoldViewFX

GOLD DAILY CHART ROUTE MAP UPDATEHey Everyone,
Here’s the latest update on our daily chart idea, it’s been playing out perfectly!
The daily chart is unfolding as projected, with price action respecting the structure of the Goldturn ascending channel. A breakout above the channel was confirmed by the EMA5 crossing and closing above the upper boundary. This move extended to test the 3433 Goldturn axis level, where price met resistance. Notably, EMA5 failed to sustain a close above 3433 Goldturn level, confirming a lack of bullish momentum and validating a rejection. Price has since reversed, re-entering the channel.
Below, broader support is identified around 3104, which aligns with the channel’s half line. While this level may not be reached immediately, the current price range between 3297 and 3104 is significant. We may observe continued consolidation within this zone, with the half line gradually ascending. This dynamic could result in price interacting with the half line earlier than a direct move to 3104, providing potential bounce opportunities best monitored through lower timeframes for refined entries and validations.
This is the beauty of our Goldturn channels, drawn using weighted averages instead of pure price action. This unique approach helps us clearly identify fake-outs and real breakouts, cutting out much of the noise that usually confuses traders.
Moving forward, we’ll focus on smaller timeframes (1H and 4H) to buy dips off the weighted Goldturns, aiming for clean 30–40 pip moves. Ranging markets are perfect for this style, allowing us to capitalize on quick moves without getting caught in the chop of larger swings.
Thank you all again for your continued likes, comments, and follows, we truly appreciate your support!
Mr Gold
GoldViewFX

GOLD SWING XAUUSD took support form bottom - up Line.
All long targets are achieved
This month taking rejection from major resistence,
Let's track the moves from Top down line.
Follow for more swing analysis for INDICES - CURRENCY - COMMODITIES

XAUUSD ANALYSIS XAUUSD took support from support line,
All long targets are achieved.
this month taking rejection from major resistence,
Let's track the moves to down.
follow for more swing analysis on INDICES - CURRENCY - COMMODITIES

XAUUSD swing Analysis XAUUSD took support from support line,
All long targets are achieved.
this month taking rejection from major resistence,
Let's track the moves to down.
follow for more swing analysis on INDICES - CURRENCY - COMMODITIES

The latest gold strategy analysis and operation guidance📌Fundamentals:
This week, the US economic data was released intensively, and ADP employment, unemployment benefits, GDP and PCE price index were all bullish, but some data showed signs of weakness after Trump's tariff policy. The unemployment rate remained the same as the previous value of 4.2%, while the expected new employment of 130,000 was significantly lower than the previous value of 228,000. The market's concerns about the cooling of the economy provided support for the gold price.
📊Technical side:
Although the 1-hour moving average is still in a dead cross short arrangement, there are signs of turning around. At the same time, after the rebound, gold began to consolidate at a high level instead of continuing to fall, so the momentum of the bears was weakened. So today's closing is critical. Today, gold fell back to around 3230 under pressure from 3270. In the short term, this is a balance range. You can see the shock in this range at night. If gold finally closes above 3270, then gold will most likely continue to rise next week. If it closes below 3240, then gold bears still have a great chance. If you want to operate in the short term, then don't chase it for the time being. Since it is a shock, you can go short first at a high level. If it breaks through 3270, then wait until next week. On the whole, today's short-term operation of gold suggests that the rebound is mainly short, and the callback is supplemented by long. The top short-term focus is on the first-line resistance of 3265-3270, and the bottom short-term focus is on the first-line support of 3200-3197.
🎯Practical strategies:
Strategy 1: Go short when gold rebounds around 3263-3266, with a target around 3230-3210.
Strategy 2: Go long when gold pulls back around 3197-3200, with a target around 3220-3230.

Gold trend layout in the evening after the release of NFP data🗞News side:
1. Pay attention to the recent trade situation and news about the Fed's interest rate cuts
2. Be wary of DXY trends
3. The situation of the Russian-Ukrainian war and the follow-up events of the India-Pakistan conflict
📈Technical aspects:
The short orders in hand have already been profitable, and gold is now back near 3250, while the US dollar index has once again fallen by 100, reaching around 99.6, and the 1H moving average is currently showing signs of turning upward. The upper and lower shadow lines of the 1H K-line closing look like cross stars of equal length, which means that things may go wrong, and gold may rebound upwards in the short term. We can still focus on the resistance of 3260-3270 above, and further focus on the first-line resistance of 3280-3286, while the bottom has never been able to effectively break through the first-line support of 3240. If this week closes at 3240, then the market outlook next week will be conducive to long trading.
Intraday operation suggestions
🎁SELL 3260-3270
🎁TP 3245-3240
🎁BUY 3230-3240
🎁TP 3260-3270
If you agree with this point of view, or you have a better idea, please leave a message in the comment area. I look forward to hearing different voices.
OANDA:XAUUSD FX:XAUUSD FXOPEN:XAUUSD FOREXCOM:XAUUSD TVC:GOLD
Non-agriculture ended perfectly, Today’s closing is key!📌Fundamentals:
The US April non-farm payrolls data (177,000 new jobs) exceeded expectations, reinforcing the Fed's expectations of a smaller rate cut. The market's expectations for rate cuts this year have been lowered from 90 basis points to 85 basis points, and the strengthening of the US dollar has suppressed gold prices.
📊Technical aspects:
From the 4-hour analysis, gold fell after the negative news of non-farm payrolls today, but gold bottomed out and rebounded, and continued to fluctuate. It feels that non-farm payrolls have gradually lost its charm, and the market is not as good as usual. However, today's closing is very critical, and it is also the key to whether gold will turn around. The non-farm payrolls market has basically finished, and the upper side continues to pay attention to the suppression of 3260-68, focusing on the suppression of 3290-95 above, and the short-term support near 3235-3240 below.
🎯Practical strategies:
1. Go short when gold rebounds at 3260-65, cover short positions at 3378-85, and target 3240-3245.

Non-agricultural prospective data analysis Operation suggestions📌Fundamentals:
📊Technical aspects:
Technically, spot gold is in a downward trend in the short term, and there is a certain rebound or shock at the key support level. At the 4-hour level, the gold price is running above the lower track of the Bollinger Band, and the opening shows signs of contraction. The MACD indicator dead cross is gradually closing, and the RSI indicator is running in the 35-45 range, showing that the long and short forces are relatively balanced.
🎯Practical strategy:
3260-3270 light position short, target 3225-3200. When it reaches 3225-3200 and stabilizes, try to go long, target 3250-3270.

Gold Technical Update (4H Time Frame) / Gold BullishAs we mentioned last week, gold was consolidating on the 4H time frame. After the breakout, all our projected targets were successfully achieved as of yesterday.
Currently, gold is forming a bullish flag pattern on the 4H chart — a continuation pattern that often signals the potential for further upside.
If gold sustains above the 3275–3280 zone, we may see renewed bullish momentum with the following potential targets:
Target 1: 3300
Target 2: 3340
Target 3: 3360
Target 4: 3400
⚠️ This is a technical analysis-based outlook. Traders are advised to manage their positions with proper risk-reward strategies and stay updated with market developments.

NF shows a volatile downward trend
📌 Gold Information
China's Ministry of Commerce announced on Friday that the United States has recently initiated communication through official channels, expressing interest in restarting tariff negotiations. Beijing is currently evaluating the proposal, which has sparked optimism that a solution to the long-standing tariff deadlock between the world's two largest economies is imminent.
New hopes for a breakthrough in trade negotiations helped the dollar rise to a three-week high on Thursday, pushing gold prices down towards the $3,200 mark. However, the dollar's bullish momentum remains weakened as the market increasingly digests expectations that the Federal Reserve may cut interest rates further, especially with the closely watched US non-farm payrolls data about to be released.
📊Comment Analysis
NF news volatility is certain, having accumulated significantly since last week. Gold price confirmed the trend after breaking through 3267, and fluctuated downward below 3200
💰Strategy Package
TP1: $3290
TP2: $3280
TP3: $3270🔥
Buy gold area: $3175 - $3177 SL $3170
TP1: $3185
TP2: $3200
TP3: $3210⭐️
⭐️ Note: Labaron hopes that traders can properly manage their funds
- Choose the number of lots that matches your funds
- Profit is 4-7% of the fund account
- Stop loss is 1-3% of the fund account

Maintain shock and short position before non-agricultural📌Fundamentals:
From the news perspective: the United States released a trade agreement and tariff reduction signal, the trade situation eased, resulting in a decline in market demand for safe-haven assets, triggering a sell-off in gold; the situation between Russia and Ukraine has eased, and the dawn of peace talks is approaching, which is a negative factor for gold; at the same time, the situation between India and Pakistan has heated up, which has supported the price of gold to a certain extent.
📊Technical aspects:
In the past few days, we have been emphasizing that gold should be bearish, and warned that gold is likely to break and fall sharply.
Gold, the general trend is as described in the continuous analysis. This round of price has fallen from the historical high of 3500. The first round of selling to 3260 rebounded to repair 3370; after rebounding to 3358 during the week, it weakened again, and the Asian market quickly sold off and fell below 3260. The subsequent analysis emphasized that the short-selling pattern of each cycle is good, and the shock bearish trend continued before the non-agricultural, and the target was adjusted to the parallel attack and defense range of 3193-3168;
European and American markets fluctuated and were bearish, which is in line with expectations; short-term resistance 3221, 3226, strong resistance 3231-3235; short-term support 3212, strong support 3202;
🎯Practical strategy:
It is recommended to rebound and sell: short near 3220-3230, target 10-15 points

Gold may rise further to $2955 - $3000CAPITALCOM:GOLD
Long above $2785 with targets at $2955.00 & $3000
But, below $2785 look for downside $2720 & $2650 targets.
Technically the RSI is above its neutrality area at 50.

Gold trading ideas after key data releaseOn the news front, the US April ISM manufacturing PMI was higher than expected, which led to the US Treasury bonds giving up their gains. From a technical analysis point of view, after the gold price fell out of the strong support of 3260 in the shock range, this position turned into the short-term resistance level for our short-term reference, followed by the position of multiple entity K-lines at the hourly level of 3275. There is a possibility of breaking through 3260 in the later period, so 3275 can also be treated as a defensive position.
Although the price of gold has been hovering around 3220, our main bearish direction remains unchanged in the short term. The trading strategy given in the afternoon is still a reference. For rebound, first focus on the 3240-3250 first-line resistance, and further look at the top-bottom transition position of 3260-3270. You can participate in transactions in small batches. Below, focus on the 3210-3200 support, and if it falls below, look for the 3193 first-line.
TVC:GOLD FOREXCOM:XAUUSD FXOPEN:XAUUSD FX:XAUUSD OANDA:XAUUSD

Gold Analysis UpdateI believe this analysis is only getting started, so let's see what happens in the coming 24 hours or so as there is NFP tomorrow (from the time of this video).
Have a great rest of your day guys

Gold starts a unilateral decline?
📌 Gold information
U.S. stock indexes fell sharply in midday trading due to disappointing U.S. economic data. On Friday, the U.S. Department of Labor will release the crucial monthly employment report. This is likely to be the most important U.S. data point so far this year.
In other news, Dow Jones News Service reported: "Tariffs are beginning to bring pressure, prompting the Eastern giant to increase stimulus to support economic growth.
📊Comment analysis
For international gold, what you need to do now is to follow the market. Don't think about bottom fishing. You can do a short-term rebound during the day. When the market has clearly broken the structure, you should choose to believe in the technical side, rather than speculate on the next support. This will only be endless. At this stage, if you fail to bottom fishing, are you still ready to try again near the integer of 3200? This is not over yet. Even if it falls below 3200, the 3180 horizontal support will be immediately below.
This round of decline is about to completely give up the second rise in the front end, depending on 3180. This is why I just said that 3200 will immediately encounter a new support. The reason why many people choose to go long above 3240 is also because it is the first stage of the high platform of the front-end surge, and it is necessary to defend. Unfortunately, the defense is not successful now. In other words, if you want to go short next, you have to look at the continued decline. What are the characteristics of the continued decline? You certainly can't tolerate it having an excessive rebound, so don't think about any high-altitude trading strategy.
💰Strategy Package
Short position:
Actively participate at 3230 points, and the profit target is around 3200 points
⭐️ Note: Labaron hopes that traders can properly manage their funds
- Choose the number of lots that matches your funds
- Profit is 4-7% of the capital account
- Stop loss is 1-3% of the capital account

The short position continues to approach the expected point📌Fundamentals:
From the news perspective: the United States released a trade agreement and tariff reduction signal, the trade situation eased, resulting in a decline in market demand for safe-haven assets, triggering a sell-off in gold; the situation between Russia and Ukraine weakened, and the dawn of peace talks was approaching, which was a negative factor for gold; at the same time, the situation between India and Pakistan heated up, which supported the gold price to a certain extent.
📊Technical aspects:
In the past few days, we have been emphasizing that gold should be bearish, and reminded that gold is likely to break and fall sharply.
From a technical perspective: the lower track of the Bollinger band at the 4-hour level broke through, and there was no sign of stabilization. The support of $3,250/ounce turned into pressure, the downward channel has been opened, and MACD has walked out of the hovering area, and the downward momentum has been strengthened; at the daily level, the MACD indicator is dead cross running, and the KDJ indicator enters the oversold area, showing that the short-selling force has an absolute advantage.
The short-term short-selling force of spot gold is strong, and the gold price is in a downward trend. Before there is an obvious reversal signal, the short-term trend is still bearish.
🎯Practical strategy:
Recommendation to short on rebound: short around 3235-3245, target 3220-3200.

XAUUSDHello Traders! 👋
What are your thoughts on Gold?
After a strong upward move, gold entered a corrective phase upon reaching the $3500 resistance zone.
The current pullback is expected to extend toward the identified support area and the ascending trendline, where buying interest may reappear.
As long as gold holds above the support and trendline, the long-term trend remains bullish.
This correction could offer a buy-the-dip opportunity, with potential for a move back toward the recent highs.
Will gold find support and resume its rally? Share your thoughts below!
Don’t forget to like and share your thoughts in the comments! ❤️
