Gold continues to fall, is it expected to reach 3210-3200?Yesterday we mentioned that the market may present a convergent triangle pattern. Today, the gold price has indeed ushered in a wave of sharp declines at the opening of the Asian session, and has fallen below the key support of 3260, and the lowest level has reached 3221. At present, the 1H moving average is spreading downward. In the short term, gold is still in a downward trend and is in a correction to overbought. The gold price is expected to reach 3210-3200. If it falls below this support range, it may even test the previous low of 3193. But at the same time, the 1H RSI indicator has fallen into the oversold area. Therefore, in terms of news, we need to pay attention to the initial jobless claims and PMI data during the US trading session today, and beware of the rebound after the correction.
Many friends who have read my posts have reported that my trading ideas and strategies are very helpful to them. I always firmly believe that profitability is the criterion for measuring strength, and seizing the opportunity is the key to victory. I will post every day to share my trading strategies and ideas for free. If you have just entered the market and don’t know how to make more profits, if you are already in it but the harvest is not ideal, then you might consider taking a look at my profile.
TVC:GOLD FOREXCOM:XAUUSD FXOPEN:XAUUSD FX:XAUUSD OANDA:XAUUSD
Goldlong

GOLD BULLISH MOMENTUM SOONGold recently touched its all time high 3500 but it reversed immediately
so we expecting gold to go bullish it surpass the highlighted supply zone and bearish if its below it
Gold’s short trend intensifies! Main empty follow up.📌Fundamentals:
📊Technical aspects:
Gold, the price of this round has fallen from the historical high of 3500. After the first round of selling to 3260, it rebounded and repaired 3370; it rebounded to 3358 during the week and then weakened again. The Asian market opened with a rapid sell-off below 3260 and is now trading around 3234; the short position in each cycle is good, and the pre-non-agricultural market continues to be bearish. The target is adjusted to the parallel attack and defense range of 3193-3168.
Short-term resistance 3235-3240, strong resistance 3246-3250, 3260 is not expected to arrive; short-term support 3220, strong support 3210-3194.
🎯Practical strategy:
Recommendation to short on rebound: short around 3240-3250, target 3220-3200.

XAUUSD BUY setup Hi fellow traders, XAUUSD will be ready to make a move higher from the blue box after it completes the double correction. Target the 3380.17 level. Good luck and trade safe!

Dollar Doomsayers Are Dead Wrong: Why USD Will Crush It in 2025.Road To a Million fam! It’s your boy, back from the wilderness after a hiatus that felt longer than a bear market in a crypto crash. I’m pumped to be here, ready to drop some truth bombs, dissect the markets, and—most importantly—help us all make some serious bank. Buckle up, because there’s a ton to unpack, and we’re diving headfirst into the biggest elephant in the room: the U.S. dollar (USD). Spoiler alert: it’s not dead, it’s not even close to dead, and anyone saying otherwise is probably shorting it while crying into their latte. Let’s get into it!
The Dollar Drama: What’s the Deal?
If you’ve been anywhere near a financial newsfeed in 2025, you’ve heard the doomsday choir singing, “The dollar is done! Kaput! Finito!” The Dollar Index (DXY) is down 8% this year, and the Twitter (sorry, X) finance bros are out here proclaiming the end of the greenback’s reign as the world’s reserve currency. They’re screaming about de-dollarization, BRICS taking over, and gold mooning like it’s 1971. Meanwhile, I’m over here sipping my coffee, looking at the charts, and laughing. Why? Because the dollar’s obituary is the most exaggerated piece of fan fiction since Twilight.
Let’s cut through the noise and get to the meat. The USD has taken a beating, sure, but an 8% drop in a year doesn’t mean it’s packing its bags and moving to the Bahamas. The dollar is still the king of global trade, the backbone of international commerce, and the currency you need if you’re, say, India buying oil from Saudi Arabia. No one’s trading rupees for barrels, folks. They’re selling rupees, buying dollars, and getting that black gold. That’s the reality, and it’s not changing anytime soon.
So, why the panic? Why is everyone acting like the dollar’s about to be replaced by Dogecoin or a shiny new BRICS coin? Let’s break it down, roast the naysayers, and then talk about how we’re gonna make money off this drama. Because, let’s be real, that’s why you’re here.
Why the Dollar’s Down (But Not Out)
First, let’s address why the DXY is down 8% in 2025. The Dollar Index, for those new to the game, measures the USD against a basket of major currencies—56% euros, plus some GBP, JPY, CHF, CAD, AUD, and a sprinkle of others. It’s like a currency Thunderdome: one dollar enters, a bunch of others try to take it down. When the DXY drops, it means the USD is weakening relative to these currencies. But why?
Interest Rate Shenanigans: Central banks are the puppet masters of forex markets, and their interest rate moves are like plot twists in a soap opera. The U.S. Federal Reserve cut rates by 25 basis points to 4.25–4.5% on December 18, 2024, signaling a slightly dovish stance. Meanwhile, the Eurozone slashed its rate to 2.25% on April 17, 2025. That’s a 2% differential in favor of the U.S., which is huge in forex land. But the market’s been spooked by the Fed’s cut, thinking it’s the start of a softening cycle, while other central banks (like the ECB) are also cutting, creating a weird global rate limbo.
Inflation Tug-of-War: Inflation in the U.S. is at 2.4%, while the Eurozone’s at 2.2%. That means U.S. investors are getting a real return of about 2% (4.25% interest minus 2.4% inflation), while Eurozone investors are basically breaking even (2.25% minus 2.2% inflation). Money flows where it’s treated best, and right now, the U.S. is the VIP lounge. But short-term traders are freaking out over inflation fears and potential rate cuts, which has pressured the USD.
Trump’s Tariff Tantrums: Oh, Donald. The man’s back in the White House, tweeting (X-ing?) up a storm about “Making America Great Again” with tariffs left, right, and center. His trade war threats—10–20% tariffs on imports, 60% on Chinese goods—have markets jittery. A stronger dollar could make U.S. exports pricier, so some traders are betting on a weaker USD to balance things out. Spoiler: I think they’re wrong, and I’ll explain why later.
De-Dollarization Hype: The BRICS bloc (Brazil, Russia, India, China, South Africa, and friends) has been pushing for a non-USD trade system, with talks of a new currency or gold-backed system. This has fueled the “dollar is doomed” narrative. But let’s be real: a BRICS coin? Good luck getting China and India to agree on anything, let alone a unified currency. And gold? It’s ripping higher (more on that later), but it’s not replacing the USD for global trade anytime soon.
So, yeah, the dollar’s been punched in the face a few times this year. But it’s like Rocky Balboa—it’s taken worse beatings and still comes out swinging. The question is: Is this the end of the dollar’s dominance, or is it just warming up for a comeback? Let’s look at the big picture.
The Dollar Ain’t Going Anywhere (Here’s Why)
Listen up, because this is where I get on my soapbox and preach. The dollar is not dead. It’s not even on life support. If anything, it’s doing push-ups in the gym, getting ready to flex on the haters. Here’s why I’m so bullish on the USD, and why you should be too.
1. The Reserve Currency Superpower
The USD is the world’s reserve currency, and that’s not just a fancy title—it’s a superpower. Over 88% of global transactions (SWIFT data, 2024) are settled in USD. When Russia wants to sell gas to China, they often price it in dollars. When Brazil buys soybeans from Argentina, guess what? Dollars. Even countries with beef against the U.S. (looking at you, Iran) hold USD reserves because it’s the only currency universally accepted for trade.
Why does this matter? Because every country needs USD to play in the global sandbox. India’s not paying Canada for oil in rupees. They’re converting to USD or dipping into their dollar reserves. This creates constant demand for the greenback, and that demand isn’t vanishing overnight. Could it fade in a decade? Maybe. But in 2025? No chance.
And let’s talk alternatives. Bitcoin? Ha! It’s a speculative asset, not a stable currency for trade. Gold? It’s mooning (up 25% in 2025, per Bloomberg), but you’re not paying for a tanker of crude with gold bars. A BRICS currency? Good luck getting 10+ countries with conflicting agendas to agree on a logo, let alone a monetary policy. The USD’s reserve status is a fortress, and it’s not crumbling anytime soon.
2. Interest Rate Domination
Let’s talk money—specifically, where it flows. The U.S. has a Fed funds rate of 4.25–4.5%, while the Eurozone’s at 2.25%. That’s a 2% gap, which is like the Grand Canyon in forex terms. If you’re an investor, where are you parking your cash? In the U.S., where you’re earning a 2% real return (4.25% minus 2.4% inflation), or in the Eurozone, where you’re getting a big fat zero (2.25% minus 2.2% inflation)?
This is why the Eurozone’s in trouble. The ECB’s stuck in a trap—low rates to prop up struggling economies like Spain and Italy, but that makes the euro less attractive. Meanwhile, the U.S. is the cool kid at the party, attracting capital like moths to a flame. And don’t forget: the Eurozone’s a mess of 20 countries with one monetary policy but wildly different fiscal policies. Spain’s productivity isn’t Germany’s, no matter what the ECB pretends. The euro’s gonna weaken against the USD, mark my words.
3. Trump’s Dollar Rocket Fuel
Love him or hate him, Trump’s policies are about to light a fire under the USD. His “America First” agenda includes bringing manufacturing back to the U.S., which means building factories from scratch. Those factories need raw materials—steel, copper, you name it. And guess what currency they’ll use to buy that stuff? Ding, ding, ding—USD!
Plus, Trump’s tariffs (10–20% on imports, 60% on China, per Reuters) will reduce U.S. imports, meaning fewer dollars flowing out of the country. But foreign countries still need USD to repay their dollar-denominated debts (global USD debt is $13 trillion, per the BIS). Less USD supply, same demand? That’s a recipe for a stronger dollar. Trump’s shaking markets like a toddler with a snow globe, but in this case, it’s bullish for the USD.
4. Contrarian Goldmine
Here’s a little trading wisdom: when everyone’s screaming the same thing, they’re usually wrong. Right now, 99% of the finance world (or at least the loud ones on X) is saying the dollar’s toast. That kind of extreme sentiment is a red flag. Markets love to screw over the crowd, and when everyone’s shorting the USD, it means the bottom is either in or damn close.
I’m calling it: the DXY’s either bottomed already or will soon, probably around 97. When sentiment’s this bearish, it’s like the market’s handing you a gift-wrapped opportunity. And I’m not about to let it pass.
The Charts Don’t Lie: DXY Technical Breakdown
Alright, enough macro talk—let’s get to the fun stuff: charts. I’ve been staring at these squiggly lines for 20+ years, and they’re telling me the USD’s about to go on a tear. Let’s break it down, from the big picture to the nitty-gritty.
Long-Term View: The 20-Year Monthly Chart
Zoom out, fam. When in doubt, zoom out. I’m looking at the DXY on a monthly chart, going back to 2005. Each candle is one month, and the trend is crystal clear: up. The DXY’s been cruising in an ascending channel for two decades, like a train chugging along at 200 miles an hour. Sure, it’s hit some bumps—2008, 2011, 2020—but the direction’s undeniable.
Right now, the DXY’s sitting around 100, down from its 2024 highs. But it’s still within that bullish channel. I’m drawing trendlines here: a lower trendline connecting the lows (around 97–98) and an upper trendline around 120–125. The price is hugging the lower end, which screams “buying opportunity” to me.
My big-picture call? The DXY’s heading to 115–117 by late 2026 or early 2027, maybe even sooner (Jan 2026, anyone?). Why? Because a 20-year trend doesn’t reverse overnight. The dollar’s not dying—it’s just taking a breather before the next leg up. If you disagree, hit the comments. Let’s duke it out.
Short-Term View: The 4-Hour Chart
Now, let’s zoom in to the 4-hour chart for the past couple of months. The short-term trend’s been down, no question—DXY’s been sliding like a kid on a waterslide. But here’s where it gets juicy: I’m seeing a textbook inverse head-and-shoulders pattern. For the newbies, that’s a bullish reversal pattern, and it’s already played out like a charm.
Pattern Breakdown: The left shoulder formed in early April, the head hit a low around April 10, and the right shoulder wrapped up by April 21. The neckline (resistance) was around 99.8–100, and guess what? The DXY broke it like a champ.
Trendline Break: On top of that, the DXY smashed through a short-term downtrend line, confirming the bullish vibes.
RSI Divergence: Check the Relative Strength Index (RSI). From April 10 to April 21, the price made lower lows, but the RSI was making higher lows. That’s a classic bullish divergence, screaming, “The momentum’s shifting!” We jumped in when the trendline broke, and boom—profits are rolling in.
Price Targets and Trading Plan
Here’s the game plan, fam. The DXY’s already broken the neckline, so we’re in. Now, we’re watching these levels:
Immediate Target: 100.28
The DXY needs to close above 100.28 by the weekend (May 2–3, 2025). If it does, it’s go time. I’m telling you, go all in (responsibly, of course). This level’s key because it’s a minor resistance from prior price action. A close above it confirms the breakout.
Next Target: 103–103.5
This is the big one. The 103 zone is a major inflection point—tons of price action and clutter from earlier this year. If the DXY breaks 100.28, it’s got a clear path to 103. Expect some resistance around 100.27 (a support-turned-resistance level), but once it clears that, it’s smooth sailing to 103.
Probability: I’m giving this an 80% chance of heading higher, 20% chance of a pullback. Those are odds I’ll take any day.
Long-Term Goal: If the DXY follows its 20-year channel, we’re looking at 115–117 by 2026–2027. That’s not a pipe dream—that’s history repeating itself.
Trading Tip: We’re already positioned from the trendline break. If 100.28 breaks, scale up. If it pulls back to 97 (the lower trendline), that’s a dream buy zone. But don’t get caught in the daily noise—Trump’s tweets, CPI reports, whatever. Focus on the big picture.
Gold, Tariffs, and Trump: The Side Characters
I know you’re itching to talk gold, tariffs, and Trump’s wild ride. I’m saving the deep dive for another post (stay tuned!), but here’s the quick and dirty.
Gold: Gold’s up 25% in 2025 (Bloomberg), and everyone’s like, “See? Dollar’s dead!” Nah, fam. Gold’s ripping because of tariff fears, geopolitical chaos, and central banks hoarding it like Smaug. It’s not a dollar killer—it’s just doing its own thing. We’ll break it down soon.
Tariffs: Trump’s tariff plans (10–20% on imports, 60% on China) are shaking markets. They’ll make imports pricier, reduce USD outflows, and boost domestic demand for dollars. Bullish for USD, bearish for emerging markets. More on this later.
Trump: The man’s a market wrecking ball. He’s out here calling for lower rates one day, tariffs the next, and probably tweeting about aliens by Friday. But his manufacturing push and tariff policies are USD rocket fuel. Ignore the noise—focus on the policy.
Why You Should Care (And How to Profit)
Look, I get it. You’re not here for a PhD in economics—you’re here to make money. So, why should you care about the USD? Because it’s the backbone of the forex market, and where the DXY goes, opportunities follow. A stronger dollar means:
Forex Trades: Go long USD/EUR, USD/JPY, or even USD/CAD. The euro’s toast with that 2.25% rate, and the yen’s stuck in Japan’s low-rate purgatory (0.25%, per BOJ).
Stock Market Impact: A stronger USD could pressure U.S. multinationals (exports get pricier) but boost domestic firms. Think Walmart, not Apple.
Commodities: Oil and metals (priced in USD) could dip as the dollar rises. Short crude if you’re feeling spicy.
Emerging Markets: Countries with USD debt (like Turkey or Argentina) are gonna feel the heat. Avoid their currencies like the plague.
Here’s how we’re playing it at Edge-Forex:
Long DXY: We’re in at the trendline break, scaling up if 100.28 breaks. Target 103, then 115 long-term.
Risk Management: Keep stops tight below 99.5 (short-term) or 97 (long-term). Don’t bet the farm—markets love surprises.
Stay Nimble: Watch for Fed signals, ECB moves, or Trump’s next X rant. We’ll adjust as needed.
The Big Picture: Don’t Get Lost in the Noise
I know it’s tempting to get sucked into the daily drama—Trump’s latest outburst, a hot CPI print, or some X influencer shilling a “dollar crash” thesis. But trading’s about cutting through the noise. Zoom out. Look at the 20-year DXY chart. Look at the interest rate gap. Look at the USD’s reserve status. The dollar’s not going anywhere, and it’s about to remind everyone why it’s the boss.
My advice? Get out of the short-term clutter. Stop refreshing X every five minutes. Focus on the trends that matter: central bank rates, capital flows, and technical setups. The DXY’s setting up for a monster move, and we’re gonna ride it like surfers on a tsunami.
Wrapping It Up: Let’s Make Some Freaking Money
Alright, Edge-Forex fam, that’s the deal. The dollar’s not dead—it’s just been napping, and it’s about to wake up with a vengeance. The DXY’s forming a bottom, the charts are screaming “buy,” and the macro setup (rates, Trump, reserve status) is a bullish trifecta. We’re already positioned, and if 100.28 breaks, we’re going big.
I’m back, baby, and I’m here to drop regular updates, roast the haters, and help us all stack some serious profits. Got questions? Drop ‘em in the comments. Disagree with my DXY call? Bring it on—let’s debate. Just don’t be that guy shorting the dollar while the rest of us are cashing checks.
Stay tuned for the next post (gold’s getting its moment soon), and let’s make some freaking money together. Out!

GOLD | Breakout 4H Downward TrendExpecting some pullback and then Uptrend.
Possibility to short till 3000.
Then Long.

Gold Pushing Up
Hello Traders,
We have a good buy signal from the VPS (Volume Power System) in the gold market.

GOLD...LONGPYTH:XAUUSD
Market structure suggests is preparing for its next move.
The AND level will likely play a critical role in the upcoming direction.
** If structure breaks and confirms the shift, a new bias might form after the retest. **

How to trade when ADP comes?The selling opportunity was announced earlier. XAUUSD successfully reached TP3306 and 3280.
It is predicted that the market will reach 3250 again. So now is a good time to sell.
When ADP is bullish. Continue to short after the rebound. If it is bearish. Then go short. The target is 3250-3230

GOLD - Created 3 channel.Team,
buy gold now at 3236-3226
soft target at 3250-3256 - take 30%
medium at 3262-68 - take 50% volume
ABOVE 3280-3295 - all YOUR
STOP LOSS at 3205

Buy gold, there is a rebound in the short term!Fundamentals:
Focus on US economic data and Fed dynamics;
Technical aspects:
Gold fell below 3290 as expected, and even fell below 3280 beyond expectations. Our short positions also made a lot of money. At present, gold continues to fall to around 3272. Although the short momentum is relatively obvious, it is already close to the recent low support of 3265-3260. I think that before the NFP market, gold may not form a unilateral downward trend, so there are still repeated ups and downs in the short-term trend. Therefore, when approaching the low support area of 3265-3260, we might as well consider short-term long gold.
Trading strategy:
Consider going long gold in the 3275-3265 area, hoping that gold can rebound to the 3285-3295 area.

Wide fluctuations, short at high levels and long at low levelsIn terms of news, we need to pay close attention to the conflict between Russia and Ukraine and the recent conflict between India and Pakistan. Initial jobless claims and PMI data will be released on Thursday, and the unemployment rate and non-farm data for April will be watched on Friday.
Technical side, from the 4-hour analysis, the upper side continues to focus on the short-term suppression of 3320-3330, and further focuses on the suppression of 3345-56. The intraday rebound relies on 3320-3330 to short and continue to fall. The lower support is 3300-3290, and the short-term long-short strength and weakness watershed is 3270-3260. Before the daily level loses this position, continue to see long-short fluctuations, and participate in high-altitude low-multiple cycles. Do not chase orders.
Intraday trading strategy
SELL 3320-3330
TP 3300-3290
BUY 3260-3270
TP 3300-3310
If you agree with this point of view, or you have a better idea, please leave a message in the comment area. I look forward to hearing different voices.
OANDA:XAUUSD FX:XAUUSD FXOPEN:XAUUSD FOREXCOM:XAUUSD TVC:GOLD

Gold key resistance not broken, Continuation of weak shock!📌 Pattern analysis and attention:
📊Technical aspects: The current golden week maintains a range of 3260-3360 fluctuations, showing a weak oscillation pattern of falling first and then rising, but with stronger downward momentum. Technical aspects show that 3360 is a short-term long-short watershed. If it cannot be broken through, it will maintain low-level fluctuations; 3340 is the core key position. If it stands firm, it will turn into a strong oscillation, otherwise it will continue to be weak. The first two days of the week closed below 3320, confirming short-term weakness.
🎯Practical strategy: Short sell when it rebounds to 3320-3325 area, target 3310-3300.

Gold Key Points Summary How to grasp the end of the monthly line📌Fundamentals:
Trade policy easing and dollar rebound
Economic data and Fed policy game
Russia-Ukraine conflict and Middle East situation
📊Technical aspects:
From the 4-hour analysis, the upper side continues to focus on the short-term suppression of the 3328-35 line, focusing on the 3345-56 first-line suppression. During the day, the counterattack relies on this position to continue to bearish and continue to fall. The lower support is around 3290-85, and the short-term long-short strong and weak watershed is the 3260-65 first-line mark. Before the daily level does not fall below this position, we will continue to see long and short shocks, and the high-altitude low-multi cycle will mainly participate.
🎯Practical strategy:
1. Go short when gold rebounds at 3328-35, and cover short positions when it rebounds at 3343-52. Target 3310-3315, and look at 3275-80 if it breaks;

How to position the market after gold falls to around 3280Gold began to fall after rebounding to around 3313, and has now fallen below the important support of 3300. Looking at it now, gold is most likely to be a relay of the decline. The rebound of gold will continue to be bearish. The current 1-hour moving average of gold tends to stick together and diverge downward, and the decline is a bit sharp. If it continues to cross downwards to form a dead cross, then there is still room for gold shorts to fall. It is recommended to wait and see the support of the previous low of 3260. If the support is not broken, then consider going long. In the evening, we need to pay attention to the fluctuations that may be caused by ADP and PCE data.
Many friends who have read my posts have reported that my trading ideas and strategies are very helpful to them. I always firmly believe that profitability is the criterion for measuring strength, and seizing the opportunity is the key to victory. I will post every day to share my trading strategies and ideas for free. If you have just entered the market and don’t know how to make more profits, if you are already in it but the harvest is not ideal, then you might consider taking a look at my profile.
OANDA:XAUUSD FX:XAUUSD FOREXCOM:XAUUSD FXOPEN:XAUUSD TVC:GOLD

Gold Spot (XAU/USD) – Bullish Double Bottom BreakoutHello guys!
Yesterday we got our profit from gold!
It is a new one:
Gold has formed a clear double bottom on the 1H timeframe, accompanied by a bullish divergence—a classic signal of potential reversal. Following the breakout above neckline resistance, the price is currently in a retest phase, revisiting the breakout zone (now turned support).
🔹 Pattern: Double Bottom
🔹 Signal: Bullish Divergence
🔹 Breakout: Confirmed
🔹 Support Zone: ~$3,300–$3,305
🔹 Target: ~$3,375–$3,385
The bullish scenario remains valid as long as the price holds above the support area. A failure to hold may invalidate the setup and lead to further consolidation or decline.
📌 Watch for bullish price action near the retest zone for potential entries.

Gold (XAU/USD) Intraday Buy Setup with High Reward-to-Risk Ratio1. Entry Point Zone: Around 3,271.79 USD
This is identified as a potential buy entry area, marked in purple.
2. Stop Loss: Below the entry point at 3,257.71 USD
Risk management level in case the trade moves against the setup.
3. Target Point One: Between 3,313.75 and 3,317.07 USD
A short-term take-profit level, likely based on previous resistance.
4. Final Target (EA Target Point): Around 3,373.04 USD
A more ambitious take-profit, possibly based on a major resistance level or Fibonacci extension.
5. Trade Range:
Risk: 3,271.79 - 3,257.71 = 14.08 USD
Reward to First Target: ~42 USD

XAUUSD quick BUY tradeHi fellow traders, XAUUSD will be ready to make a move higher from the blue box after completing the correction. Target the 3334.67 level. Good luck and trade safe!

Gold fluctuates and is bearish, waiting for NF
📌 Policy factors
Gold prices (XAU/USD) continued to fall, falling to $3,310 in the current European session on Wednesday, as signs of improved global risk sentiment and easing trade tensions curbed demand for safe-haven assets. Market participants remained cautious ahead of the release of major US economic data, including ADP employment changes, core PCE price index and first quarter GDP preliminary values, all of which are scheduled to be released later today.
It is reported that President Trump suddenly signed an executive order to provide automakers with up to 15% tariff rebates to ease the impact of his auto tariff policy. Even more unexpectedly, US Commerce Secretary Lutnick revealed that a trade agreement had been reached secretly with a certain country. These major changes immediately triggered a strong market reaction.
📊Comment Analysis
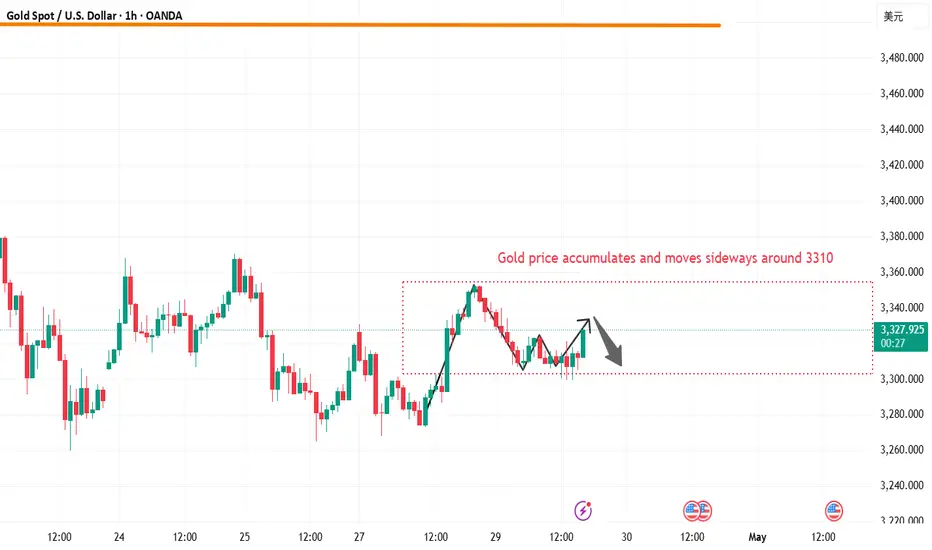
Gold price maintains the accumulation range of 3265-3360, temporarily stable and waiting for large fluctuations
💰Strategy Package
🔥Sell gold area: 3368-3370 SL 3375
TP1: $3350
TP2: $3340
TP3: $3330
🔥Buy gold area: $3264-$3262 SL $3257
TP1: $3280
TP2: $3300
TP3: $3318
🔥Buy gold area: $3285-$3283 SL $3280 scalping
TP1: $3290
TP2: $3295
TP3: $3300
⭐️ Note: Labaron hopes that traders can properly manage their funds
- Choose the number of lots that matches your funds
- Profit is 4-7% of the capital account
- Stop loss is 1-3% of the capital account

Gold insights: 30-APRIL-2025Rise and shine, traders! Start your day with actionable Gold insights. Let's grow your skills together, one chart at a time.

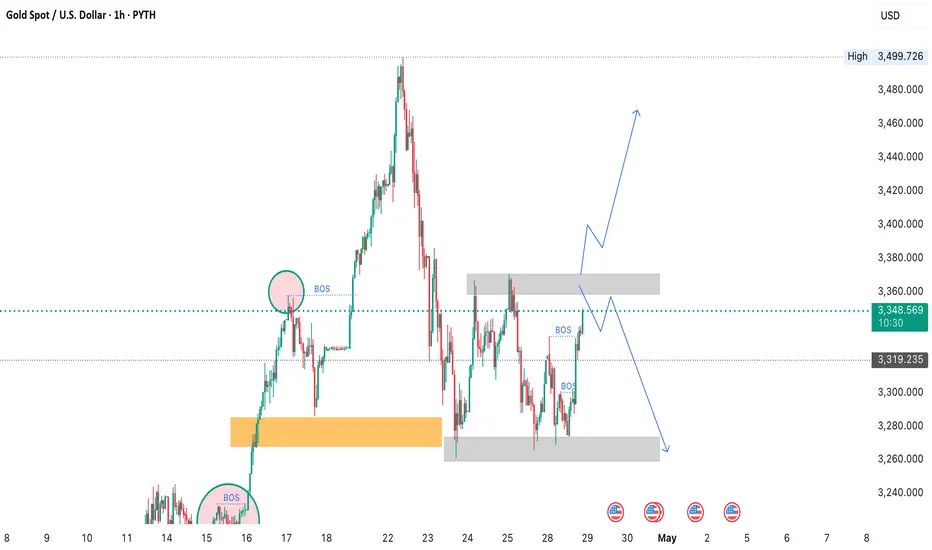
(XAU/USD) 1H Chart: Long Setup Targeting 3,500 with Key Support Entry Point: Suggested near 3,301.51 USD (marked with the purple support zone).
Stop Loss Zone: Below 3,266.87 to 3,221.67 USD (marked in blue and purple). This is where you limit your loss if the trade goes wrong.
First Target (Target Point One): 3,376.65 USD.
Final Target (EA Target Point): 3,523.55 USD (~8.26% potential gain from entry).
Main Setup Idea:
The price is consolidating around the support zone.
There's a plan to buy (go long) at the purple zone (Entry Point) and aim for the two target points

XAUUSD (Gold)As we can see from overall perspective that Gold is still very bullish.
From technical and fundamental angle, everything sustains a bullish trend.
This is an opportunity to join the bullish trend.

Shorting opportunities are coming near 3330 in the US market!
📌 Driving events
Because the easing of US-China trade tensions has weakened gold's safe-haven appeal, while investors are waiting for US economic data to assess the Fed's policy direction. Gold has been in a range recently as the market now waits for details of the first trade agreement, which is expected to be announced this week or next week.
📊Comment analysis
Gold reached a turning point last week, with Trump making some very positive comments, while stagflation risks continued to be excluded, and gold continued to fall. Stagflation pricing has driven gold prices higher, and as the market begins to exclude this risk, it is normal for a correction to occur, especially considering that "long gold" has become one of the most crowded trades.
💰Strategy Package
Short position:
Actively participate around 3330 points, profit target around 3300 points
⭐️ Note: Labaron hopes that traders can properly manage their funds
- Choose the number of lots that matches your funds
- Profit is 4-7% of the fund account
- Stop loss is 1-3% of the fund account