XAUUSD(GOLD) NEXT MOVE ?**Detailed analysis** of the Gold Spot (XAU/USD) chart, combining technical insights **with the current geopolitical market backdrop**, particularly the **Trump tariffs escalation**:
---
### 🟡 **XAU/USD (Gold) – Technical & Fundamental Outlook**
**Timeframe:** 1-Hour
**Current Price:** $3,296
**Target Price:** $3,500
---
### 📌 **Technical Chart Analysis: Bullish Breakout in Play**
From a trader’s lens, this chart illustrates a **classic bullish continuation setup**:
#### 🔺 **Triangle Breakouts**
- The chart highlights two previous **symmetrical triangle patterns**, both of which resolved **to the upside**.
- These triangles signal healthy consolidation before **impulsive bullish rallies**, indicating strong **market structure**.
#### 📈 **Price Action Strength**
- Price recently **broke out** from another mini triangle (~$3,230 zone), confirming bullish momentum.
- The breakout is **sharp and directional**, showing strong buyer interest.
#### 🧱 **Support & Structure**
- Price is respecting an **ascending trendline**, confirming **higher lows** and a consistent **bullish trend**.
- Each consolidation phase was tighter, indicating **volatility compression before explosive moves**.
#### 🎯 **Target Projection: $3,500**
- Based on **measured moves** from previous breakouts and current momentum, $3,500 is a **realistic short-term target**.
- Price remains inside a **bullish channel**, and breakout continuation aligns with the upper resistance projection.
---
### 🌍 **Current Market Context: Trump’s Tariff Shock & Safe Haven Demand**
Amid strong technicals, the **macroeconomic backdrop adds fuel to gold’s rally**:
#### 🔥 **Trump's Tariff Escalation**
- Former President **Donald Trump has reactivated aggressive tariff rhetoric**, with reports of a **104% tariff on Chinese imports**, prompting **retaliatory action from China** (an 84% counter-tariff).
- This **reignites U.S.-China trade tensions**, increasing **global market uncertainty**.
#### 🛡️ **Flight to Safety**
- Investors are rapidly **rotating into safe-haven assets**, especially gold, due to:
- Trade war concerns
- Recession expectations
- Dollar instability fears
#### 💬 **Market Sentiment**
> “In times of uncertainty, gold shines brightest. Trump's economic aggression has global investors hedging risks, and XAU/USD is the first in line to benefit.”
---
### 💼 **Trading Strategy Summary**
| Component | Details |
|------------------|-------------------------------|
| 📈 Bias | Bullish |
| 💰 Entry Zone | Breakout above $3,230 |
| 🎯 Target | $3,500 |
| 🛑 Stop-Loss | Below $3,180 (tight structure)|
---
### ✅ **Conclusion**
With **Trump’s trade war** rhetoric back in motion and **technical confirmation of a breakout**, gold is positioned for another **major rally**. A push toward **$3,500** is not just possible — it’s probable, as long as the structure holds. This is a time to **ride the momentum**, not fight it.
--
Goldlong

The early bird gets the worm.The 1-hour moving average of gold has begun to turn upward. If the 1-hour moving average of gold continues to diverge upward, then the gold bulls will continue to exert their strength. After gold breaks through 3245, then 3245 has formed a short-term support for gold. After gold rises, we must wait patiently for adjustments and continue to go long.
Trading ideas: Buy gold near 3250, stop loss 3240, target 3280

Gold trading zones: 16-APRIL-2025Stay ahead with today's Gold trading zones. Enhance your market insights and trade carefully.

Gold reached 3275 and will continue to move towards new highs
📌 Driving Events
Kitco Metals senior analyst Jim Wyckoff pointed out: "The gold market is waiting for new catalysts, but the technical side remains strong and the safe-haven demand remains solid." It is worth noting that the US government has recently launched an investigation into the import of drugs and semiconductors in preparation for the imposition of tariffs. Trump has also made it clear that the details of the semiconductor import tariff will be announced this week.
💢 Investors please pay close attention to the following key events:
Fed Chairman Powell's speech on Wednesday (interest rate policy orientation)
US retail sales data on Wednesday
ECB interest rate decision on Thursday (expected to cut interest rates by 25 basis points)
Specific implementation details of Trump's tariff policy
📊Comment analysis
In my previous post interpretation, I suggested that the gold price should be sideways, waiting for the price to continue to rise to a new high. Today, Wednesday (April 16), the Asian market broke a new high as expected in the early trading. As of now, the gold price is $3275
Now after two days of adjustment, the gold price has broken through again, and the resistance level of 3255 has also turned into support. The next step is 3280 and 3300.
Follow the trend, participate in one direction, and continue to be long today.
💰Strategy Package
Long position:
Actively participate at 3270-3275 points, profit target above 3295 points
Steady participation at 3250-3260 points, profit target above 3280 points
⭐️ Note: Labaron hopes that traders can properly manage their funds
- Choose the number of lots that matches your funds
- Profit is 4-7% of the fund account
- Stop loss is 1-3% of the fund account

Gold Price Analysis April 15Frame D shows some selling pressure that could be profit-taking by investors but has not yet confirmed the appearance of a downtrend.
The h4 wave structure is still leaning towards the bulls quite a bit when the 3215 zone has been noticed by buyers
Gold is rejecting the 3232 price zone, trading around 3223, creating a fairly important resistance zone at 3232.
Trading scenario This decline is still quite strong and can decrease to the support zone of break out 3215. In the US session, pay attention to the price reaction of this zone to buy. If it bounces strongly from 3215, you can consider holding it long. On the contrary, if it breaks through 3215, 3203 is the destination for the SELL signal. 3237 is an important resistance zone today. If the price breaks this zone, it will confirm an ATH in the US session.

Gold XAUUSD Possible Setup 15/04/2025🧠 Technical Analysis:
Trend Structure:
The price was following a short-term ascending channel (bullish structure).
Recently, price broke below the lower trendline, indicating a potential bearish shift.
Support Zones:
First support zone: 3210–3214
This is a minor support and could serve as the first potential bounce area.
Second support zone: 3189–3194
This is a stronger historical demand zone. Stronger bounce expected from here if the price continues falling.
Resistance Zone:
Around 3241–3245, which is the recent high and also aligns with prior resistance.
Price Action:
Bearish engulfing candles and a break below the trendline indicate bearish momentum in the short term.
Current price: ~3219. If selling pressure continues, price might retest 3210 or even 3190.
📉 Trading Signal:
✅ Buy Signal 1 – Aggressive Entry
Entry Zone: 3210–3214
SL: Below 3203
TP1: 3235
TP2: 3245
RR: ~1:2+
✅ Buy Signal 2 – Conservative Entry
Entry Zone: 3189–3194
SL: Below 3182
TP1: 3210
TP2: 3235
RR: ~1:3+
📌 Note: Wait for bullish confirmation (e.g., bullish engulfing or pin bar) near either support zone before entering.
🔄 Summary:
Price broke ascending structure = short-term bearish
Look to buy from 3210–3214 (aggressive) or 3189–3194 (conservative) on bullish confirmation.
Hit follow, like and comment.

Gold’s latest strategic ideas, mainly short selling on reboundOn Monday (April 14), gold fluctuated slightly and remained around $3,197. Last Friday (April 11), the price of gold broke through $3,200, reaching a historical high of $3,245.26, with a weekly increase of 6.6%, the largest weekly increase since March 2020. This round of rise was mainly driven by the escalation of trade frictions, the plunge of the US dollar, the increase in expectations of the Federal Reserve's interest rate cuts and geopolitical risks. The weak US economic data and rising inflation expectations strengthened the safe-haven properties of gold.
From a technical perspective, the daily level shows short-term correction pressure. On Monday, a small negative column with a long upper shadow was closed. Pay attention to the support of 3180 below. If it falls below, it may fall further. The 4-hour level shows a high-level oscillation pattern, with the upper resistance at 3235-3240 and the lower support around 3200-3180. In terms of operation, it is recommended to focus on high-altitude trading: shorting with a light position near 3225-3235 US dollars. If the gold price rebounds to around 3200 and stabilizes, you can try short-term long. Be alert to the intensification of market volatility.
Gold recommendation: shorting near 3225-3235 on the rebound, target 3205.

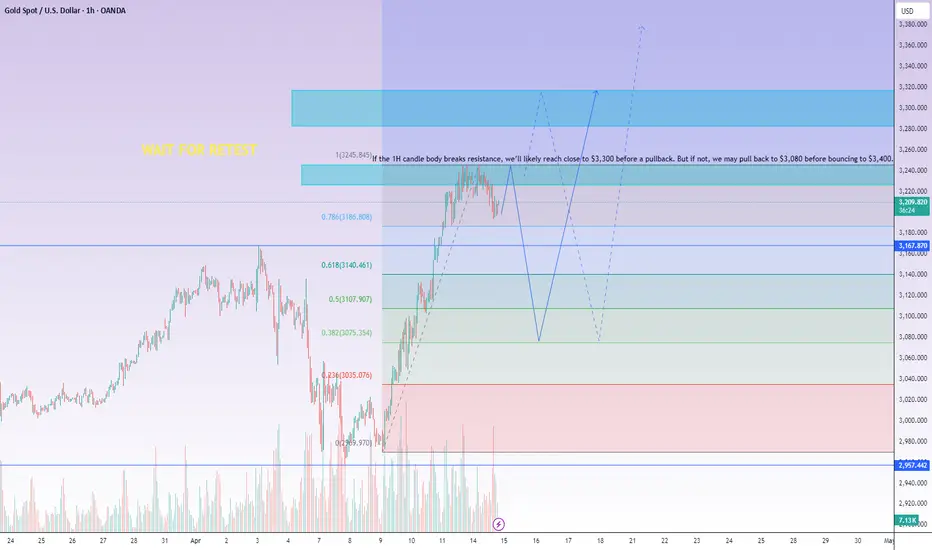
GOLD (XAU/USD) at ATH – Two Key Scenarios to WatchGold has reached ATH, and we're currently testing a critical resistance zone. Look at my previous published post, perfectly played out and we're just getting started.
📈 Scenario 1: If the 1H candle body breaks above resistance with a confirmed close, we’re likely to see a push toward the $3,300 level before a potential pullback toward $3100
📉 Scenario 2: If we fail to break resistance, a pullback toward the $3,100 zone is expected before a bounce back to $3,350.
Wait for a retest confirmation on the 1H candle body closure before taking any position.
Updates will be published!
XAUUSD Analysis todayHello traders, this is a complete multiple timeframe analysis of this pair. We see could find significant trading opportunities as per analysis upon price action confirmation we may take this trade. Smash the like button if you find value in this analysis and drop a comment if you have any questions or let me know which pair to cover in my next analysis.

Sideways, continue to wait for a new ATH of 3270
📌 Driving Events
Bloomberg reported that gold prices climbed to near record highs as the United States planned to impose more tariffs, further exacerbating investor anxiety.
Bloomberg reported that the Trump administration launched an investigation into semiconductor and pharmaceutical imports, paving the way for tariffs
📊Comment Analysis
Gold prices are sideways, waiting for prices to rise and continue to hit new highs
💰Strategy Package
Long positions:
Actively participate at 3225-3235 points, with a profit target above 3240 points
Short positions:
Actively participate at 3245 points, with a profit target below 3230 points
⭐️ Note: Labaron hopes that traders can manage their funds properly
- Choose a lot size that matches your funds
- Profit is 4-7% of the fund account
- Stop loss is 1-3% of the fund account

Gold trading zones: 15-APRIL-2025Today's Gold trading zones: A starting point for your market analysis.

Gold, adjustment is a buying opportunity
📌 Driving events
At the critical moment of the tariff war, there were signs of easing, but the market did not buy it when it came to the gold market. The US policy changed faster than turning a book, which made the market overwhelmed. Therefore, even if the latest US statement was somewhat easing, gold did not fall as a result. The current market is an extreme casino, which depends entirely on whether the correct trading signals and entry timing are grasped in time.
After the tariff war, major investment banks have recently raised their expectations for gold prices this year. Goldman Sachs' latest forecast is that the gold price may rise to $3,700 this year. In extreme cases, the gold price may hit $4,200. This forecast seems unreliable, but it is actually very mysterious. Goldman Sachs' forecasts cannot be all accurate, nor can they be all inaccurate. What does this extreme situation refer to? Obviously, there are only two points, the first is the economy, and the second is the war. Apart from these two points, there is no more significant news that can push the gold price to $4,200.
So, is it possible for the current fundamentals to have the situation predicted by Goldman Sachs? Obviously, there is. The global trade war initiated by Trump will cause all economic turmoil, and the economy will enter an accelerated recession. In addition, the United States attempts to take down Iran in order to control the Middle East and raise oil prices. If a war breaks out in Iran, the Strait of Hormuz, the lifeline of oil in the entire Middle East, will be blocked, and oil may rise to a rare height. This is the purpose of the United States. Once the above two situations occur at the same time, it is not surprising that the price of gold rises to $4,200. Therefore, instead of predicting how much the price of gold will rise, it is better to pay attention to the real-time dynamics of the United States' tariff war and layout in the Middle East.
With 36 trillion U.S. debts hanging over his head, Trump is like a child who is desperate to lose, betting on the credit of the United States. Of course, the United States has the possibility of winning the bet. The tariff war is naturally impossible for the United States to win, but the United States will not lose. In the layout of the Middle East, the United States still has the probability of winning. Although Iran is the strongest combat force in the Middle East, the United States has been deeply involved in the Middle East for many years and has also won almost all the expected goals, and is experienced. The world is calling Trump a madman, a psychopath, and a fool. In my opinion, Trump is not crazy, but may be a king.
📊Commentary Analysis and 💰Strategy
I have said that any pullback in gold is an opportunity to get on board. Buy more when the pullback is big and buy less when the pullback is small. Although it is at a high level and the risk is extremely high, it is all assumptions. The fact is that gold has always been strong. The only thing to remember is that once you are afraid of heights, don't go short. You can be timid and watch the war, but you can't go against the trend.
After the tariff war eased, gold did not fall. After a slight adjustment yesterday, it did not continue the decline. It is now strong again and stands above 3230. It rose sharply due to the tariff war, but it did not fall sharply due to the easing of tariffs. There must be a reason. In terms of technical trends, gold 3190 area forms a new support platform, and the 4-hour level forms a high-level shock pattern. This high-level shock pattern is still bullish. Once it breaks through, it will start a new wave of upward trend. At present, the trend is good and the bullish trend remains unchanged.
The market fluctuates rapidly. We have already entered long orders near 3210 in the morning. Any intraday retracement support level is a long opportunity. We should grasp it flexibly.
⭐️ Note: Labaron hopes that traders can properly manage their funds
- Choose the number of lots that matches your funds
- Profit is 4-7% of the fund account
- Stop loss is 1-3% of the fund account

GS raises gold target to $4,000, UBS to $3,500 Goldman Sachs and UBS have issued another round of bullish forecasts for gold, citing ongoing market uncertainty (i.e., tariffs).
Goldman analysts now expect gold to reach $3,700 per ounce by the end of 2025, with a potential rise to $4,000 by mid-2026. UBS holds a slightly more conservative view, projecting $3,500 by December 2025.
Technically, gold has pulled back from new all-time highs seen during the Asian session but potentially remains in a strong uptrend. With prices trading well above both the 50-day EMA and 200-day EMA, shallow retracements may find support, especially as tariff-related risks persist for at least the next 90 days.

Bullish momentum is strong, keep an eye on key positions
📌 Driving events
Last week, China imposed a 125% tariff on US goods in retaliation for the US's 145% tariff, but then hinted that it would not respond to any further escalation of tariffs. Last weekend, President Donald Trump proposed the idea of levying a separate 20% tariff on Chinese semiconductors and electronics, suggesting that his strategy may shift from comprehensive tariffs to more targeted trade measures.
📊Commentary and analysis
Although there was a technical correction in the 1-hour gold trend, gold once retreated below 3197 to around 3195, but soon it was supported by bargain hunting again, suggesting that the underlying logic of this century's market is rock solid. When Fed officials are about to speak intensively, March PPI data hides inflation mystery, and geopolitical black swans continue to hover, every pullback of gold is accumulating power for the next round of charge. Historical experience shows that when there is a century-long divergence between physical assets and financial assets, it often indicates a large transfer of wealth at the civilization level.
Therefore, the gold price and the buying volume are maintained, and the upward trend continues: 3250, 3260
💰 Strategy package
Upper pressure - 3260-3280
Lower support - 3210-3200
Start time: Continue to go long near 3220
Take profit near 3240
Stop loss 3210
⭐️ Note: Labaron hopes that traders can properly manage their capital
- Choose the number of lots that matches your capital
- Profit equals 4-7% of the capital account
- Stop loss equals 1-3% of the capital account

XAUUSD Analysis todayHello traders, this is a complete multiple timeframe analysis of this pair. We see could find significant trading opportunities as per analysis upon price action confirmation we may take this trade. Smash the like button if you find value in this analysis and drop a comment if you have any questions or let me know which pair to cover in my next analysis.

Gold market analysis: 14-APRIL-2025Happy New week, check out our Gold market analysis: Today's zones for strategic decision-making.

XAUUSD Probable BUY 13/04/2025🧠 Technical Analysis – XAUUSD
📊 Chart Overview:
The market is currently consolidating near 3237, within a range-bound structure.
Two major zones are marked for potential entries:
Zone 1 (Near-Term Buy): 3217–3221 (support zone)
Zone 2 (Sniper Buy): 3173–3177 (gape/demand/strong support zone)
📈 Scenario 1 – Bullish Continuation from 3217/21:
If price pulls back to 3217–3221 and shows bullish confirmation (e.g., bullish engulfing, rejection wick), a buy setup can be triggered targeting:
TP1: 3237 (intraday resistance)
TP2: 3245 (supply/previous high)
Stop Loss (SL): Below 3210 for safe protection.
📉 Scenario 2 – Deep Rejection & Buy from 3173/77:
In case of a deeper retracement, price may wick down to 3173–3177, which is a high-probability sniper buy zone due to:
Previous strong bullish reaction from this level
Clean structure for liquidity grab
Entry here gives excellent risk-reward targeting the same levels:
TP1: 3219
TP2: 3245
SL: Below 3156 (wide but optimal for structure).
Like, follow, and share.

XAUUSD 3400 0n MarkThrough my weekly Episode multitime frame analysis , you will get deep insights .
Market in on rising channel since last year,our eyes will be at 3380 milestone on this weekly candle. First of all market is critical channel if any h4,D1 close below 3180 well see 3030 and 2950 in extension.

XAUUSD Analysis todayHello traders, this is a complete multiple timeframe analysis of this pair. We see could find significant trading opportunities as per analysis upon price action confirmation we may take this trade. Smash the like button if you find value in this analysis and drop a comment if you have any questions or let me know which pair to cover in my next analysis.

GOLD 1H CHART ROUTE MAP & TRADING PLAN FOR THE WEEKHey Everyone,
Please see our updated 1h chart levels and targets for the coming week.
We are seeing price play between two weighted levels with a gap above at 3261 and a gap below at 3230. We will need to see ema5 cross and lock on either weighted level to determine the next range.
We will see levels tested side by side until one of the weighted levels break and lock to confirm direction for the next range.
We will keep the above in mind when taking buys from dips. Our updated levels and weighted levels will allow us to track the movement down and then catch bounces up.
We will continue to buy dips using our support levels taking 30 to 40 pips. As stated before each of our level structures give 20 to 40 pip bounces, which is enough for a nice entry and exit. If you back test the levels we shared every week for the past 24 months, you can see how effectively they were used to trade with or against short/mid term swings and trends.
The swing range give bigger bounces then our weighted levels that's the difference between weighted levels and swing ranges.
BULLISH TARGET
3261
EMA5 CROSS AND LOCK ABOVE 3261 WILL OPEN THE FOLLOWING BULLISH TARGET
3292
EMA5 CROSS AND LOCK ABOVE 3292 WILL OPEN THE FOLLOWING BULLISH TARGET
3324
EMA5 CROSS AND LOCK ABOVE 3324 WILL OPEN THE FOLLOWING BULLISH TARGET
3352
BEARISH TARGETS
3230
EMA5 CROSS AND LOCK BELOW 3230 WILL OPEN THE FOLLOWING BEARISH TARGET
3201
EMA5 CROSS AND LOCK BELOW 3021 WILL OPEN THE RETRACEMENT RANGE
3179
3167
EMA5 CROSS AND LOCK BELOW 3167 WILL OPEN THE SWING RNGE
3120
3094
EMA5 CROSS AND LOCK BELOW 2975 WILL OPEN THE SECONDARY SWING RANGE
SECONDARY SWING RANGE
3069 - 3038
As always, we will keep you all updated with regular updates throughout the week and how we manage the active ideas and setups. Thank you all for your likes, comments and follows, we really appreciate it!
Mr Gold
GoldViewFX

gold (update)Hello friends
Due to the price growth, we have given you the analysis that the price will fall and the same thing happened. Now, due to the sharp decline, the price has entered the channel and the 3 specified areas are important support areas for us, where we can buy with risk and capital management and move towards the specified goals.
*Trade safely with us*

GOLD 4H CHART ROUTE MAP UPDATE & TRADING PLAN FOR THE WEEKHey Everyone,
Please see our updated 4h chart levels and targets for the coming week.
We are seeing price play between two weighted levels with a gap above at 3045 and 3078 due to ema5 lagging behind and a gap below at 3016. We will need to see ema5 cross and lock on either weighted level to determine the next range. We have a bigger range in play then usual.
We will see levels tested side by side until one of the weighted levels break and lock to confirm direction for the next range.
We will keep the above in mind when taking buys from dips. Our updated levels and weighted levels will allow us to track the movement down and then catch bounces up.
We will continue to buy dips using our support levels taking 30 to 40 pips. As stated before each of our level structures give 20 to 40 pip bounces, which is enough for a nice entry and exit. If you back test the levels we shared every week for the past 24 months, you can see how effectively they were used to trade with or against short/mid term swings and trends.
BULLISH TARGET
3241
EMA5 CROSS AND LOCK ABOVE 3270 WILL OPEN THE FOLLOWING BULLISH TARGET
3298
EMA5 CROSS AND LOCK ABOVE 3298 WILL OPEN THE FOLLOWING BULLISH TARGET
3329
BEARISH TARGETS
3205
EMA5 CROSS AND LOCK BELOW 3205 WILL OPEN THE FOLLOWING BEARISH TARGET
3178
EMA5 CROSS AND LOCK BELOW 3178 WILL OPEN THE FOLLOWING BEARISH TARGET
3137
EMA5 CROSS AND LOCK BELOW 3137 WILL OPEN THE FOLLOWING BEARISH TARGET
3108
EMA5 CROSS AND LOCK BELOW 3108 WILL OPEN THE SWING RANGE
SWING RANGE
3077 - 3046
As always, we will keep you all updated with regular updates throughout the week and how we manage the active ideas and setups. Thank you all for your likes, comments and follows, we really appreciate it!
Mr Gold
GoldViewFX

GoldXau usd daily analysis
Time frame daily
Risk rewards ratio =3
Target 3.190$
Price fell down to uptrend cross as you can see on the chart and now after we heard good news about Europe and USA economic relations and Middle East war( Iran and USA are on the sides of deal table) gold will reach to my target
