Analysis of gold market price structure and trends.Layout ideas。On Thursday, the US dollar index broke down sharply, successfully stimulating the market's risk-averse funds to return to the gold market again, and the gold price rose again. Let's briefly sort it out!
First: The tariff issue of the trade war caused the global market to plummet, and gold fell accordingly. The main reason was that it was necessary to sell gold, recover funds, and fill the capital margin in the stock market, foreign exchange market, and bond market; therefore, gold also plummeted downward in the past few days;
Second: The U.S. dollar index plummeted and broke through, driving market funds back into the gold market, and the gold price hit a record high again;
In yesterday's analysis of spot, you can look back at yesterday's analysis of the daily K indicator. There are two situations, restart Golden cross means breaking the top and reaching a new high. You can look back at yesterday's analysis. This is also a common indicator trend.
Spot gold opened yesterday from 3081 and quickly fell to 3071 before rebounding to around 3100. After that, the price fell back to 3078-80 and rose to around 3132. The price fell back to 3103 from around 3132 and then rebounded to around 3136 and bottomed out around 3113-16 and rose to 3175. The price fell from 3175 to around 3152-54 and then rose again to around 3176 and closed. The opening price fluctuated and rose above 3200. From yesterday's trend: 3180 and 3100 are the bottom supports, but the area around 3100 has fallen back and repaired yesterday, so 3132-36 and 3116 are the current support points. Yesterday, it also directly rose and broke through 3134-36 and then rose without stepping back. At the same time, the price rose to 3174-76 and then retreated to 3152-54, so the current support point is around 3176. The opening price directly rose from this position. Currently, 3190 is the nearest support. Comprehensive important support: ①3176 ②3134 ?③3100 ? The small support distribution in the middle is 3190-3167-3154-3115
Spot gold market analysis:
Ⅰ: Spot gold daily MACD golden cross is initially established, and the dynamic indicator STO quickly repairs upward, which represents the bullish trend of prices. At present, there is no resistance point to judge because it is a historical high, so we can only try it based on small cycle indicators. The current support point of the daily line is located near the MA5 and MA10 moving averages, 3096-3088, and it is not necessary to consider it far away from the candlestick chart.
Ⅱ: Spot gold 4-hour current MACD high golden cross oscillates with large volume, and the dynamic indicator STO is overbought, which represents high-level price fluctuations. Because the indicators are at relatively high levels, they may face short-term peak signals at any time. Currently, we focus on the support line of 3176 near the MA5 moving average.
Ⅲ: Spot gold hourly MACD golden cross is currently oscillating with large volume, and the dynamic indicator STO is running overbought, which means that the hourly line is still oscillating and strong. The current focus is on the 3245 line. If it breaks through 3245 this hour, it will continue to look for highs. Otherwise, a small cycle peaking signal will be formed at this position. The current support below the hourly line is located at the MA5 and MA10 moving averages, and the focus is on the MA10 support 3185 line. Comprehensive thinking: The current price is oscillating at a high level, and the short-term focus is on the 3245 line. If it breaks through, the price will continue to move upward. The current focus below is the support near 3190. If it falls below, the price may move to around 3150-3135.
Strategy: Currently, the 3440-50 area is temporarily set to see pressure adjustment
Go long if the key support is stabilized below, and pay attention to 3187-3170 -3153-you can go long
Goldlong

GOLD Ready to Break Highs Again! 🔥 3058 Level in Sight – Are You Ready? 🔥
📊 Market is following H4 Structure
📈 H4 BMS & OB in Play – Strong Momentum Building!
For detailed analysis & real-time updates, follow our TradingView page! 📍📩

GOLD(XAUUSD) -Weekly Forecast,Technical Analysis & Trading IdeasMidterm forecast:
2772.38 is a major support, while this level is not broken, the Midterm wave will be uptrend.
We will close our open trades, if the Midterm level 2772.38 is broken.
OANDA:XAUUSD TVC:GOLD
Technical analysis:
A peak is formed in daily chart at 3167.60 on 04/03/2025, so more losses to support(s) 3000.00, 2955.00, 2879.11 and minimum to Major Support (2772.38) is expected.
Take Profits:
2833.00
2879.11
2955.00
3000.00
3057.40
3100.00
3167.60
3200.00
__________________________________________________________________
❤️ If you find this helpful and want more FREE forecasts in TradingView,
. . . . . . . . Hit the 'BOOST' button 👍
. . . . . . . . . . . Drop some feedback in the comments below! (e.g., What did you find most useful? How can we improve?)
🙏 Your support is appreciated!
Now, it's your turn!
Be sure to leave a comment; let us know how you see this opportunity and forecast.
Have a successful week,
ForecastCity Support Team

GOLD Analysis: Will buyers push toward 3,230?OANDA:XAUUSD continues to trade within a clearly defined ascending channel, with price action consistently respecting both upper and lower boundaries. The recent price action suggests buyers are currently in control, indicating the potential for continued upside.
Given the strength of the current bullish momentum, there is a strong likelihood that price may break above the key resistance zone. If that happens, it could come back to retest the level as support before continuing higher. A successful retest would reinforce the bullish structure and open the door for a potential move toward the 3,230 target, which aligns with the channel’s upper boundary.
However, if price fails to break above the resistance zone, it could signal weakening bullish momentum and open the door for a deeper pullback toward the lower boundary of the ascending channel.
Always confirm your setups and manage your risk accordingly.
Best of luck!

Potential outside week and bullish potential for AUCEntry conditions:
(i) higher share price for ASX:AUC above the level of the potential outside week noted on 28th March (i.e.: above the level of $0.56).
Stop loss for the trade would be:
(i) below the low of the outside week on 26th March (i.e.: below $0.515), should the trade activate.

GOLD H1 Pro Levels Chart Update by FMPIn this chart you will find trend continuation levels of gold including psychological levels, blind structure levels with 3080 sequences

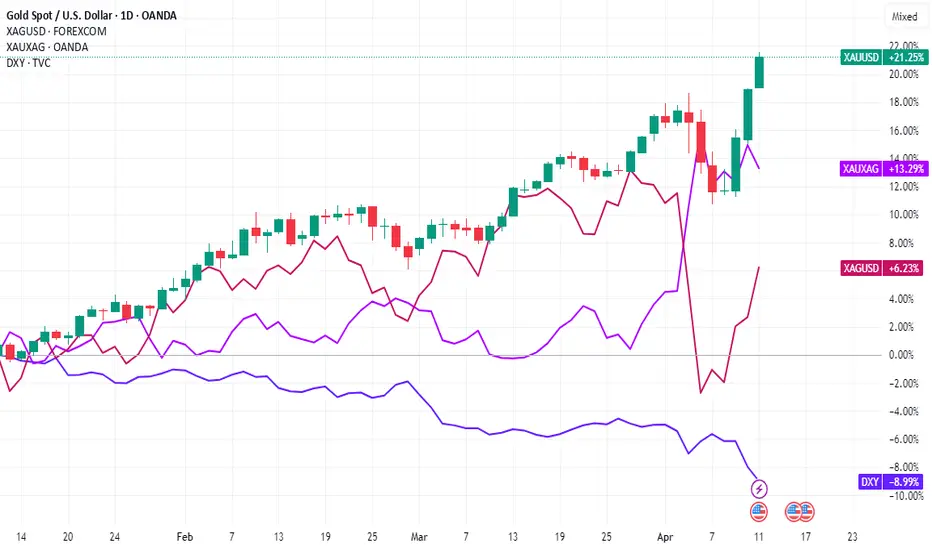
Gold & Silver Soar: Trade War RallyAnatomy of a Rally: How US-China Trade Tensions Propelled Gold to Record Highs and Lifted Silver
Introduction
The global financial landscape is frequently reshaped by geopolitical events, and few have cast as long a shadow in recent memory as the trade tensions between the United States and China. During periods of heightened friction, characterized by escalating tariffs, retaliatory measures, and pervasive economic uncertainty, markets often witness significant shifts in asset allocation. One of the most prominent beneficiaries during such times is gold. This document explores the dynamics behind gold prices reaching record highs amidst a US-China trade war, examining the multifaceted reasons for its ascent and noting the concurrent, significant rise in silver prices, which often move in tandem with the yellow metal due to overlapping market drivers.
The US-China Trade War: A Catalyst for Uncertainty
The trade conflict between the world's two largest economies represents more than just a dispute over tariffs and trade balances. It embodies a fundamental clash over technology, intellectual property, global influence, and differing economic models. The imposition of tariffs on hundreds of billions of dollars worth of goods creates direct economic consequences:
1. Increased Costs: Businesses face higher import costs, which can be absorbed (reducing profits), passed onto consumers (potentially fueling inflation), or lead to shifts in supply chains (causing disruption and inefficiency).
2. Reduced Trade Flows: Tariffs act as barriers, potentially dampening global trade volumes and impacting export-oriented economies.
3. Economic Growth Concerns: The uncertainty surrounding future trade policies makes businesses hesitant to invest and expand, potentially leading to slower global economic growth or even recessionary fears.
4. Supply Chain Disruptions: Companies reliant on cross-border supply chains face significant operational challenges, needing to find alternative suppliers or routes, often at higher costs and lower efficiency.
5. Currency Volatility: Trade disputes can lead to fluctuations in exchange rates, particularly involving the US dollar and the Chinese yuan, adding another layer of risk for international businesses and investors.
This pervasive uncertainty becomes a powerful driver pushing investors towards assets perceived as safe.
Gold: The Quintessential Safe Haven
Gold's reputation as a safe-haven asset is deeply ingrained in financial history. During times of economic stress, political instability, or market turmoil, investors flock to gold for several key reasons, all amplified by a US-China trade war:
1. Store of Value: Unlike fiat currencies, which can be devalued by inflation or government policy, gold is seen as retaining its intrinsic value over the long term. Fears that trade wars could lead to competitive currency devaluations or necessitate inflationary monetary policies (like extensive quantitative easing) make gold particularly attractive.
2. Hedging Against Uncertainty: When the outlook for traditional assets like stocks and bonds becomes cloudy due to geopolitical risks like a trade war, gold offers a perceived refuge. Its price often exhibits a low or negative correlation to equity markets during downturns, making it valuable for portfolio diversification.
3. Geopolitical Risk Premium: Major international conflicts or tensions invariably add a risk premium to gold prices. A trade war between global superpowers significantly elevates perceived geopolitical risk, prompting safe-haven buying.
4. Weakening US Dollar Potential: While the US dollar itself can act as a safe haven, a protracted trade war could raise questions about the US economic outlook or lead to policies aimed at weakening the dollar to boost exports. Since gold is typically priced in US dollars globally, a weaker dollar generally makes gold cheaper for holders of other currencies, potentially increasing demand and pushing the dollar price higher.
5. Central Bank Demand: In an environment of heightened geopolitical tension and questions surrounding the dominance of the US dollar, central banks (particularly those in emerging markets or nations seeking to reduce reliance on the USD) often increase their gold reserves. This diversification strategy provides a steady source of demand, underpinning prices. A US-China trade conflict could accelerate this trend among various nations.
6.
The Mechanics of the Price Surge
The record high in gold prices isn't just a passive reaction; it's driven by active market dynamics:
• Increased Investor Demand: Retail and institutional investors increase allocations to gold through physical bullion, gold futures contracts, and gold-backed Exchange Traded Funds (ETFs). Large inflows into major gold ETFs are often a visible indicator of this heightened demand.
• Speculative Activity: Traders in the futures market anticipate further price increases driven by the ongoing trade tensions and safe-haven flows, adding upward momentum.
• Sentiment: Market psychology plays a crucial role. As prices rise and news headlines focus on the trade war and gold's rally, a positive feedback loop can emerge, drawing in more buyers afraid of missing out (FOMO).
Silver's Ascent: Riding Gold's Coattails and Its Own Merits
Silver prices registering a steep rise alongside gold during such a period is a common phenomenon, though its drivers are slightly more complex:
1. Monetary Asset Correlation: Silver, like gold, has a long history as a monetary metal and store of value. It often trades as "poor man's gold," attracting investors seeking safe-haven exposure at a lower price point per ounce. During strong gold rallies driven by macroeconomic fear, silver typically follows suit.
2. Industrial Demand Component: Unlike gold, silver has significant industrial applications (electronics, solar panels, medical devices). This is a double-edged sword during a trade war. While safe-haven demand pulls prices up, fears of a trade-war-induced global economic slowdown could theoretically dampen industrial demand, potentially capping silver's gains relative to gold. However, in scenarios where safe-haven buying dominates market sentiment, this factor often takes a backseat initially.
3. Higher Volatility: Silver markets are smaller and typically more volatile than gold markets. This means that significant inflows driven by safe-haven sentiment can lead to sharper percentage gains (and potentially sharper losses during corrections) compared to gold. The "steep rise" noted is characteristic of silver's higher beta.
4. Gold-Silver Ratio: Traders often watch the gold-silver ratio (the number of silver ounces needed to buy one ounce of gold). When this ratio reaches historical extremes, some investors may buy silver, betting that it is undervalued relative to gold and that the ratio will revert closer to its historical mean. A major gold rally can stretch this ratio, triggering such trades and boosting silver demand.
Global Trends and Context
While the US-China trade war serves as a potent catalyst, it often occurs within a broader context of global trends that can support precious metal prices. These might include accommodative monetary policies from major central banks (low interest rates reduce the opportunity cost of holding non-yielding assets like gold), existing geopolitical hotspots beyond the US-China relationship, concerns about sovereign debt levels, or nascent inflationary pressures. The trade war acts as an accelerant, amplifying the impact of these underlying factors on gold and silver.
Conclusion
The surge of gold prices to record highs during a period marked by an intense US-China trade war is a textbook example of the metal fulfilling its traditional role as a premier safe-haven asset. The conflict breeds deep economic uncertainty, stokes fears of currency devaluation, heightens geopolitical risk perception, and potentially influences central bank reserve policies – all factors that historically drive capital towards gold. The simultaneous sharp rise in silver prices underscores its strong correlation with gold as a monetary asset, benefiting from the same wave of risk aversion, albeit with the added complexity of its industrial demand profile. Understanding these dynamics is crucial for investors navigating volatile periods, highlighting gold's enduring appeal as a portfolio diversifier and a refuge when storm clouds gather over the global economy, particularly when sparked by friction between major world powers.
Gold Xau (tf1M) Last Phase AccumulationGold Xau Last Phase Accumulation incoming 👇
"Way from 1500 to 4100" (+175%)
OANDA:XAUUSD
⏰ TimeFrame 1 Month
👉 Go to last phase accumulation
👉 White Trace
👉 Green Trace
👉 EMA 200 1M (White)
👉 Fib Measure as pattern "ExPanding Triangle" ( blue stick )
👉 Potential +175%
✔️Logarithmic (Log) Chart & Fib

Gold may face sharp fluctuations,The risk of downside increases!Technical analysis: Gold daily line rose by more than $100 on Thursday, creating a rare single-day increase in more than ten years. The cumulative increase in three days exceeded $200, and the technical indicators were overbought. The current gold price is in the stage of accelerating to the top. In the short term, pay attention to the resistance of the 3245-3250 area, and be alert to the risk of falling back after a high. Although the trend is still strong, the effectiveness of technical analysis is weakened under the guidance of news. It is recommended to focus on high altitude. This week is the fifth week of rising, and the probability of a change on Friday increases.
Ⅰ: The daily indicator macd golden cross is initially established, and the smart indicator sto quickly repairs upward, representing the bullish trend of the price. At present, because it is a historical high, there is no resistance point to judge, so we can only try it based on the small cycle indicators. The current support point of the daily line is located near the moving average MA5 and MA10, 3096-3088, and it is not considered to be far away from the candlestick chart.
Ⅱ: The current macd high golden cross in 4 hours is oscillating with large volume, and the smart indicator sto is overbought, which means that the price is oscillating at a high level. Because the indicators are at a relatively high level, they may face short-term peak signals at any time. Currently, we are focusing on the support line of 3176 near the MA5 moving average.
Ⅲ: The hourly MACD is currently oscillating with large volume, and the dynamic indicator STO is overbought, which means that the hourly line is still oscillating strongly. The current focus is on the 3220 line*. If it breaks through 3220 this hour, it will continue to look for a high point. Otherwise, a small cycle peak signal will be formed at this position. The current support below the hourly line is located at the MA5 and MA10 moving averages, and the focus is on the MA10 support line of 3185. Comprehensive thinking: The current price is oscillating at a high level, and the short-term focus is on the 3220 line*. If it breaks through, the price will continue to move upward. The current focus below is the support near 3190. If it falls below, the price may move to around 3150-3135.
Strategy: Refer to 3440-45 for short selling

Gold-----Buy near 3190, target 3200-3260Gold market analysis:
Gold has been rising strongly in the past two days. The daily line closed with a big positive line again. The bulls stood above 3200. The current highest is around 3219. The form and indicators are basically useless in such a market. What we need is a firm bullishness. In the past two days, there is a characteristic that it has risen and never looked back. It is basically a 40-point rise. In such a market, we either wait or buy directly without thinking. Today's Asian session gold hovered above 3200, and it can also be bought directly above 3200. Gold has created the largest increase and highest position in history. This wave of gold fluctuations is no longer a simple fundamental, but caused by the current international situation. The big rise is not the top. We continue to follow gold to buy. If there is no big accident today, the weekly gold line will close with a super big positive line again.
The daily support has reached around 3167. This position is the previous top and the current support. Today's gold continues to buy based on this position. Given the current strength, it is basically impossible not to fall back. Pay attention to the opportunity of a small fall back and buy directly. Today, I estimate that the Asian and European sessions will rise, and the US tail market will fall back.
Support 3200, 3180, suppression is really invisible, and the watershed of strength and weakness in the market is 3190.
Fundamental analysis:
The CPI announced yesterday did not have a big impact on the market, but the data difference was still relatively large, the result was -0.1%, and the bulls only rose slightly. The bottoming out and rebound of the US stock market was mainly due to Trump's withdrawal of some tariff policies.
Operational suggestions
Gold-----Buy near 3190, target 3200-3260

GOLD (XAU/USD) Hits ATH – Discover the Market EdgeHi Guys,
I’ve been testing my edge for the past 5 months, and it’s been crazy what I’ve discovered so far. It might sound a little wild, but there’s a way to compare another market that leads 3–5 days ahead and gives clear trend signals for Gold Futures — which moves in tandem with XAU/USD, with only a few dollars' difference.
You can see a pullback here, but sometimes it shoots straight to an all-time high. Taking current geopolitics into consideration, the markets are extremely volatile. Before Trump started the trade wars, I opened an account with 1:500 leverage (starting capital $150, grew to $500) and made significant profits just by catching the moves and trends I was able to predict.
From a math standpoint, if it were just coincidence, I would’ve been liquidated a long time ago. I’ve been through everything — this isn’t luck. I remember one day, I was watching Bloomberg live and the news anchor said, “I can’t believe gold is dropping,” — but I had predicted that move days earlier, haha! That was triple confirmation that I have an edge and that algorithms are actually following it.
There were also days when I expected a small pullback the next day, but it happened during the NY session because of some news — and it couldn’t push lower. Sellers in the TradingView chat was going crazy. The next day, during the London session, it started reaching the ATH (as I predicted). The pressure was intense, but the algorithm didn’t allow it to go lower than the previous low — and that structure came from my leading market edge!
In this case, the pullback might not happen — and if it doesn’t, we’ll break the current ATH and easily go long after that. As I mentioned, in these volatile markets, with tariffs going back and forth, the buying pressure and constant news are so intense that the market sometimes doesn’t even have time to make a pullback! If you have good capital and trade with low leverage, you can easily go long now and keep adding to your position with every pullback until we hit the new ATH!
Now, gold is going to reach a new ATH again — that’s 110%. I believe we’ll easily hit $3200+, followed by a pullback to around $3100.
Next gold move:
ATH: $3200 – $3350
Pullback: ~$3100
Re-test of ATH area — consolidation in that zone until the next major news event.

Insight into the gold market situation and seize the opportunityHello everyone! After in-depth research and analysis of the recent market conditions, I believe that the current market has entered the stage of accelerating to the top.
From a technical point of view, such as the MACD top divergence sign, the KDJ indicator oversold, etc., all signs show that the market's upward momentum is gradually weakening, while the price is rising rapidly, which is often a typical feature of the peak stage.
The focus needs to be on the 3225-3235 area. This range has important resistance significance and has dense locked-in disks. On the other hand, through technical analysis tools such as the Fibonacci sequence, this range is also an important pressure range.
For investors with short trading rights, this is a rare opportunity to go high and short. When the price reaches the 3225-3235 area, it is a relatively ideal time to enter the short market. The one-hour moving average golden cross is formed, but after the upper rail of the Bollinger band is broken, the technical overbought risk increases, and the support near 3150 is effective. 80 points are also possible, so don't look at the current trend with a conventional perspective.

Gold trading zones: 11-APRIL-2025Daily Gold trading zones: Identifying potential opportunities for informed traders.

GOLD MONTHLY CHART LONG TERM ROUTE MAP ANALYSISMonthly Time Frame Analysis for GOLD
Dear Traders,
Attached is the Monthly Chart Route Map for GOLD. Since October 2023, we have consistently analyzed and traded GOLD with 100% target accuracy. The Golden Circle areas marked on the chart highlight our precise analysis and successful target achievements.
Key Highlights:
* After successfully hitting TP1 and TP2, the candle has closed above TP2.
* EMA5 has crossed and locked above the TP2 level at 2603, confirming upward momentum.
* The EMA5 detachment process has been completed successfully.
* As previously noted, the Fair Value Gap (FVG) provided robust support at 2535, facilitating the upward push.
What’s Next for GOLD?
Based on these confirmations, we anticipate hitting TP3 this month. However, we have identified two significant GOLDTURN levels at 2702 and 2603.
In the short term, we may see some bearish movements, but the monthly chart reveals the bigger picture: a sustained long-term bullish trend. This kind of temporary reversal strengthens the bullish trend and offers an excellent opportunity to buy at dips near support levels, reducing risk.
Recommendations:
To understand the support structure in greater detail, refer to our smaller time frame analyses, which will help you identify optimal dip-buying opportunities while keeping the long-term gaps in mind.
As always, we’ll keep you updated with daily insights. Don’t forget to check our analyses on weekly, daily, 12H, 4H, and 1H time frames.
We appreciate your continued support! Please show your encouragement by liking, commenting, and sharing this post.
The Quantum Trading Mastery

GOLD WEEKLY CHART MID/LONG TERM ROUTE MAP UDPATEDWeekly GOLD Analysis – Quantum Trading Mastery
Hello Everyone,
Here’s the latest update on the GOLD weekly chart we’ve been diligently tracking and trading. Below is a comprehensive breakdown of the current range and key levels we’ve identified.
Recap of Last Week’s Analysis:
Last week, our predictions aligned perfectly with market movements:
* A strong resistance level at 2790 caused a short-term reversal near 2735.
* The FVG acted as dynamic support at 2735, sustaining the bullish momentum.
* The EMA5 crossed and locked above the key level at 2735, solidifying upward movement.
* As predicted, the resistance was broken, leading to a new all-time high of 2817.
Our analysis delivered precise predictions, allowing you to trade confidently and minimize risks.
What’s Next for GOLD This Week?
Key Level: 2735
Bullish Targets:
* TP1: 2877
* TP2: 3018
* TP3: 3160
Bearish Targets:
* 2735
* 2680
* 2595
This week, we have identified two critical GOLDTURN levels at 2735 and 2595. While we anticipate GOLD reaching TP1 at 2877, there may be short-term reversals around these key levels and GOLDTURN zones.
Recommendations:
To better understand the support structure and identify optimal dip-buying opportunities, review our smaller time-frame analyses (daily, 12H, 4H, and 1H). These insights will help you navigate the market with precision, keeping long-term gaps in perspective.
We’ll continue to provide daily updates and insights to keep you informed.
Thank you for your continued support! Don’t forget to like, comment, and share this post to help others benefit as well.
The Quantum Trading Mastery

GOLD WEEKLY CHART MID/LONG RANGE ROUTE MAP UPDATEDWeekly GOLD Analysis: February 2024
Hello Traders,
Here’s a weekly chart analysis of the GOLD, offering a comprehensive view of recent market trends and future predictions. Our diligent tracking since October 2023 has consistently delivered 100% target accuracy, as evidenced by the marked Golden Circle areas on the charts. Let’s dive into the highlights and what lies ahead.
Recap of Recent Successes
Weekly Chart Highlights:
Last week, the market flawlessly followed our predictions:
* Key Level 2735 ✅ DONE
* Entry Level 2735.88 ✅ DONE
* EMA5: Crossed and locked above Entry ✅ 2735 DONE
* Bullish Target TP1: 2877 ✅ DONE
* The FVG zone around 2735 sustained bullish momentum, while resistance was broken, leading to a new all-time high of 2886.
What’s Next for GOLD? Bullish or Bearish?
We anticipate continued bullish momentum with updated GOLDTURN levels and refined targets.
Key Level: 2735 remains critical.
EMA5 Behavior:
* If EMA5 holds above 2735 and crosses/locks above TP1 (2877), the next target is TP2 (3018), followed by TP3 (3160).
* A failure to hold above 2735 could indicate bearish momentum, prices will be retesting support at 2595 in the demand zone.
Recommendations & Strategy:
* Focus on EMA5: Its behavior near 2735 and TP1 will provide clear direction for short- and long-term trades.
* Support Levels: GOLDTURN levels at 2735 and 2595 are critical for identifying reversal zones and optimal dip-buying opportunities.
* For precise entry and exit points, review our daily, 12H, 4H, and 1H analyses to navigate the market confidently.
* Slight pullbacks may occur, with potential reversals near GOLDTURN levels.
* Long-Term Outlook: The monthly chart suggests sustained bullish momentum, offering excellent opportunities for dip-buying near key support zones.
Stay Updated:
We’ll continue to share daily updates, insights, and strategies on our TradingView channel and YouTube channel every Sunday. Don’t forget to like, comment, and share to support our work and help others benefit!
The Quantum Trading Mastery
