Gold Trade SetupI will risk!!!
It seems we are near at the end of correction wave...
The first target R/R is 2 and the second is 4...
Goldlongsetup

GOLD BUYI will be looking for buys as shown on the chart. If you agree, please show some love, and if you disagree, also show some love and let me know why you are not. Happy Trading, Happy Friday.
Gold Bounces Back After Testing Key Support📊 Market Drivers
• Gold dropped to around $3,352, touching a key support zone, then quickly rebounded to $3,373, gaining over +20 points.
• The rebound is supported by continued weakness in the US Dollar and slight easing in Treasury yields, keeping gold attractive as a safe haven.
• Although some optimism around US-Japan trade negotiations slightly reduced risk aversion, it wasn’t enough to push gold below support.
📉 Technical Analysis
• Key Resistance:
o $3,397 – $3,400: psychological resistance and near the next bullish breakout zone.
o If breached, next target lies around $3,420–3,445.
• Nearest Support:
o $3,356 – $3,364: recently confirmed support zone that triggered the current rebound.
o Deeper support at $3,326 – $3,320 if the rebound fails.
• EMA (EMA50):
o Price remains above the 50-period EMA, indicating bullish momentum in the short term.
• Patterns & Momentum:
o Market structure shows a "rising low" pattern — a bullish signal that buyers are stepping in at higher levels.
o RSI was briefly in oversold territory and now supports a recovery bounce.
o If $3,356 holds, the upside targets remain valid toward $3,397 → $3,439.
📌 Assessment
• Gold has confirmed strong support at $3,356–3,364, with the rebound from $3,352 as proof.
• Short-term uptrend remains intact, unless the USD strengthens sharply or unexpected macro news hits.
• If gold breaks below $3,356, it may retrace toward $3,326–3,320, but the upside potential is currently favored.
💡 Suggested Trade Setups
BUY XAU/USD: $3,356–3,364
🎯 Take Profit: 40/80/200 pips
❌ Stop Loss: $3,346
SELL XAU/USD: $3,397–3,400
🎯 Take Profit: 40/80/200 pips
❌ Stop Loss: $3,407

Gold Weekly Forecast (28 July – 01 Aug 2025)📈 Gold Weekly Forecast (28 July – 01 Aug 2025)
By: RanaNadeemFX
🔍 Technical Overview:
Gold (XAUUSD) is currently trading around $3,337, showing rejection near the previous resistance zone of $3,430–$3,450. The market has recently pulled back after testing this resistance and is now approaching a confluence support area formed by:
Dynamic trendline support (ascending black line)
Horizontal support zone around $3,300–$3,320
50-day EMA providing additional support
This zone is critical and likely to act as a bullish demand area, provided no major fundamental risk-off event occurs.
📌 Key Levels to Watch:
Support Zones: $3,300 / $3,270
Resistance Zones: $3,430 / $3,450
📊 Trade Setup Highlighted on Chart:
A buy opportunity is marked from current price levels with a potential bounce back towards $3,430–$3,450.
Entry Zone: Around $3,330 to 37
Target: $3,450
Stop Loss: Below $3,300
This setup offers a favorable risk-reward ratio, assuming price respects the support and resumes the upward trend.
🧠 Bias: Bullish (as long as price stays above $3,300 support zone)
⚠️ Note: Keep an eye on upcoming US economic data releases and geopolitical developments which could add volatility to gold prices.
📌 Follow for more: @RanaNadeemFX
#GoldAnalysis #XAUUSD #WeeklyForecast #TechnicalAnalysis #TradingView #ForexTrader #PriceAction #GoldOutlook #SmartMoneyConcepts

XAUUSD: Fluctuation of $30/ounce. Do you want to know?Yesterday, I frantically notified followers to buy around 3366-3375, and the market finally rose to 3430. This is a huge profit. I will continue to update it in the Band Trading Center Research Institute later. If you don’t want to miss it, follow me. If you see it but are still not sure how to trade. Then you can leave me a message at the Swing Trading Center Research Institute. I will reply to you one by one when I see it.
This week, some followers have achieved weekly profits of 50%-268%. If your profit is not ideal. Or don’t know how to trade. Remember to like and follow. I will lead everyone to victory.
Buy around 3400-3410. When will it close? I will post the results on the Swing Trading Center. Stay tuned.

XAUUSD:3450-3500The probability of the same direction of the two histories is 95% similar. This shows one thing. The market may repeat history again.
So buy with me. The next target is 3450-3500

After reaching FULL TP. Relax and wait for strong support zone✏️Continuing yesterday's bullish wave structure, Gold has reached the Target level of 3400. In the European session, there is a possibility of a correction to some important support zones. And the US session will continue to aim for a level higher than 3400. Today's strategy is still quite similar to yesterday's strategy when waiting for the areas where buyers confirm to enter the market to FOMO according to the main trend.
📉 Key Levels
Support: 3375 - 3363
Resistance: 3400-3427
Buy Trigger: Rejects the support zone 3375 and reacts to the upside
Buy Trigger: Rebound from 3363
BUY DCA: Break and trading above 3400
Target 3427
Leave your comments on the idea. I am happy to read your views.
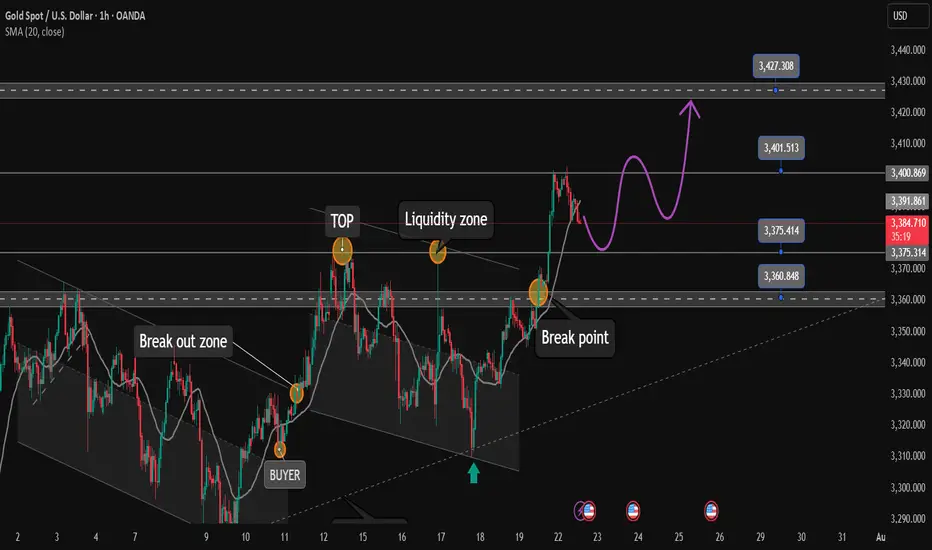
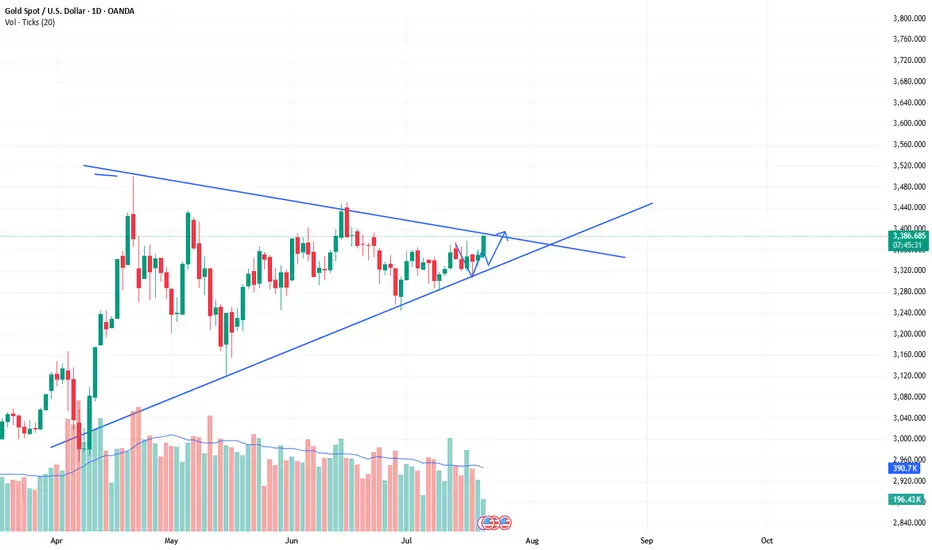
The bull market of xauusd continues, buy and wait for the rise.As predicted in the band trading center in advance over the weekend. The daily level trend is still very stable, and the breakthrough trend has been perfectly carried out. The current quotation is 3388. It is only a matter of time before it rises wildly to the position of 3430. The short-term will definitely break through. The current bull market is clear and has huge potential. The limit of the triangle consolidation phase is about to be broken. Then the bulls will continue to rise. Therefore, buying is the key operation plan.
XAUUSD:Retracement is a buying opportunityAfter the Asian market hit the highest position of 3403, there was some decline. The current gold price is 3386. From the short-term trend of the hourly level. It is still fluctuating at a high level. Combined with the trend of the daily level, there are signs of retracement and counterattack. There is no news dominance. It is purely a technical repair after hitting the high. This retracement can pay attention to the support near 3382-3378. The London and New York markets are still based on buying and profit.

GOLD - Lovers Elliott wave - looking strong Short/Medium termGOLD-----Daily counts indicate Excellent bullish wave structure.
Both appear to be optimistic and this stock invalidation number (S L) wave 2 low
target short / long term are already shared as per charts
correction wave leg seems completed (C)
Investing in declines is a smart move for short/ long-term players.
Buy in DIPS recommended
Long-term investors prepare for strong returns over the next two to five years.
one of best counter
Every graphic used to comprehend & LEARN & understand the theory of Elliot waves, Harmonic waves, Gann Theory, and Time theory
Every chart is for educational purposes.
We have no accountability for your profit or loss.

Ultra-short-term trading. Profit of $10/ounceThe order to buy XAUUSD successfully made a profit. The current gold price is 3367. Stimulated by the weekend news, the expected trend was achieved smoothly, and the short-term bulls were strong. Buying can continue to be the main focus. Relying on the half-hour and one-hour trends, trading can be carried out in the London market for the purpose of buying and profit. The increase is about $10/ounce.
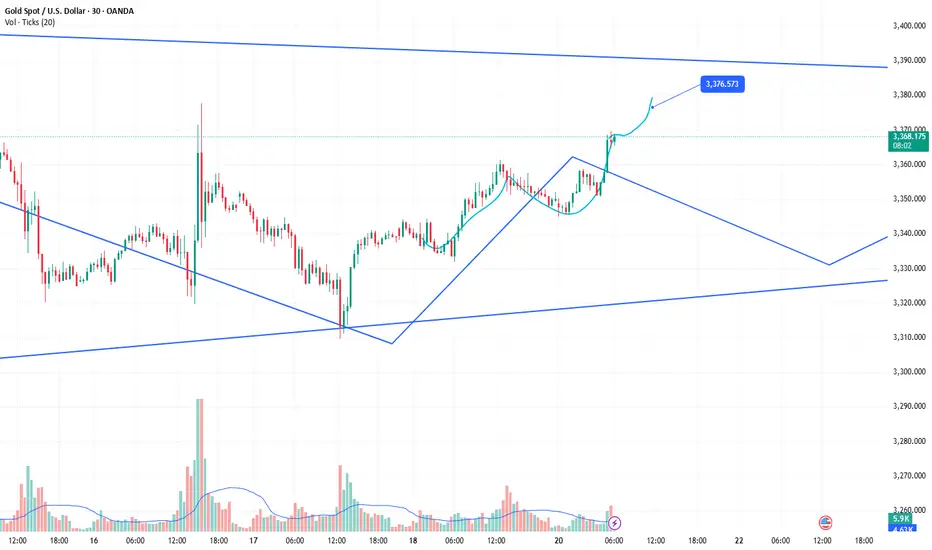
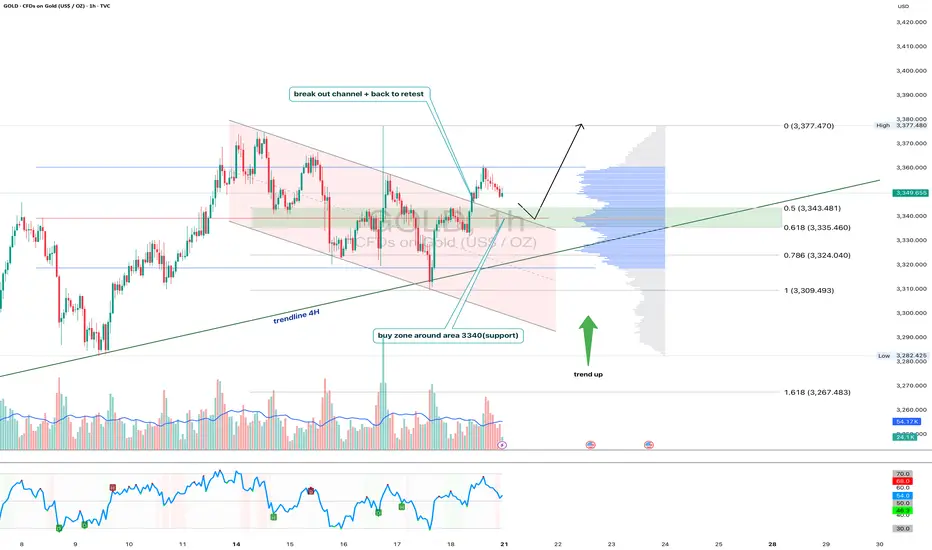
Gold 1H - Retest of channel & support zone at 3340After breaking out of the falling channel, gold is currently retesting its upper boundary — now acting as support. The 3340 zone is particularly important as it aligns with the 0.618 Fibonacci level and high volume node on the visible range volume profile. The price action suggests a potential bullish rejection from this area. With both the 50 and 200 EMA below price on the 1H, the short-term trend remains bullish. The 4H trendline further supports this setup. RSI is cooling off near the neutral zone, leaving room for another leg higher toward the 3377 resistance zone. If 3340 fails, 3324 (0.786 Fibo) becomes the next line of defense. Until then, the structure remains bullish following the successful breakout and retest of the channel.
GOLD ( XAUUSD ): Watching For A Short Term Buy ConfirmationIn this Weekly Market Forecast, we will analyze the Gold (XAUUSD) for the week of July 21-25th
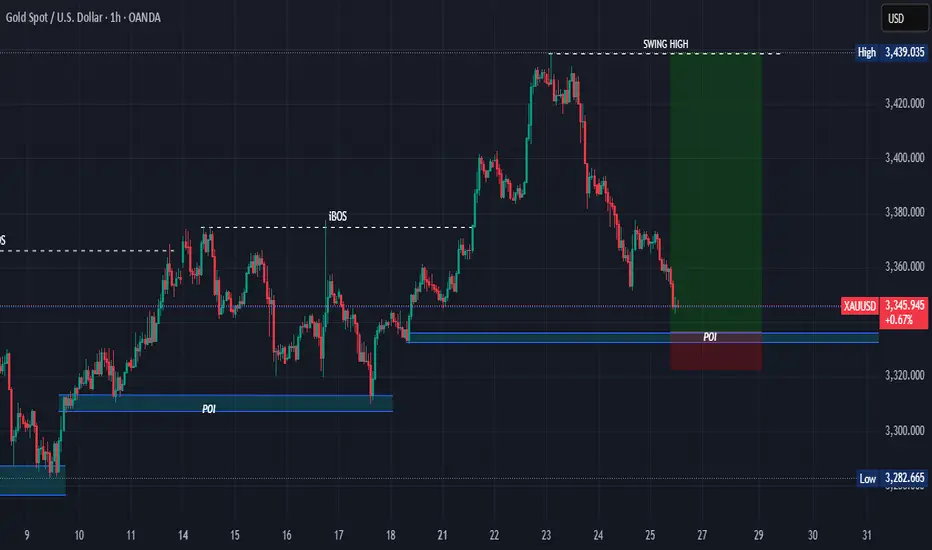
Gold has been in consolidation for a couple of weeks now. The price action hasn't allowed for very many FVGs... until last week. There is a +FVG I am keeping an eye on, as it will be very telling how price reacts to it upon contacting this POI.
If it holds, higher prices will ensue.
If it fails, to the lows of the consolidation we go.
We'll soon see how it plays out.
Enjoy!
May profits be upon you.
Leave any questions or comments in the comment section.
I appreciate any feedback from my viewers!
Like and/or subscribe if you want more accurate analysis.
Thank you so much!
Disclaimer:
I do not provide personal investment advice and I am not a qualified licensed investment advisor.
All information found here, including any ideas, opinions, views, predictions, forecasts, commentaries, suggestions, expressed or implied herein, are for informational, entertainment or educational purposes only and should not be construed as personal investment advice. While the information provided is believed to be accurate, it may include errors or inaccuracies.
I will not and cannot be held liable for any actions you take as a result of anything you read here.
Conduct your own due diligence, or consult a licensed financial advisor or broker before making any and all investment decisions. Any investments, trades, speculations, or decisions made on the basis of any information found on this channel, expressed or implied herein, are committed at your own risk, financial or otherwise.

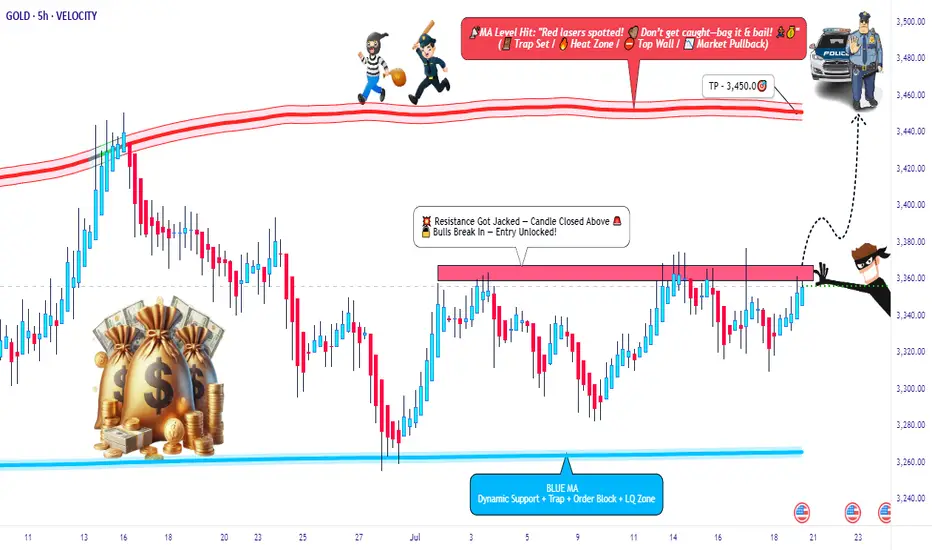
XAU/USD Breakout Playbook – Rob the Market!🚨💰 GOLD HEIST IN MOTION! | XAU/USD Thief Trading Strategy (Breakout Edition) 🏴☠️
🧠 Strategic Mindset | Not Your Average Chart Talk
Yo Market Bandits & Pip Hunters – welcome to the underground playbook!
This isn't your grandma’s chart breakdown – it’s a Thief Trading Takedown on XAU/USD (Gold), where we’re not chasing the market… we’re outsmarting it.
THE MASTER PLAN: Enter Like a Ghost, Exit Like a King 👑
📍 ENTRY POINT – The Break-In Begins!
💥 Breakout Level: Watch for 3370.00 resistance to crack – this is our green light.
🕵️♂️ Entry Style:
• Buy Stop above MA resistance zone (fast & clean)
• OR Buy Limit near swing low zones after confirmation pullback (sniper entry)
🧠 Thief Tip: Wait for the breakout to happen. No orders, no SL before it. Patience is profit.
🔄 Layer the Entry:
• Deploy DCA (Dollar Cost Averaging) or scaling entries with precision
• Build positions like stacking cash bags — smart, silent, and calculated
🛡️ PROTECT THE LOOT – Stop Loss Logic 💣
📍 SL Guide: 3310.00 (4H swing low – update as price structure evolves)
🔥 SL ONLY comes after breakout. Set it too early? That’s how you get caught.
⛔ No pre-breakout orders. No early SL. Stay invisible till it's go time.
🎯 THE ESCAPE – Profit Like a Phantom 🚀
💸 Take Profit: 3450.00
📉 Scalpers: Trail SL as price pushes – never give back stolen pips
🌀 Swing Traders: Monitor resistance layers – don’t let the bulls turn on you
🧭 CONTEXT – Why This Setup?
🔍 Macro Snapshot:
• Trend: Neutral/Bullish Lean
• Influencers: COT reports, geopolitical tension, dollar flows
• Sentiment Shifting – watch the herd, but don’t run with it
🗞️ News Risk: Don’t get wrecked by events! Avoid entries during high-impact news.
🚨 Trailing SL is your best weapon during volatility.
⚡ POWER UP THE CREW – Support the Movement
💬 Drop a comment, hit the 🔥 like button, and share with your trading gang
More Thief Trading blueprints coming soon – bigger breakouts, cleaner setups
⚠️ STAY SHARP, THIEVES!
This ain't financial advice – it’s an outlaw’s edge on the market.
Trade smart. Risk well. Protect the bag.
🏴☠️ XAU/USD GOLD HEIST IN PROGRESS... Join the Movement. Let’s Rob the Market.
GOLD! Pre-Market Analysis For Friday July 18th!In this video, we'll present pre-market analysis and best setups for Friday July 18th.
Enjoy!
May profits be upon you.
Leave any questions or comments in the comment section.
I appreciate any feedback from my viewers!
Like and/or subscribe if you want more accurate analysis.
Thank you so much!
Disclaimer:
I do not provide personal investment advice and I am not a qualified licensed investment advisor.
All information found here, including any ideas, opinions, views, predictions, forecasts, commentaries, suggestions, expressed or implied herein, are for informational, entertainment or educational purposes only and should not be construed as personal investment advice. While the information provided is believed to be accurate, it may include errors or inaccuracies.
I will not and cannot be held liable for any actions you take as a result of anything you read here.
Conduct your own due diligence, or consult a licensed financial advisor or broker before making any and all investment decisions. Any investments, trades, speculations, or decisions made on the basis of any information found on this channel, expressed or implied herein, are committed at your own risk, financial or otherwise.

Gold Surges Late Session – Targeting $3,345+📊 Market Overview:
• Gold has just broken higher to $3,339, extending its bullish move after clearing the $3,335 resistance zone.
• Market sentiment remains supportive as the USD weakens and U.S. bond yields stabilize, while the Fed still shows no signs of cutting rates soon.
📉 Technical Analysis:
• Next resistance: $3,345 – $3,350
• Nearest support: $3,335 – $3,336
• EMA 09: Price remains above EMA 09 → confirms short-term uptrend
• Momentum: RSI stays bullish, and price continues to follow breakout momentum from the recent consolidation zone
📌 Outlook:
Gold is holding its bullish structure — if it stays above $3,335, a move toward $3,345–$3,350 is likely during the Asian session.
💡 Suggested Trading Strategy
🔺 BUY XAU/USD at: 3,336 – 3,338
🎯 TP: 3,350
❌ SL: 3,330

Gold Analysis – Why I’m Targeting $4,085Friday July 18 2025. Malaysia, Kuala Lumpur - Gold analysis done by Zezu Zaza to see the potential upcoming upside starting today this Friday.
I am using a CCT (Chrono Conditioned Trading) technique for my trading based analysis with mathematical strategy in the Xauusd pricing. We will cover the technical, fundamental and sentiment aspect as these are the three components pillars in trading before making any decision and movement trend.
1. Technical Setup (Daily Chart)
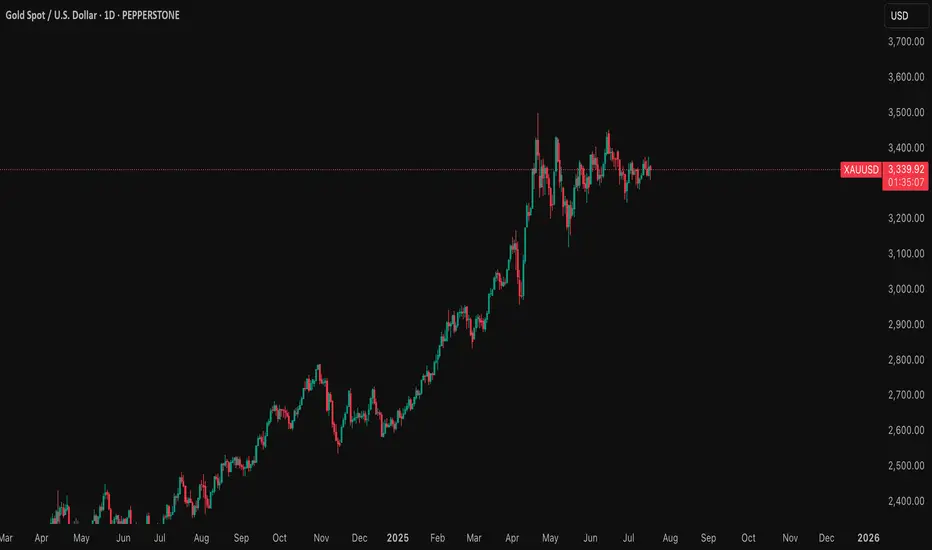
Gold is currently consolidating between the $3,300 to $3,375 range after a strong rally earlier this year.
The RSI sits near the neutral 50 level, while the MACD shows signs of a potential bullish crossover.
A confirmed breakout above the $3,375 to $3,400 resistance zone may lead to a surge toward $3,600 to $3,650, and possibly much higher.
Market structure remains bullish, with higher lows forming a solid base around $3,300.
2. Federal Reserve Outlook – 2025 Rate Cuts Expected
The market is now pricing in at least two interest rate cuts from the Federal Reserve by the end of 2025. A 25 basis point cut is expected in September, with another potentially coming in December. Recent CPI and PPI data indicate cooling inflation, giving the Fed more room to ease without reigniting price pressure. Labor market strength is weakening, wage growth is decelerating, and tighter credit conditions are emerging. Fed Chair Jerome Powell recently stated that the risks of over-tightening are now balanced, signaling a shift to a more dovish stance. Lower interest rates reduce bond yields and weaken the dollar, which historically fuels gold’s bullish momentum. If trump fired or Powell decision to step down, this will fire the gold even higher for the catalyze.
3. Market Sentiment (Speculative Positioning)
As of July 11, 2025, the latest CFTC Commitment of Traders report shows speculative net long positions on gold have surged to 203,000 contracts, the highest level in several months.
This signals a strong bullish sentiment among hedge funds and large traders.
In addition, gold ETFs saw over $38 billion in inflows in the first half of 2025, highlighting strong institutional demand as investors seek safety in uncertain times.
The positioning supports further upside as traders bet on a softer dollar and increased market volatility.
4. Macro Fundamentals and Hedge Fund Sentiment
Central banks around the world, especially in the BRICS nations, continue to increase their gold reserves in efforts to reduce reliance on the US dollar.
China has been actively accumulating gold for more than eight consecutive months, with unofficial estimates suggesting holdings of up to 5,000 metric tons.
Several hedge funds and institutional managers now classify gold as a core asset class due to rising fiscal uncertainty, geopolitical risk, and the deterioration of confidence in monetary policy. David Einhorn of Greenlight Capital emphasized that gold is not just about inflation but about the credibility of monetary and fiscal policies. His fund maintains a long gold position and expects higher prices as global deficits and structural imbalances persist.
5. Institutional Forecasts and Speculator Targets
Goldman Sachs has raised its end-of-2025 target to the $3,700 to $3,950 range, citing rising ETF inflows and a softer Fed stance. JPMorgan expects gold to average around $3,675 in the fourth quarter of 2025. Citi, in a bull case scenario, believes gold could trade well above $3,300. The World Gold Council has outlined a high-conviction scenario in which gold could reach $4,000 within the next six to nine months, driven by stagflation and global monetary instability. Greenlight Capital is reportedly aiming for the $3,500 to $3,800 range, though David Einhorn noted that he does not want prices to rise excessively too quickly.
Target Price: $4,085 first before turn the bullish sooners to $5000 price make this same year.
My target of $4,085 is supported by the convergence of multiple factors:
- A bullish technical structure with a potential breakout
- Fed interest rate cuts reducing yields and weakening the dollar. Fed will reduce the rates for the first time this year (12 more days) after this article is published today 18 July 2025.
- Strong speculative positioning and ETF demand
- Aggressive central bank accumulation
- Hedge fund sentiment aligned with rising gold exposure
- Persistent geopolitical and macroeconomic uncertainty
If these conditions hold, $4,085 is a realistic medium-term objective within six to nine months.
Trading Plan Summary
Component Strategy
Entry Zone Breakout above $3,375
Stop Loss $3,300 to $3,320 (below key support)
Take Profit Partial at $3,600 to $3,650, trail remainder to $4,085
Risk Triggers Dollar strength, unexpected Fed hawkish turn, resolution in geopolitics
Key Catalysts CPI done, PPI done, FOMC statements, nonfarm payrolls, war developments
Final Takeaway
This gold analysis blends a bullish technical pattern with the macroeconomic backdrop of an approaching Fed pivot, rising speculative positioning, and ongoing central bank purchases.
Hedge funds and institutions are increasingly viewing gold as an essential defensive asset, especially in the face of deteriorating fiscal credibility and geopolitical tensions.
If gold breaks and holds above the $3,375 level, the path toward $4,085 becomes significantly more probable.
18 July 2025 Friday is a starter ignition trend will born today. I will place some test lots today and will accumulate after from time to time.
Let me know if you what is your opinion or send email to me to reach me for the insitutional analyst or want to see live trade.
Regards,
Zezu Zaza
2048
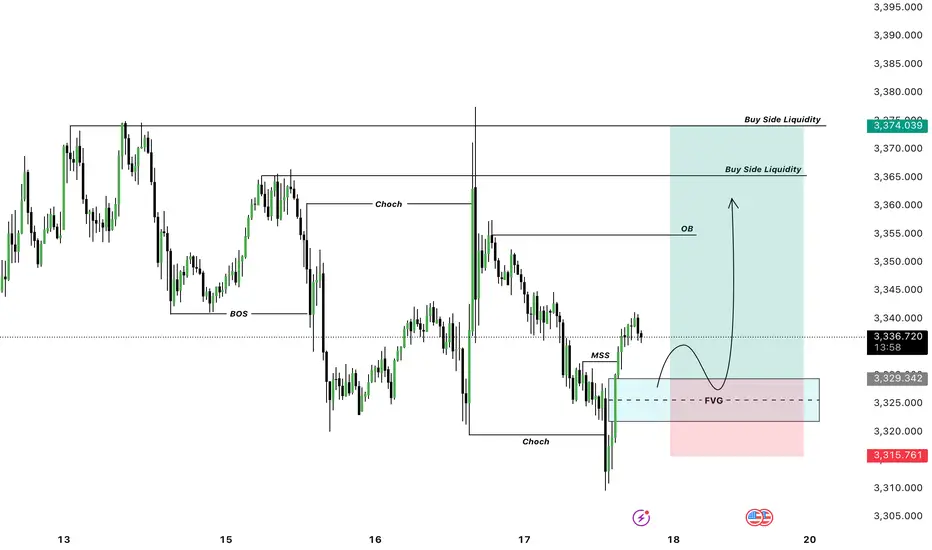
GOLD LONG SETUP Gold Bullish Long Setup
Startegy : FVG + MSS + BUY STRUCTURE
Where To Buy ?
3329 - 3320 Area FVG Buy
Targets : 3350 , 3355, 3360
Stop Loss Previous Low
SWING TRADE OPPORTUNITY 〉LONGAs illustrated, I try to visualize what the next bullish impulse could look like if price holds 3300 as a key psychological and algorithmic price level.
Illustrated are the potential buy areas (a current one and an extended one in case a pullback occurs to manipulate lower levels in the next 24-48 hours).
This projection, if valid, could hold from now until next week, so it can be considered a swing trade to hold at least the next week and into the following one).
--
After this post, I will upload another analysis on the Daily timeframe projecting the longer term move, so make sure to go in my profile to check it out.
GOOD LUCK

GOLD Remains BullishPrice made a HH at 3365, confirming structure shift back to bullish. The last HL is at 3305, making it the protected level for bulls.
H4 OB: 3305–3322 (origin of the recent impulsive leg — ideal pullback zone)
Supply Zone: 3432–3445 (next unmitigated supply target)
Bullish if price pulls into demand zone and holds, expect continuation to 3432+
H1 OB: 3325– 3335 (potential re-entry zone)
Watch for reaction on pull back
M15 Micro bullish flow is intact; price is consolidating around 3360
Breakout Buy: M15 BOS above 3365 with retest = entry trigger
🟢Entry Zone: 3325– 3335
SL: Below 3305
TP1: 3365
TP2: 3432
TP3: 3445

XAU/EUR Bear Raid – High-Risk, High-Reward Short!🔥 XAU/EUR GOLD HEIST – BEARISH BREAKOUT ALERT! 🚨💰
🌟 Greetings, Market Pirates & Profit Raiders! 🌟
(Hola! Oi! Bonjour! Hallo! Marhaba!)
🤑 TRADE IDEA: XAU/EUR (Gold vs. Euro) – BEARISH SWING PLAY
Based on the 🔥Thief Trading Style🔥, we’re plotting a strategic heist on Gold! Our analysis signals a short entry with high-risk, high-reward potential. The market is oversold, consolidating, and primed for a reversal trap—bullish traders are about to get ambushed!
🎯 TRADE SETUP (SWING/DAY TRADE)
📉 ENTRY:
"The Heist Begins!" Wait for Neutral Zone breakout near 2800.00 (Bearish confirmation).
Pro Tip: Place sell-stop orders above neutral OR sell-limit near swing highs/lows (15-30 min timeframe).
📌 Set an ALERT! Don’t miss the breakout moment.
🛑 STOP LOSS:
"Stop right there, cowboy! 🤠"
If using a sell-stop, set SL only after breakout (don’t get faked out!).
Thief SL Zone: 2870.00 (4H swing high).
⚠️ Adjust based on your risk & lot size! (Your money, your rules—but trade smart!).
🎯 TARGET:
2720.00 (or escape early if momentum fades).
🚨 CRITICAL ALERTS:
📰 News = Volatility! Avoid new trades during major releases.
🔒 Lock profits with trailing stops—don’t let winners turn to losers!
📉 Market Context: Bearish trend fueled by .
💥 BOOST THIS HEIST! 👊
🔥 Like & Boost to fuel our next Thief Trading raid!
🚀 More profitable setups coming—stay tuned!
(Disclaimer: Trade at your own risk. This is not financial advice.)

The decline in gold prices has not stopped. Do you know what to
Gold did not provide a better position to go long during the day, but continued to fluctuate, and was under pressure at 3330 many times. The short-term suppression was obvious, and the increase was limited. It is expected to usher in a decline today. Consider short-term short operations, pay attention to shorts near 3326, stop loss at 3334, and take profit at 3300. Pay attention to risks.
Short-term trading of gold in the evening of July 10: shorts near 3326, stop loss at 3334, take profit at 3306
