XAUUSD Technicals & FundamentalsA classic range-bound consolidation with a potential breakout setup forming.
🔧 Key Technical Levels:
Resistance: Around $3,280 — if price breaks this cleanly, bulls could push for a strong continuation.
Immediate Resistance Zone: $3,240–3,245
Support: Around $3,220 (key short-term structure)
Pivot Zone: Near $3,200–3,190 — a break below here could signal deeper downside toward $3,160
Volume: Noticeably dropping (marked by the red arrow), which often precedes a strong move. Low volume = indecision = potential volatility spike incoming.
🧠 Chart Pattern Insight:
A bullish flag/pennant type setup is visible — consolidation after an impulsive uptrend.
Arrows indicate the two primary scenarios:
📈 Upside: Break above $3,245 with volume could trigger a run toward $3,280+
📉 Downside: Break below $3,220 could drag price down to retest pivot zones or even $3,160
📰 Fundamental Factors to Watch Today:
📅 Key Events/Data Releases:
U.S. Economic Data:
Retail Sales (March) — A surprise in consumer spending could sway USD and gold.
Empire State Manufacturing Index — May affect interest rate expectations indirectly.
Fed Speak: Any comments by FOMC members on inflation, rate hikes, or balance sheet could jolt markets.
⚖️ Sentiment Snapshot:
Short-term: Neutral to bullish (sideways consolidation near highs)
Medium-term: Bullish bias remains intact above $3,200
Volatility Risk: High — expect fakeouts before a confirmed breakout.
Goldlongsetup

Long towards 3244.00 area a quick one.Expecting Gold to push towards 3244 area... it will be a very quick one immediate the market opens.

GOLD Ready to Break Highs Again! 🔥 3058 Level in Sight – Are You Ready? 🔥
📊 Market is following H4 Structure
📈 H4 BMS & OB in Play – Strong Momentum Building!
For detailed analysis & real-time updates, follow our TradingView page! 📍📩

GOLD H1 Pro Levels Chart Update by FMPIn this chart you will find trend continuation levels of gold including psychological levels, blind structure levels with 3080 sequences

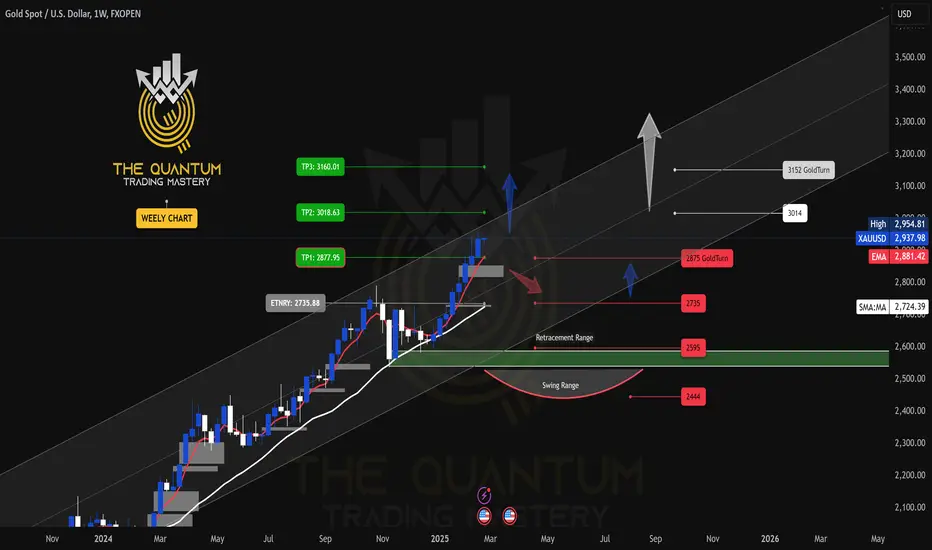
GOLD WEEKLY CHART MID/LONG RANGE ROUTE MAP UPDATEDWeekly GOLD Analysis: 17th February 2025
Hello Traders,
Here’s a weekly chart analysis of GOLD, offering an in-depth look at recent market trends and future outlook. Since October 2023, our consistent tracking has achieved 100% target accuracy, as shown by the Golden Circle markers on the charts. Let’s break down the highlights and what’s next.
Recap of Last Week’s Successes
Weekly Chart Highlights:
* EMA5 crossed and settled above Entry ✅ 2735 reached
* Bullish Target TP1: 2877 ✅ Achieved
* GoldTurn Levels at 2875 activated twice ✅ Reached
What’s Next for GOLD? Bullish or Bearish?
After hitting ENTRY LEVELS at 2735 and TP1 2877, we saw a small close above 2877 last week, leaving 3018 open as a potential target. We mentioned that an EMA5 lock would confirm this movement.
While EMA5 hasn’t locked yet, the close from last week provided a solid push upward, gaining over 500 pips. The long-term gap remains open, with more movement likely after last week’s candle body close.
Key Level: 2735 remains a critical zone.
GoldTurn Levels at 2875 and 2735 are active, and the price may revisit these levels before bouncing back to reach TP1 and beyond.
Recommendations & Strategy:
* Focus on EMA5: Watch its behavior around 2877 for key signals on short- and long-term trades.
* Support Levels: GoldTurn levels at 2875 and 2735 are vital for identifying reversal points and prime dip-buying opportunities.
* FVG Support: A range between 2835 and 2850 is also supportive.
For precise entry and exit points, check our daily, 12H, 4H, and 1H analyses for clearer market guidance.
We’ll continue to provide daily updates, insights, and strategies on our TradingView and YouTube channels every Sunday. Don’t forget to like, comment, and share to support our work and help others benefit!
The Quantum Trading Mastery

GOLD WEEKLY CHART MID/LONG RANGE ROUTE MAP UPDATEDWeekly GOLD Analysis: 24th February 2025
Hello Traders,
Here’s a weekly chart analysis of GOLD, offering an in-depth look at recent market trends and future outlook. Since October 2023, our consistent tracking has achieved 100% target accuracy, as shown by the Golden Circle markers on the charts. Let’s break down the highlights and what’s next.
Gold reached an all-time high of $2,954.80 last week. As previously noted, close attention to the movement of the 5-day Exponential Moving Average (EMA5) was advised. The anticipated Fair Value Gap (FVG) provided strong support at $2,850, with the EMA5 approaching the first take-profit (TP1) level at $2,877, leading to a bullish surge that touched the all-time high. However, the EMA5 has yet to cross and stabilize above $2,877.
This situation persists, with the EMA5 still not locked above $2,877, which is necessary for further bullish confirmation. If the EMA5 fails to cross and hold above this level, the price may reverse to test the GoldTurn level at $2,875 before potentially bouncing back upward.
The key level at $2,735 remains a critical zone. Active GoldTurn levels at $2,875 and $2,735 suggest that the price may revisit these areas before advancing to TP1 and beyond.
Recommendations & Strategy:
* Focus on EMA5: Watch its behavior around 2877 for key signals on short- and long-term trades.
* Support Levels: GoldTurn levels at 2875 and 2735 are vital for identifying reversal points and prime dip-buying opportunities.
* EMA5 detachment is still due on weekly chart.
For precise entry and exit points, check our daily, 12H, 4H, and 1H analyses for clearer market guidance.
We’ll continue to provide daily updates, insights, and strategies on our TradingView and YouTube channels every Sunday. Don’t forget to like, comment, and share to support our work and help others benefit!
The Quantum Trading Mastery
GOLD ROUTE MAP UPDATEHey Everyone,
Another awesome day on the markets with our Bullish targets getting smashed.
After completing all targets upto 3078 yesterday, we continued to get candle body close breakouts above 3078 opening 3094 and above 3094 opening 3119 and then ema5 lock above 3119 confirmed 3148 for the perfect finish to this chart idea.
We can now move over to our 4H chart idea and our remaining multi timeframe route maps to continue to track the movement for the rest of the week.
We will continue to buy dips using our support levels taking 30 to 40 pips. As stated before each of our level structures give 20 to 40 pip bounces, which is enough for a nice entry and exit. If you back test the levels we shared every week for the past 24 months, you can see how effectively they were used to trade with or against short/mid term swings and trends.
BULLISH TARGET
3055 - DONE
EMA5 CROSS AND LOCK ABOVE 3055 WILL OPEN THE FOLLOWING BULLISH TARGET
3078 - DONE
EMA5 CROSS AND LOCK ABOVE 3078 WILL OPEN THE FOLLOWING BULLISH TARGET
3094 - DONE
EMA5 CROSS AND LOCK ABOVE 3094 WILL OPEN THE FOLLOWING BULLISH TARGET
3119 - DONE
EMA5 CROSS AND LOCK ABOVE 3119 WILL OPEN THE FOLLOWING BULLISH TARGET
3148 - DONE
BEARISH TARGETS
3034 - DONE
EMA5 CROSS AND LOCK BELOW 3034 WILL OPEN THE FOLLOWING BEARISH TARGET
3015 - DONE
EMA5 CROSS AND LOCK BELOW 3015 WILL OPEN THE FOLLOWING BEARISH TARGET
2999 - DONE
EMA5 CROSS AND LOCK BELOW 2999 WILL OPEN THE FOLLOWING BEARISH TARGET
2975 - DONE
EMA5 CROSS AND LOCK BELOW 2975 WILL OPEN THE SWING RANGE
SWING RANGE
2950 - 2922
As always, we will keep you all updated with regular updates throughout the week and how we manage the active ideas and setups. Thank you all for your likes, comments and follows, we really appreciate it!
Mr Gold
GoldViewFX

30-minute candlestick chart on Gold (XAU/USD)Market Structure Labels:
CHoCH: Change of Character – indicates a shift in trend direction.
BOS: Break of Structure – confirms a continuation in trend direction.
Price Zones:
Supply Zone (Red Rectangle): Price area near the 3,114 level, where selling pressure may exist.
Demand Zones (Blue Rectangles): Areas around 3,052 and 2,950 levels where buying pressure may step in.
EQH (Equal Highs): Indicates potential liquidity resting above that high, possibly a target for price.
Weak Low: Marked below 2,950, suggesting it's vulnerable and may be swept.
Current Price Action:
Price is currently at 3,082, up 3.35% for the session.
A recent CHoCH to the upside, followed by a BOS, suggests bullish intent.
The price appears to be pulling back into a smaller demand zone (~3,064–3,052 area).
Forecasted Move (Blue Arrow):
The trader anticipates a short-term dip into the highlighted demand zone.
After tapping into demand, price is expected to bounce and move back up toward the supply zone, potentially testing or breaking the EQH around 3,114.
Trade Setup (Marked Zone):
Entry Zone: Around the demand area (~3,064–3,052).
Target Zone: Toward the top red zone (~3,114).
Risk Zone: Below 3,052.

Gold Analysis April 7The D1 candle on Friday clearly identified selling pressure and the amount of fomo pushed the price to 2972.
The H4 structure is still showing that the downward force will continue to be maintained when 3054 was rejected by the buyers.
Back to the trading plan The 3018 and 3035 border areas are considered sideways compression borders. If the price breaks 3018, wait for a retest and sell to 3003. If the US session breaks 3003, then push to 2955.
If the 3018 border remains strong, wait for a break of 3035 to BUY to the exchange price zone of 3054. BUY signals for short-term city and are considered to be against the trend at the moment. When the US session fails to break 3055, you can sell and hold long. If it breaks 3055, waiting for 3080 to sell will be safer than fomo to BUY against the trend.

XAU/USD potential Longs from 2990 back up to 3,100This week, I’m considering both short- and long-term opportunities on gold. We’ve recently seen a change of character to the downside, and there’s a clean 1-hour supply zone that could trigger a short-term bearish reaction.
That said, there’s also a lot of nearby liquidity resting below, which I expect price to sweep first. If that happens, I’ll be watching the 20-hour demand zone—a strong area that could spark a new bullish rally from the lows.
Confluences for GOLD Buys:
- Price has recently cleared a new all-time high (ATH), indicating continued bullish strength.
- Market structure remains overall bullish, suggesting this move down may be a temporary correction.
- The 20-hour demand zone sits just below key liquidity and looks highly valid.
- Untouched Asia session highs remain above, which price is likely to target.
- The DXY is moving bearish, aligning with a bullish outlook on gold due to their inverse correlation.
Note: If price reacts from the current demand zone (which is also valid), we could see Scenario B play out first—a rally followed by a short move to clear liquidity before heading higher.
Stay patient and trade safe, everyone!

GBPJPY APRILIsland v Island, which will you choose?
We buying this son of a bullion. Ultra short on the YEN. Don't ask me why. Sell peaks, because you never go all in on an island.

How will gold perform after the super rollercoaster market?Gold's 1-hour moving average still shows signs of turning downwards. Although gold bulls have made a strong counterattack, it is also because of the risk-aversion news that stimulated a retaliatory rebound. However, gold continued to fall after rising, and gold began to return to volatility. In the short term, gold is supported near 3100. If gold falls below the support near 3100 again, then gold shorts will still have an advantage in this war. Overall, the impact of today’s non-agricultural data is expected to be dim. What is more important is the stimulation of the news. However, it may be noted that if gold holds the 3100 mark for a long time, then gold is expected to fluctuate upward above 3100.
Trading idea: short gold near 3115, stop loss 3125, target 3100
The above is purely a sharing of personal views and does not constitute trading advice. Investments are risky and you are responsible for your profits and losses.

XAUUSD Daily Trading Plan for April 3, 2025🧠 Smart Money Concepts x Fundamental Flow
Despite negative USD news (ADP & ISM) and Trump’s hawkish blurbs, Gold didn’t pop aggressively — it wicked up into premium supply, then quickly retraced. That’s a liquidity game, not a trend change (yet). Still bullish bias overall, but intraday looks mixed.
🧭 Bigger Picture – D1/H4
Price rejected strongly from the premium supply zone near 3144–3147, leaving a clear wick with imbalance underneath.
Bullish structure remains valid, but we're seeing a potential distribution pattern short-term.
Trendline liquidity & HLs are stacking up below, ideal for a grab.
🟩 Demand zones of interest:
3107–3115 (discount zone, strong reaction in prior sessions)
3086–3092 (last known rally base)
📌 Key Zones
🔵 Premium supply: 3144–3147
🟡 Buyside liquidity: 3147–3155
🟦 Sellside liquidity grab zone: 3107–3115
🟢 Strong demand: 3086–3092
🔴 Major liquidity draw: 3180 zone (untouched weekly magnet)
🧩 SCENARIO 1 – 🐂 “Power of Discount” Buy Setup
“When in doubt, hunt the imbalance out.”
Price dips toward 3115–3107, taps imbalance + OB, shows M5/MS shift
Confirmation + sniper long
TP1: 3142 (last high), TP2: 3180 if momentum kicks in
🎯 Confluences:
Discount OB zone + unfilled imbalance
Trendline tap + BOS + liquidity grab
Weak DXY context
🧩 SCENARIO 2 – 🐂 Trap, Swipe & Rally Buy
Deep sweep to 3086 zone
Reversal signs after stop hunt / equal low grab
Entry on CHoCH or breaker retest (M15 or M5)
TP1: 3140, TP2: 3180
💡 This is the “maximum pain = maximum profit” play.
🧩 SCENARIO 3 – 🐻 Premium Rejection Intraday Sell
“Supply hits, market flips.”
Price tests 3144–3147 again in early session
No BOS on M5, shows weakness (M5/M15 LH + CHoCH)
Sell into imbalance zones
TP1: 3127, TP2: 3110
⚠️ Only take this if we don’t break above 3147. Watch liquidity wicks!
🧩 SCENARIO 4 – 🐻 Fake Pump & Dump
Price spikes through PDH, into 3155–3160
Quick rejection (news-induced spike or algo trap)
Sell setup on lower TF reversal after liquidity sweep
TP to 3115 zone
🎭 A classic “grab & go” trap. Great RR but needs discipline.
📰 Macro Watch – April 3, 2025
Fed speakers are lining up — watch for dollar volatility 👀
China PMI during Asia could boost metals
DXY might stay weak → keep gold supported
Gold is at ATH regions = more manipulation + fakeouts!

Update XAUUSD Intraday Battle Plan"Gold never sleeps… but it might fake you out first!" 🤫
🟢 Buy Scenario 1 – “The Spring Trap” 💧
If price sweeps liquidity below 3107 zone (grab zone + FVG), be ready for a bounce.
Entry zone: 3100 – 3107
Confluences:
Valid FVG + Imbalance
Strong rejection already shown from this area
Trendline liquidity trap below
Buy-side OB forming (watch M15/M30 for confirmation)
SL: Below 3090
TP1: 3125
TP2: 3140
Note: A classic liquidity sweep to trap bears before a news-driven reversal? Don’t blink. 👀
🟢 Buy Scenario 2 – “The Bounce of Faith” 🧗
If price respects the trendline and discount zone without grabbing 3100.
Entry: 3112 – 3117
SL: 3106
TP1: 3135
TP2: 3147 – PDH
Confluences:
Equilibrium + strong bullish reaction from previous HL
CHoCH confirmed on LTF
Divergence on RSI (M15) might cook a sniper launch 🚀
🔴 Sell Scenario 1 – “The Fakeout Masterclass” 🎭
If price retests supply zone 3145–3150 and fails to break PDH (3148)
Entry zone: 3145 – 3150
SL: 3155
TP1: 3130
TP2: 3112
Confluences:
Weak high + premium zone
PDH liquidity magnet → sell-side grab potential
Bearish OB forming on M15
Reminder: Respect the zone—don’t marry the bias. 💍
🔴 Sell Scenario 2 – “The Trap Breaker” ⚔️
If ascending triangle fails & price nukes below 3110.
Entry: 3110–3105 (after CHoCH or BOS on LTF)
SL: 3117
TP1: 3096
TP2: 3086 (stronger OB zone)
Fuel: Momentum + stop hunt + potential shift from bullish to correctional structure
📢 News Watch – April 2, 2025
⚠️ ADP Non-Farm Employment Change (15:15 GMT+2)
Big mover, early warning before NFP. More jobs = bearish gold.
⚠️ ISM Services PMI (17:00 GMT+2)
High impact. Strong services = stronger USD → bearish for gold.
📌 Expect volatility spikes. Best entries = after liquidity grabs post-news.
🧨 Final Words
Be patient. Let price come to your zone. Set alerts. Don’t chase—trap it like a sniper. 🎯
💬 Drop a follow & smash that ❤️ if this plan made your day easier. Let’s ride the gold wave together 🌊⚡

Gold - Looking To Buy Dips In The Short TermH1 - Bullish trend pattern in the form of higher highs, higher lows structure
Strong bullish momentum
Expecting retraces and further continuation higher until the two Fibonacci support zones hold.
If you enjoy this idea, don’t forget to LIKE 👍, FOLLOW ✅, SHARE 🙌, and COMMENT ✍! Drop your thoughts and charts below to keep the discussion going. Your support helps keep this content free and reach more people! 🚀
--------------------------------------------------------------------------------------------------------------------
Disclosure: I am part of Trade Nation's Influencer program and receive a monthly fee for using their TradingView charts in my analysis.

UPDATE XAUUSD DAILY PLAN – APRIL 2, 2025🦍 XAUUSD DAILY PLAN – APRIL 2, 2025
Feed: VANTAGE | Based on Price Action, SMC, OB, FVG, Liquidity
🌍 Macro & Political Context
📰 Geopolitical tension remains high: war in Ukraine, Trump tariffs = gold stays strong as safe-haven
💸 Inflation concerns + central bank demand continue fueling bullish pressure
🧠 Gold printed an ATH @ 3148, but market is now reacting with clear Smart Money footprints
🧠 SMC Structure Overview
🔺 3335–3340 → Liquidity/Accumulation Zone → Not a sell zone
🔻 3107–3115 → Strong rejection zone → Valid demand
📊 Price is compressing between a major supply and key liquidity below
📌 Smart Money may grab liquidity below before making the next bullish move
🎯 TRADE SCENARIOS – SNIPER SETUPS
🟢 BUY SCENARIO 1 – Trend Continuation Entry
Bias: Bullish
Entry: 3115 – 3120
Confluences:
Bullish OB on M15
FVG in discount
Strong reaction from this zone yesterday
Sell-side liquidity swept at 3112
Confirmation: Bullish CHoCH + engulfing on M5
SL: Below 3107
TP1: 3135
TP2: 3145
TP3: 3150+ (ATH retest)
🟢 BUY SCENARIO 2 – Deep Discount Entry
Bias: Bullish (Liquidity grab + imbalance fill)
Entry: 3085 – 3092
Confluences:
H1 FVG + unmitigated OB
FIBO 61.8%
Below key liquidity at 3100
Confirmation: M1/M5 reversal pattern + CHoCH
SL: Below 3075
TP1: 3115
TP2: 3135
TP3: 3148+
🔴 SELL SCENARIO 1 – Fakeout Above ATH
Bias: Short-term reversal
Entry: 3146 – 3150
Confluences:
Sweep of ATH @3148
H4 supply zone
Possible overextension / inducement
Confirmation: M5 rejection + CHoCH
SL: Above 3155
TP1: 3130
TP2: 3115
TP3: 3100
🔴 SELL SCENARIO 2 – Break in Structure Setup
Bias: Trend shift / Lower High
Entry: 3127 – 3132
Confluences:
LH formed under 3140
BOS on M15
Rejection from OB retest
Confirmation: M15 CHoCH + rejection wick
SL: Above 3136
TP1: 3112
TP2: 3092
TP3: 3080
🧲 Key Liquidity & Imbalance Zones
Zone Type
3335–3340 🔒 Liquidity / Accumulation
3148–3150 💥 Buy-side Liquidity (fakeout)
3107–3115 🟢 Demand zone (bullish base)
3085–3092 🔵 Imbalance + OB + 61.8% FIBO
3075 🧨 Stop hunt / liquidity clearance
🧘 Final Notes
📌 Patience > Prediction
🧠 Wait for confirmation. Don’t force the entry.
🗞️ News and Trump can still throw wild cards — stay reactive.
👍 Found this plan helpful? Smash that like ❤️ and follow for sniper updates daily.
#XAUUSD #GoldAnalysis #SmartMoneyConcepts #SniperTrading #FVG #OrderBlocks

GOLD DAILY CHART MID/LONG TERM UPDATEGOLD Daily Chart Update: 24th FEB 2025
Hi Everyone,
Here’s the latest update on the GOLD daily chart, which we've been closely monitoring and trading. Below, we break down recent price movements, updated key levels, and provide actionable insights for the days ahead.
Recap of Recent Chart Success!
Gold recently achieved a record high of $2,954.80. Our analysis has consistently highlighted that after reaching each target level, prices tend to reverse by over 40+ pips to the GoldTurn level. This pattern was evident when, after hitting TP3 at $2,933, the price retraced more than 40+ pips to the GoldTurn level at 2870, which acted as a support, before rebounding bullishly to surpass resistance and reach the all-time high of $2,954.81.
Current Outlook: Bullish or Bearish?
Presently, gold's price is oscillating between a resistance gap at $2,990 and a support gap at $2,933. The $2,990 level serves as a key resistance, while $2,933 acts as support. Additionally, the Fair Value Gap (FVG) offers support at $2,920.
In summary, while the long-term outlook remains bullish due to factors like central bank demand and economic uncertainties, short-term fluctuations between the $2,933 support and $2,990 resistance levels are expected. Traders should monitor these key levels and indicators closely to inform their strategies.
KEY LEVEL: 2870
Resistance Levels: 2990, 3052
Support Levels (GoldTurn Levels): 2933, 2870, 2801, 2744, 2671, 2595
EMA5 Behavior:
* Or If EMA5 crosses and locks above 2933, it strengthens the bullish case.
* If EMA5 fails to hold above 2933, cross and lock below this level 2933, expect a pullback to key GOLDTURN levels below.
Recommendations:
* Capitalize on Dip Opportunities: Use smaller timeframes (1H, 4H) to trade around GOLDTURN levels, targeting 30–40 pips per trade.
* Stay focused on shorter trades in this range-bound market to manage volatility effectively.
Long-Term Bias:
Maintain a bullish outlook while viewing pullbacks as buying opportunities.
Accumulate positions near key support levels for a safer approach instead of chasing highs.
Final Note:
Trade with confidence and precision. Our analysis ensures you’re well-prepared to navigate the evolving market landscape. Stay updated with our daily insights across multiple timeframes for deeper clarity.
Thank you for your continued trust! Don’t forget to like, share, and comment to support our work.
Best regards,
The Quantum Trading Mastery Team

GOLD 12H CHART ROUTE MAP ANALYSIS FOR THE WEEKGOLD 12H CHART UPDATE: 24th FEB 2025
Hello Everyone,
Here’s the latest 12H GOLD chart update, offering a thorough review of recent price movements and key insights for the upcoming sessions. Since October 2023, our careful tracking has maintained 100% target accuracy, as reflected by the Golden Circle markers on the charts. Let’s explore the highlights and what lies ahead.
* Gold touched ATH last week at 2954.81
* Gold price has been fluctuating between two weighted level above with a gap 2948 and with a gap below 2903 the whole week. The Resistance 2948 and support level 2903 reacted well.
What is next for GOLD?
* Resistance Levels: 2948, 2993, 3041, 3092
* Support Levels (GoldTurn Levels): 2900, 2856, 2813, 2770, 2710, 2664, 2599
* FVG is providing strong support at 2920 which might push price bullish
EMA5 Behavior (Red Line):
Current EMA5: 2937.47
Bullish Targets
EMA5 cross and lock Above 2948, will open the following bullish target 2993
EMA5 cross and lock Above 2993, will open the following bullish target 3041
EMA5 cross and lock Above 3141, will open the following bullish target 3092
Bearish Targets
EMA5 hold and cross Below 2900: will open the following bearish target 2856
EMA5 cross and lock Below 2856: will open the following bearish target 2813
EMA5 cross and lock Below 2813: will open the following bearish target 2770
EMA5 cross and lock Below 2770: will open the following bearish target 210
EMA5 cross and lock Below 2710: will open the following bearish target 2664 (Retracement Range)
Long-Term Outlook:
Maintain a bullish bias while using pullbacks as buying opportunities.
Buying near key support levels ensures better entry points and mitigates risks, avoiding the pitfalls of chasing tops.
Trade with precision, discipline, and confidence. Our accurate, multi-timeframe analysis equips you to navigate the market effectively. Stay updated with daily insights to remain ahead of market trends.
We appreciate your support! Don’t forget to like, comment, and share this post to help others benefit.
Best regards,
📉💰 The Quantum Trading Mastery Team

Will Gold Break 3000? (Potential Bullish Continuation)Gold price seems to exhibit signs of overall bullish continuation on the Longer Timeframes as the price action may break the previous All Time High of 2956.
A potential break may be indicative of another top OR a new high.
We take our chance on the basis of a proper Bullish Breakout.
Trade Plan :
Entry @ 2967
Stop Loss @ 2822
TP 1 @ 3112

XAUUSD H4 Trading Plan (Intraday Outlook)Bias: 📈 Bullish (Strong Continuation)
Current Price: ~$3,093
Context: Price is accelerating after breaking key resistance, maintaining bullish structure.
🧠 1. Market Structure (H4)
Structure remains bullish, with well-defined HH & HL.
Recent consolidation block (OB + FVG): price broke out cleanly and is now expanding.
Short-term trend leg is steep → potential for shallow intraday pullbacks.
📌 2. Key Levels from Your Chart
🔝 Upside Target
3,120.14 – Major H4 resistance / next liquidity zone
🟦 Intraday Support Zones
3,049.57 – recent H4 resistance, now flipped support (ideal for pullback entries)
3,000.65 – clean structure zone, possible FVG fill
2,977.64 – origin of last impulse
2,960.27 / 2,899.69 – deeper HTF demand / OB zones
🔍 3. Order Blocks & Liquidity
🔲 OB zone breakout (highlighted gray area) → now acting as demand
💧Buy-side liquidity rests above 3,120
Any retracement into 3,049 / 3,000 could be used by Smart Money for re-entry longs
📅 4. Trade Scenarios (H4)
✅ Scenario A: Bullish Continuation
Price holds above 3,049 → intraday continuation toward:
🎯 3,120
🎯 Potential extension: 3,150+
📌 Ideal setup: bullish engulfing or BOS + FVG entry on pullback to 3,049 zone
🔁 Scenario B: Pullback Before Continuation
Rejection near 3,100–3,120 leads to pullback toward:
🔁 3,049
🔁 3,000 (FVG / previous OB)
Monitor price action at those levels for continuation entries.
🟥 Scenario C: Bearish Shift (Low Probability for Now)
Break below 2,960 with strong bearish momentum → opens door toward:
🔻 2,899
This would invalidate current bullish short-term structure.
🧭 Summary
Trend is strong, momentum is clean → only looking for buy setups on dips.
Watch for continuation above 3,049 and especially reactive price action near 3,120.
If pullback occurs, 3,000 zone is prime location for re-entry longs.

XAUUSD Daily Trading Plan (1D Outlook)🔍 1. Structure & Price Action
Price broke out aggressively from previous consolidation (~2960–3000).
Current impulse leg is strong, with very shallow pullbacks – trending conditions.
Daily candles show sustained buying pressure, minimal upper wicks → buyers in control.
📏 2. Key Levels (from your chart)
📌 Upside Targets:
🔸 3,120.14 – potential resistance / short-term TP
🔸 3,180.72 – extended upside target if momentum holds
🟩 Support Zones:
✅ 3,049.38 – minor intraday support
✅ 3,000.66 – recent breakout retest zone
✅ 2,960.77 – clean demand zone / OB zone
✅ 2,899.69 – last major demand / strong structure support
🧠 3. SMC & Liquidity Insights
Buy-side liquidity has been cleared → clean runway toward psychological zones (3100–3200).
FVG may exist between recent candles → shallow retracement into 3049 / 3000 possible.
No active bearish OBs above → price remains in price discovery mode.
📅 4. Daily Trade Scenarios
✅ Scenario A: Bullish Continuation
Hold above 3,049–3,060 → continuation toward:
🎯 3,120
🎯 3,180+
Look for strong H4 bullish candles on retest of minor support.
⚠️ Scenario B: Pullback to Demand
Reject from 3,100+ and drop toward:
🔁 3,000 (retest previous high)
🔁 2,960 (key OB / FVG zone)
Watch for bullish reversal signals (engulfing, break of structure) for re-entry long.
🟥 Scenario C: Deeper Reversal (Less Probable)
Break below 2,899 could shift bias to neutral/short-term bearish.
🧭 Summary
XAUUSD is in a strong trending phase with no major resistance above.
Pullbacks into 3,049 / 3,000 / 2,960 are ideal areas to look for continuation longs.
Focus remains on buy-the-dip setups as long as price holds above 2,899.

GOLD 1H CHAR ROUTE MAP & TRADING PLAN FOR THE WEEKGOLD 1H Chart – 12th Feb 2025
Dear Traders,
Here’s the latest 1H chart analysis, outlining key levels and targets for the week.
Gold is currently trading between two critical levels, with a gap above 2905 and below 2883. A confirmed EMA5 crossover and lock above or below these levels will indicate the next price direction. Until then, expect price fluctuations as these levels are tested repeatedly.
Keep in mind that Inflation and CPI data are due today and tomorrow. While fundamental analysis plays a role in predicting gold's movement, our advanced technical analysis is essential for precise entry and exit points during these volatile geopolitical times.
Our strategy remains focused on buying dips and monitoring key levels to identify potential bounce opportunities. Stay sharp!
Resistance Levels: 2905, 2920, 2942, 2963, 2982, 3001, 3021, 3043
Support Levels: Gold Turn Levels : 2883, 2852, 2837, 2817,
Retracement Range: 2802 - 2817
Swing Range: 2747
EMA5 (Red Line) Analysis:
* Currently fluctuating between 2886 and 2905
* EMA5 positioning will be crucial in determining the next trading direction.
Bullish Targets:
EMA5 cross and lock Above 2905 → will open the following bullish Target 2920 ✅Done
EMA5 cross and lock Above 2920 → will open the following bullish Target 2942 ✅Done
EMA5 cross and lock Above 2942 → will open the following bullish Target 2963
EMA5 cross and lock Above 2963 → will open the following bullish Target 2982
EMA5 cross and lock Above 2982 → will open the following bullish Target 3001
EMA5 cross and lock Above 3001 → will open the following bullish Target 3021
EMA5 cross and lock Above 3021 → will open the following bullish Target 3043
Bearish Targets:
EMA5 cross and lock Below 2883 → will open the following bearish Target 2852
EMA5 cross and lock Below 2852 → will open the following bearish Target 2837
EMA5 cross and lock Below 2837 → will open the following bearish Target 2817
EMA5 cross and lock Below 2817 → will open the following bearish Target 2802 (Retracement Range)
EMA5 cross and lock Below 2802 → will open the following bearish Target 2747 (Swing Range)
Trading Plan:
* Stay bullish and buy pullbacks from key levels.
* Avoid chasing tops—focus on buying dips.
* Use smaller timeframes for entries at Goldturn levels.
* Aim for 30–40 pips per trade for optimal risk management.
* Each level can yield 20–40+ pips reversals.
Trade with confidence and discipline. Stay tuned for our daily updates! Please support us with likes, comments, and follows to keep these insights coming.
📉💰 The Quantum Trading Mastery

GOLD 1H CHAR ROUTE MAP & TRADING PLAN FOR THE WEEKGOLD 1H Chart – 17th Feb 2025
Dear Traders,
Here’s the latest 1H chart analysis, outlining key levels and targets for this week trading plan
Gold is currently trading between two critical levels, with a gap above 2905 and below 2878. A confirmed EMA5 crossover and lock above or below these levels will indicate the next price direction. Until then, expect price fluctuations as these levels are tested repeatedly.
Keep in mind that Its president day today in the US and market will remain close today.
Our strategy remains focused on buying dips and monitoring key levels to identify potential bounce opportunities. Stay sharp!
Resistance Levels: 2905, 2920, 2942, 2949, 2972, 2994, 3011
Support Levels: Gold Turn Levels : 2878, 2852, 2837, 2817, 2802, 2776, 2747
Retracement Range: 2802 - 2817
Swing Range: 2747
GOLDTURN LEVELS ARE ACTIVATED!
EMA5 (Red Line) Analysis:
* Currently fluctuating between 2878 and 2905
* EMA5 positioning will be crucial in determining the next trading direction.
Bullish Targets:
EMA5 cross and lock Above 2910 → will open the following bullish Target 2928
EMA5 cross and lock Above 2928 → will open the following bullish Target 2949
EMA5 cross and lock Above 2949 → will open the following bullish Target 2972
EMA5 cross and lock Above 2972 → will open the following bullish Target 2994
EMA5 cross and lock Above 2994 → will open the following bullish Target 3011
Bearish Targets:
EMA5 cross and lock Below 2878 → will open the following bearish Target 2852
EMA5 cross and lock Below 2852 → will open the following bearish Target 2837
EMA5 cross and lock Below 2837 → will open the following bearish Target 2817
EMA5 cross and lock Below 2817 → will open the following bearish Target 2802 (Retracement Range)
EMA5 cross and lock Below 2802 → will open the following bearish Target 2747 (Swing Range)
Trading Plan:
* Stay bullish and buy pullbacks from key levels.
* Avoid chasing tops—focus on buying dips.
* Use smaller timeframes for entries at Goldturn levels.
* Aim for 30–40 pips per trade for optimal risk management.
* Each level can yield 20–40+ pips reversals.
Trade with confidence and discipline. Stay tuned for our daily updates! Please support us with likes, comments, and follows to keep these insights coming.
📉💰 The Quantum Trading Mastery
