Gold focuses on suppression near 3038 aboveThe hourly chart suppression point of gold is around 3038. As long as the trend line is not stable, gold may still retreat. At present, we need to pay attention to whether 3038 can be stabilized. As long as you do not stand firmly above this position, you can rely on the 3030-40 range to go short.
Goldlongsetup

GOLD ALERT | BIG DROP LOADING!🏦 Institutions Are Taking Profits – Are You Ready for the Next Move?
For the last 4 weeks, institutions have been reducing their long positions on #GOLD ( OANDA:XAUUSD ). This is exactly what I warned about – profit-taking from big players, signaling potential downside ahead.
technical down

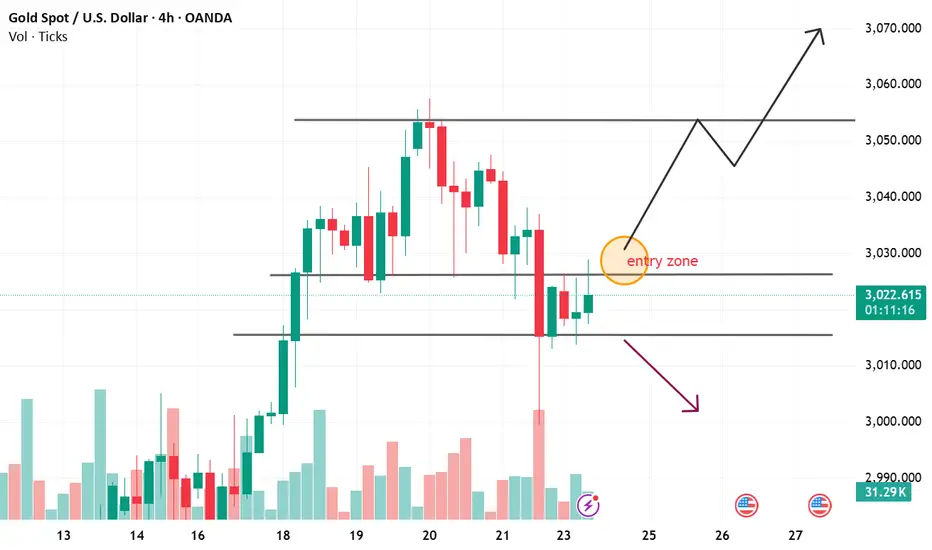
Gold (XAUUSD)📈 Current Price: $3,024.155 (+0.15%)
⏳ Timeframe: 4H (OANDA)
Volume: 27.16K
🔍 Technical Analysis
Entry Zone Identified ($3,030)
Gold is currently in a critical decision zone at $3,030, marked as the "Entry Zone."
If price breaks above this level with strong volume, it could rally towards $3,050–$3,070.
Key Resistance: Around $3,070 (previous highs).
Potential Rejection & Downside Risk
If gold fails to break the entry zone and faces rejection, it could decline towards $3,010 or even $3,000.
Support: Strong demand zone around $3,010; further support at $2,990.
Projected Move
The chart suggests a bullish breakout if gold holds above the entry zone.
Expected Upside: → $3,050 → $3,070
Bearish Scenario: If rejected, watch for a drop to $3,010 → $3,000.
🌎 Fundamental Drivers (Recent News & Market Sentiment)
📊 Fed's Rate Decision & Inflation Outlook
Fed Chair Jerome Powell has hinted at potential rate cuts by mid-2025, citing slowing inflation.
A dovish Fed stance is bullish for gold, as lower interest rates weaken the dollar and boost demand for non-yielding assets like gold.
📉 U.S. Dollar Weakness & Bond Yields
The U.S. Dollar Index (DXY) has softened, making gold more attractive to international buyers.
10-Year Treasury Yields remain volatile, but any decline favors gold.
📈 Geopolitical Tensions & Safe-Haven Demand
Rising concerns over Middle East conflicts and China-Taiwan tensions have increased demand for gold as a safe-haven asset.
Central banks (including China and India) continue to accumulate gold reserves, adding upward pressure on prices.
🏛️ Central Bank Buying
Reports indicate that China’s PBOC (People’s Bank of China) has increased gold reserves for the 17th consecutive month.
BRICS nations are also accumulating gold, signaling de-dollarization trends that could further boost prices.
🔮 Conclusion: What’s Next for Gold?
Short-Term View:
Bullish Above: $3,030, targeting $3,050–$3,070.
Bearish Below: If rejected, expect $3,010–$3,000 retest.
Long-Term View:
Given macroeconomic trends (Fed policy shift, central bank buying, geopolitical risks), gold remains in a strong uptrend.
If the Fed confirms rate cuts, $3,100+ levels become realistic in Q2 2025.
🚀 Gold traders should closely monitor the $3,030 entry zone for confirmation of a breakout or rejection. 🚀
GOLD (XAU/USD) H1 Trading Plan📉 GOLD (XAU/USD) H1 Trading Plan 📉
🔹 Wait for Sell-Side Liquidity Break! 🏦💧
Gold is currently testing key liquidity zones. Before entering a trade, we must wait for a sell-side liquidity grab (sweep of lows). Once liquidity is taken, shift to a lower time frame (M5/M15) for confirmation before executing a position.
✅ Trading Steps:
1️⃣ Identify sell-side liquidity zones (equal lows, swing lows).
2️⃣ Wait for a break below liquidity to confirm stop-hunt.
3️⃣ Look for bullish confirmation on LTF (Break of Structure, order block, or engulfing candle).
4️⃣ Enter with tight stop-loss & proper risk management.

Gold’s Big Moment: $3,000 in Play – Can Bulls Hold It?Gold has finally reached the psychological $3,000 level, triggering the first round of sell-offs as traders take profit. The question now is whether this move can sustain itself or if we are set for a deeper pullback. Given the rapid move up, I remain cautious, ready to cut the trade quickly if I see signs of weakness in the continuation.
Fundamentals:
• Market Sentiment: Bullish drivers remain strong as gold benefits from rising inflation expectations and the Fed’s rate pause, which has fueled demand for safe-haven assets.
• Geopolitical & Economic Factors:
• President Trump’s aggressive tariff agenda is fanning concerns about global trade, increasing risk aversion and driving flows into bullion-backed assets.
• Chinese jewelry stocks are soaring, signaling growing demand for gold in the region.
• The CME FedWatch Tool indicates a 97% probability that the Fed will hold rates steady at its next meeting, reinforcing gold’s appeal.
• Technical Considerations:
• Gold hit a fresh all-time high of $2,993, putting the psychological $3,000 mark in focus.
• Above $3,000, there is little historical price action to guide resistance levels, making price discovery uncertain.
• On the downside, $2,970 acts as a key pivot, with $2,951 and $2,914 serving as strong support zones if a deeper retracement occurs.
Risk Management:
• The first sell-off at $3,000 indicates short-term profit-taking.
• I am monitoring price action closely and will exit quickly if the move proves unsustainable.
Let’s see if gold can hold above $3,000 or if we are in for a correction!
Note: Please remember to adjust this trade idea according to your individual trading conditions, including position size, broker-specific price variations, and any relevant external factors. Every trader’s situation is unique, so it’s crucial to tailor your approach to your own risk tolerance and market environment.
Gold Now Low 2860 $Gold now low possible in near future as 2860 $ ,as per my view, this is price based study, after this price new high is possible .

GOLD | XAUUSD Weekly Market Forecast: Mar 10-14 In this video, we will analyze the GOLD Futures. We'll determine the bias for the upcoming week, and look for the best potential setups.
Gold has consolidated for the last half of the previous week. Trading in a ranging market is not recommended! But waiting until there is an obvious sweep of the high or low liquidity pools can give us an indication which side the market will break the consolidation. Patience and a watchful eye will allow us to take advantage of the momentous opportunity.
Enjoy!
May profits be upon you.
Leave any questions or comments in the comment section.
I appreciate any feedback from my viewers!
Like and/or subscribe if you want more accurate analysis.
Thank you so much!
Disclaimer:
I do not provide personal investment advice and I am not a qualified licensed investment advisor.
All information found here, including any ideas, opinions, views, predictions, forecasts, commentaries, suggestions, expressed or implied herein, are for informational, entertainment or educational purposes only and should not be construed as personal investment advice. While the information provided is believed to be accurate, it may include errors or inaccuracies.
I will not and cannot be held liable for any actions you take as a result of anything you read here.
Conduct your own due diligence, or consult a licensed financial advisor or broker before making any and all investment decisions. Any investments, trades, speculations, or decisions made on the basis of any information found on this channel, expressed or implied herein, are committed at your own risk, financial or otherwise.

3.7 Gold wedge wide consolidation, waiting for non-agricultural 2928 is the defensive point, short near 2923, if weak, it is 19-20 here, once the four-hour below the medium-term moving average, it is dispensable for the evening data, basically it is a rebound short, pay attention to the three points below 95-84-65. Personally, I expect that today will be a Black Friday.
Trading is for profitable trading, not for gambling or trading, so traders must understand what operations to take at what stage the price is! Traders are not always long or short, and traders always change with market changes! Traders must have their own defense system to control risks!

Gold will hit new highsFrom the current gold daily chart, gold prices are defending above $2,900/ounce. However, only if the gold price closes above the static resistance of $2,930/ounce, the upward trend may regain traction. The relative strength index (RSI) has fallen slightly, but it remains above 50, indicating that the bullish potential still exists. At the same time, if the non-agricultural data rises to 2,930 today, there is still the potential to break the high!
Then the current gold price is still strong. There is a little pressure on 2922 in the short term, but the upward trend remains unchanged. As long as it does not fall below 2,900, it will continue to be bullish in the short term.
The best trading method is that the price has repeatedly stepped back to confirm the support of 2912-2914 and sprint upward, so you can continue to do more gold around here and defend the 2910 area. If it does not fall below 2910, the price is expected to break upward to the 2920-2923 range, and it will be expected to rise further, looking for 2930, and then 2945-2947

GOLD NEXT MOVE POSSIBLE (READ) Gold Bulls Rejoice: Price Correction Presents Buying Opportunity
After a near 3% pullback this week, Gold's price (XAU/USD) is poised to rebound, driven by robust fundamentals and a weakening US dollar. The precious metal's correction presents a buying opportunity for investors seeking to capitalize on the ongoing tariff tensions and growing demand for safe-haven assets.
Key Levels to Watch:
- Support: $2,790 (strong demand zone), $2,835 (moderate support), and $2,856 (minor support)
- Resistance: $2,888 (daily Pivot Point), $2,909 (daily R1), and $2,941 (daily R2)
Market Sentiment:
The daily digest market movers indicate a risk-on mood, with investors seeking safe-haven assets like Gold. The CME Fedwatch Tool shows increasing odds of a June rate cut, which could further boost Gold prices.
Growing Demand:
Gold ETFs are seeing significant inflows, with onshore fund holdings increasing by 17.7 tons in the first three weeks of February. This growing demand, combined with ongoing geopolitical tensions, sets the stage for a potential breakout above $3,000.
What's Next?
Our experts predict a strong rebound in Gold prices, driven by the confluence of technical and fundamental factors. Stay tuned for our weekly XAU/USD forecasts, where we provide insights into the next possible moves of the gold-dollar pair.
Best regards Travis ❤️

Updated XAU/USD (Gold) Multi-Timeframe Analysis – March 4, 2025Analyzing M15, M30, H1, H4, and D1 charts for a precise trade execution strategy.
1. Market Structure Overview (Multi-Timeframe)
M15 (15-Minute Chart)
CHoCH (Change of Character) indicates bullish momentum.
Currently testing equilibrium (~$2,888 - $2,890).
Weak high at PDH (Previous Day’s High) around $2,893, which may act as resistance.
M30 (30-Minute Chart)
Break of structure (BOS) confirms bullish short-term trend.
Price is hovering near PDH ($2,893).
If it fails to break above $2,895, a short-term rejection is possible.
H1 (1-Hour Chart)
Bullish CHoCH confirms the short-term uptrend.
PDH ($2,893) remains a crucial level.
If broken, a rally toward $2,910 - $2,920 is likely.
H4 (4-Hour Chart)
Testing supply zone at PDH ($2,893).
Potential retracement to $2,865 - $2,870 before continuation higher**.
D1 (Daily Chart)
Price bounced from a key demand zone around $2,850.
Still bearish on the higher timeframe unless price reclaims $2,920 - $2,950.
If $2,900 - $2,920 rejects, more downside is expected.
2. Expected Scenarios & Probability
Scenario 1: Short-Term Bearish Rejection (60% Probability)
If price fails to break $2,895 - $2,900, expect a rejection down to $2,870 - $2,865.
Confirmation: Bearish rejection candle at PDH ($2,893).
Scenario 2: Bullish Breakout (40% Probability)
If price closes above $2,895, expect a move toward $2,910 - $2,920.
Confirmation: Strong breakout and candle close above $2,895.
3. Trading Plan
Sell Setup: (Primary Trade - 60% Probability)
Entry: $2,893 - $2,895.
SL: $2,905 (Above resistance).
TP1: $2,880 (First liquidity level).
TP2: $2,870 (Discount zone).
TP3: $2,865 (Major demand zone).
Risk-Reward Ratio: 1:3.
Buy Setup: (Countertrend - 40% Probability)
Entry: $2,895 - $2,900.
SL: $2,885 (Below weak low).
TP1: $2,910 (Short-term liquidity).
TP2: $2,920 (Key supply zone).
Risk-Reward Ratio: 1:3.
4. Final Trade Execution Summary:
Trade Type Entry Stop-Loss Take-Profit 1 Take-Profit 2 Take-Profit 3 R:R
Sell Setup $2,893 - $2,895 $2,905 $2,880 $2,870 $2,865 1:3
Buy Setup $2,895 - $2,900 $2,885 $2,910 $2,920 - 1:3
📌 Additional Execution Tips:
Watch for a rejection at $2,893 - $2,895 before shorting.
If price closes above $2,895, shift to buy mode.
Use M5/M15 for precise entries and candle confirmations.
Avoid entering during high-impact news releases.
Risk per trade: 1-2% of capital for optimal risk management.

3.4 Short-term technical analysis of goldLatest technical analysis of gold
Despite the rebound in gold prices in the Asian session on Monday, the technical side of gold prices deserves caution before making new bullish bets.
From a technical perspective, gold prices fell below the 23.6% Fibonacci retracement level of the rebound from December to February last year last week, which is seen as a key trigger by sellers. In addition, oscillators on the daily chart have just begun to gain negative traction and support the prospect of gold prices continuing the corrective pullback from the historical peak.
Therefore, any subsequent gains may still be seen as selling opportunities and are limited near $2,885/oz. The $2,900/oz mark is closely followed, and if it is broken, gold prices may climb to $2,934/oz before moving towards the record high near $2,956/oz.
On the other hand, Friday's swing low (around the $2,833-2,832/oz area) now seems to protect the recent downside. If it falls below the above area, gold prices may fall to the 38.2% Fibonacci level (around $2,815-2,810/oz). If gold encounters some follow-up selling and falls below the $2,800/oz mark, it may indicate that gold prices have peaked and may pave the way for further declines.

XAUUSD ( GOLD ) TODAY'S CHART MAPPING IN 30M TFWelcome To Another Day Of TRADING Guys
As you know Xauusd is already at higher position and it's still in buying zone
Probably Xauusd make again 2790 so here is set-up for today
Support level 2770
2nd Support level 2762/59
Target well be. 2789
Let me know your thoughts in the comments section have a good trade guy's

GOLD | Bearish Reversal Pattern – More Downside Ahead?### **Analysis & Description:**
This is a **1-hour chart of XAU/USD (Gold vs. U.S. Dollar)** from TradingView, highlighting a **bearish trend reversal pattern**. The price action forms a series of **lower highs and lower lows**, indicating a clear **downtrend formation**.
#### **Key Observations:**
1. **Lower Highs & Lower Lows:**
- The chart outlines a classic **bearish market structure** with multiple rejection points.
- Each bullish rally is met with strong selling pressure, leading to a downward continuation.
2. **Momentum Weakness (MACD Indicator):**
- The MACD at the bottom indicates **bearish momentum**, with both the MACD line and Signal line in negative territory.
- This suggests that selling pressure dominates and further downside movement is likely.
3. **Price Projection:**
- The final arrow suggests **further downside movement**, possibly breaking below key support zones.
- If price breaks below the **$2,807 support**, it could accelerate selling toward **$2,780 – $2,750 zones**.
4. **Possible Trading Strategy:**
- **Bearish Confirmation:** Traders should watch for a breakdown below **$2,807** for a short-selling opportunity.
- **Bullish Reversal?:** If price forms a strong support at **$2,807**, we may see a bounce before further downside.
### **Conclusion:**
Gold is currently in a **short-term downtrend**, and traders should be cautious of potential bearish continuation. However, **fundamental news events** could also impact price action, so it's essential to monitor economic data and market sentiment.
#### **Key Levels to Watch:**
- **Support:** $2,807 – $2,780
- **Resistance:** $2,846 – $2,880
📉 **What do you think? Will gold continue to drop, or will we see a reversal soon? Drop your thoughts below!** 🚀

Gold 5hr TFGold required a stronger pullback to a zone with more confluence, and now with the DXY dropping—something that's heavily correlated—I expect gold to trend toward $3000. Silver is also showing bullish price action, which is a good sign that gold will start moving higher as well.

Gold 30m TFGold is showing strong bullish momentum right now. It’s currently experiencing a pullback, but I expect it to rebound at my key level of interest and continue its upward trend, potentially reaching $3000 within the next month.

90% of traders struggle in the GOLD market, are you the same?From the current 4-hour trend, the support point below is 2905-2908. The short-term pressure level above is around 2940-2943, and the overall support is in this range. The rhythm of high-altitude low-multiple cycles is maintained, but David believes that GOLD will break through the short-term pressure level. In the middle position, keep more watching and less action, and be cautious in chasing orders, and wait patiently for key points to enter the market.
BUY:2927
TP:2940-2950
SL:2894 OANDA:XAUUSD TFEX:GO1!

XAUUSD NEXT MOVE IN 30M TFHello Guy's Welcome To Another Day Of TRADING
Here we are mapping chart of XAUUSD ( GOLD ) in 30-M TF
Support (Lower Trendline): Around 2888 – 2884
Resistance (Upper Trendline): Around 2925 – 2930
A breakout above or below these levels will determine the next strong move.
If price respects the lower trendline and moves up, buying opportunities could be considered with a target near resistance.

Shocking comprehensive analysis of GOLDDear traders:
The current gold price is $2920.34/ounce, and the short-term support level is in the $2880/ounce-$2850/ounce area. If it falls below $2850/ounce, it may trigger a change in the situation.
The current resistance level is $2940/ounce. After breaking through, there is a great hope to move towards the $3000/ounce mark
Market dynamics:
Global trade tensions still exist, such as US President Trump's threat to impose tariffs on cars on April 2, and the hope of peace talks in the Russian-Ukrainian conflict is still uncertain. The continued geopolitical uncertainty supports the demand for gold as a safe-haven asset.
The market has high expectations for the Fed's interest rate cuts. Traders expect that interest rates may be cut in September or October, which has enhanced the attractiveness of gold, but the hawkish remarks of Fed officials such as Michel, Bowman, Kritosfo, Waller, etc. have limited the rise of gold.
If you agree with my analysis, please continue to pay attention. I will share my views for free later-(David)
If you don't know when to trade, you can continue to pay attention TFEX:GO1! OANDA:XAUUSD

XAUUSD TODAY'S MAPPING IS HERE Hello Guy's Welcome To Another Day Of TRADING
Here we are mapping chart of XAUUSD ( GOLD ) in 15-M TF
Ascending triangle pattern: Trendlines indicating higher lows and a horizontal resistance level.
Breakout and retest: The price has broken above the resistance and appears to be retesting the breakout level.
Trade setup:
Entry Level: Near the breakout retest point.
Take-profit: Near 2951
Stop-loss: Around 2900
This analysis indicates a bullish sentiment, expecting gold to rise further if the breakout holds.

Bullish Gold (XAUUSD)The following are my reasons to buy:
* Bull Trend;
* Price is seating at a strong support between 2.882,46 - 2,890 levels following with wick rejections on H4;
* Price is above 50 on RSI;
* On the LTF (30min) the price crossed up on MACD ;
* USA yields are pushing lower, since Gold is a safe heaven, it will tend to go up.

GOLD 4H CHART ROUTE MAP TRADING PLAN FOR THE WEEK4H Gold Analysis – 10th Feb 2025
Dear Traders,
Here’s our updated 4H chart analysis, including key levels, targets, and Goldturn levels for the week.
Gold is currently fluctuating between two weighted levels, with gaps above 2876 and below 2850. A confirmed EMA5 crossover and lock above or below these Goldturn levels will determine the next trading range. Until then, expect levels to be tested side by side.
Trading Strategy:
* Maintain a bullish bias and use pullbacks as buying opportunities.
* Avoid chasing tops; instead, buy dips from key levels.
* Use smaller timeframes for pullback entries at Goldturn levels.
* Aim for 30-40 pips per trade for effective risk management.
Bullish Targets
EMA5 cross and lock Above 2876, will open the following bullish target 2903
EMA5 cross and lock Above 2903, will open the following bullish target 2925
Bearish Targets
EMA5 cross and lock Below 2852: will open the following bearish target 2828
EMA5 cross and lock Below 2828: will open the following bearish target 2803
EMA5 cross and lock Below 2803: will open the following bearish target 2776 (Retracement Range)
EMA5 cross and lock Below 2776: will open the following bearish target 2747 (Swing Range)
Trade with confidence and discipline. Stay updated with our daily insights!
Support us with likes, comments, boosts, and follows!
📉💰 The Quantum Trading Mastery

$XAU TAKE PROFIT 3 DONE & Price Serged 8.75% ~ $2963 ATH NOW BITGET:XAUTUSDT TAKE PROFIT 3 DONE & Price Serged 8.75% ~ $2,963 ATH NOW
Disclaimer: This article is for informational purposes only and does not constitute financial advice. Always conduct your own research before making any investment decisions. Digital asset prices are subject to high market risk and price volatility. The value of your investment may go down or up, and you may not get back the amount invested. You are solely responsible for your investment decisions and Binance is not available for any losses you may incur. Past performance is not a reliable predictor of future performance. You should only invest in products you are familiar with and where you understand the risks. You should carefully consider your investment experience, financial situation, investment objectives and risk tolerance and consult an independent financial adviser prior to making any investment.
