Next week's ups and downs analysis and operation ideasGold closed with a long upper negative line in the weekly chart last week, and retreated to the lowest level of 3260 after being under pressure at the integer level of 3500. So can the decline continue next week?
First, let's look at a few weekend fundamental news: The Federal Reserve's financial report said that global trade wars and policy uncertainties are the biggest risks to financial stability, and have also led to concerns about the value of the US dollar in most countries. Secondly, the Federal Reserve officials made remarks that interest rates may be cut in June, and the geopolitical situation has become unstable, which has also provided some support for the price of gold in the short term.
Technical aspect: The bald positive line closed on Friday's 4-hour and 1-hour lines. If it opens flat at the beginning of the week, it is likely to continue the recent morning cycle recovery rhythm. Note: After the daily level suppressed the decline of 3500, it has been fluctuating in a large range for three consecutive trading days.
The upper and lower edges are relatively clear 3385-3260. According to the recent morning cycle recovery rhythm, the bullish momentum will basically be released before 10 o'clock. Therefore, if the market cannot continue to rise after 10:00 at the beginning of the week, the European session will continue to fluctuate downward. In particular, it cannot break through the upper edge of the daily oscillation cycle before 3385.
Operation: Open flat at the beginning of the week. Short-term support focuses on 3300. Strong support: 3260-70
Pressure level: Gains and losses of key pressure near 3385
Goldlongterm

Trump's remarks may cause a stir in gold
💲Let's comment on the price of gold next week from April 28, 2025 to May 2, 2025
🌐World situation
Earlier, it was reported that China has exempted some US goods from tariffs, a development that has suppressed the safe-haven appeal of gold.
But on the 25th, US President Trump told reporters on Air Force One that unless China makes substantial concessions, it will not cancel the tariffs imposed on China. Over the past week, the US has continued to send confusing and even contradictory signals on the issue of tariffs on China, and market sentiment has deteriorated.
On the 26th, after a brief meeting between US President Trump and Ukrainian President Zelensky in the Vatican, both sides also sent "positive" signals.
Will the Russian-Ukrainian conflict usher in a turning point?
The General Staff of the Ukrainian Armed Forces reported later that day that fighting in the Kursk region was still ongoing. The Ukrainian army held its ground and used a variety of weapons to carry out effective firepower strikes on the enemy, causing losses to the Russian army. The Ukrainian General Staff stressed that the Ukrainian troops were not surrounded and that Russia's statement on the end of hostilities in the region was "purely propaganda in nature." The Ukrainian General Staff also said that fighting by the Ukrainian army in local areas of Belgorod Oblast is still ongoing.
The escalation of the India-Pakistan conflict may also increase safe-haven buying of gold.
📊Comment Analysis
Earlier this week, investors withdrew $1.27 billion from the SPDR Gold Shares ETF, the largest single-day outflow since 2011. At the same time, gold prices hit an all-time high above $3,500, suggesting that there may be some profit-taking factors. In 2011, similar outflows coincided with the peak of gold's last super cycle, marking the beginning of a long period of consolidation for gold, which was not broken until 2020. But this does not guarantee that this will be a turning point, and there are still many positive factors at work, including trade uncertainty, safe-haven demand, central bank demand, and Wall Street's calls for further increases in spot gold prices.
Next week, the gold market will welcome the release of the World Gold Council's first quarter "Gold Demand Trends" report. In addition, US President Trump's 100th day rally on Tuesday may become an important window for gold prices to choose to test the 3,500 mark again or continue to fall from 3,300.
🔷Technical aspect:
Based on the resistance and support levels of gold prices in the H4 framework, Labaron has identified the following important key areas:
Resistance: $3357, $3498
Support: $3228, $3155
✔Operational suggestions
Short-term trading:
Bearish strategy:
If the gold price rebounds to the range of $3,330-3,350, you can try to short, with a target of $3,250 and a stop loss of $3,355.
Bullish strategy:
If the gold price holds the support of $3,260, you can go long with a light position, with a target of $3,330 and a stop loss of $3,240.
Long-term investors: Pay attention to the Fed's policy trends and geopolitical situation. If the gold price falls back to below $3,200, consider investing in batches.
💥Risk Warning
Liquidity risk: Market trading may be bearish in early May, and price fluctuations may be amplified.
Policy black swan: Trump may suddenly announce tariff policies or personnel changes at the Fed, triggering violent market fluctuations.
Technical false breakthrough: There are a large number of stop-loss orders near $3,350, so be wary of reversals after inducing more.
Summary:
Next week, the gold market will be affected by geopolitics, Fed policies and the trend of the US dollar, and the expected fluctuation range is $3,250-3,350. Investors need to pay close attention to key support and resistance levels and adjust strategies flexibly.

Analysis of gold price trend next week!Market news:
Spot gold fell nearly 1% on Friday, closing at 3316. Although the price of gold closed above 3300 this week, the trend of London gold prices this week can be described as ups and downs. Intraday transactions have fluctuated by nearly $100 many times. Under the situation of trade tensions, the market has a high risk aversion sentiment, pushing the international gold price above 3500. The easing of global tensions, especially between the United States and China or in Eastern Europe, may significantly reduce the demand for safe havens. Although this is not the base case in 2025, it is still an unexpected risk that traders must consider. In fact, after US President Trump hinted that tariffs on my country may be reduced! The positive risk tone weakened the demand for safe-haven assets. In addition, optimistic US macroeconomic data on Thursday supported the US dollar, which also hit gold prices. Next week, the gold market will welcome the release of the World Gold Council's first quarter "Gold Demand Trends" report. In addition, Trump's 100th day rally on Tuesday may become an important window for gold prices to choose to test the 3,500 mark again or continue to fall from 3,300. In the short term, gold prices may face technical corrections and profit-taking pressures, and the $3,260-3,300 area will be the key battlefield for long and short tug-of-war.
Technical Review:
From the perspective of market sentiment, interest-free gold as a safe-haven asset has performed strongly this year, and its price has soared by nearly $700 and refreshed its historical high several times. However, the recent optimistic expectations of easing global economic and trade relations have boosted market risk appetite, and the equity market has generally performed positively. Some funds have flowed out of safe-haven assets such as gold and turned to risky assets, which is also the main psychological factor under pressure on gold prices. If the market risk appetite continues to improve, global economic and trade relations further ease, and the US dollar strengthens, gold prices may face greater downward pressure and will first test the $3,260 support. If it fails, it may drop to $3,225 or even challenge the $3,200 integer mark. In addition, if the US economic data performs strongly, the market's expectations for the Fed's interest rate cut may further cool, which will also put pressure on gold prices. From the performance of the daily chart, the recent trend of gold prices has shown a high consolidation trend, and there has been a significant correction from the high point near $3,500. After hitting the low point of the week, gold prices rebounded to a certain extent, but the rebound strength was blocked near the 23.6% Fibonacci retracement level (about $3,368-3,370), which has now become an important short-term resistance. The weekly gold line is also a shooting star with a long upper shadow line at a high level. If gold does not have the support of big bullish news in the short term, then gold will still be under pressure at a high level in the short term, and the daily line is also down from a high level without a strong counterattack. Overall, there is still room for adjustment in the short term for gold.
Analysis for next week:
In view of the important trend of gold prices breaking through key points, the subsequent market will most likely continue to sell. From the current market structure, the position of $3260 has become the focus of the market. Investors need to pay close attention to whether the gold price can reach or even fall below this point. Once it effectively falls below, the selling trend will be further strengthened, and the market may usher in a deeper adjustment. The gold 1-hour moving average continues to sell, but after gold bottomed out near the first-line support of 3265, gold rebounded by more than 50 US dollars. Is this rebound a reversal? Not necessarily, because now it basically fluctuates by about 100 US dollars every day, and it is difficult to say that a rebound of 50 US dollars is a reversal. The strength of next week is the key. If the rebound of gold next week is not very strong, then gold will still fluctuate and sell. The resistance of the gold 1-hour moving average is near 3354, and the top of the gold negative line on Friday is near 3352. If there is no effective breakthrough of these two positions next week, it will still fluctuate and sell.
Operation ideas:
Buy short-term gold at 3275-3278, stop loss at 3267, target at 3310-3330;
Sell short-term gold at 3363-3366, stop loss at 3375, target at 3300-3310;
Key points:
First support level: 3300, second support level: 3285, third support level: 3260
First resistance level: 3327, second resistance level: 3343, third resistance level: 3366

Tariffs have not eased. How will gold trend in the future?Spot gold fell nearly 1% on Friday to close at 3316.26. Earlier this week, gold rose to a record high of 3500. After Trump's statement on tariffs eased, the market rose to 3500 and investors chose to close their long positions. The lowest gold price this week fell to around 3260.
At the moment when tariffs are deadlocked, any remarks made by Trump on tariffs have not reduced the risk of the market, but increased the uncertainty of the market. Next week, the gold market will usher in the World Gold Council's first quarter "Gold Demand Trends" report. In addition, next week's gathering of Trump's 100th day in office may become an important window for gold prices to choose to test the 3500 mark again or continue to fall from 3300.
This week, the international gold price as a whole showed a high and then fell, with the opening price at $3332.96, the highest price at $3499.92, the lowest price at $3260.2, and the closing price at $3316.2. After such a pattern appears, it indicates that the gold cycle will face violent fluctuations.
Quide's analysis:
If international news helps short selling, it is possible for gold to fall to 3100 or fall below 3000. Therefore, we should remain vigilant next week and pay close attention to the geopolitical situation and news such as tariffs, so as to make a buying or selling decision for next week.
At present, the Bollinger Bands continue to close, and the short-term market continues to maintain a range consolidation until the Bollinger Bands reopen and choose a new direction.
Before the upward and downward ranges are broken, the intraday short-term operation adopts the range high-altitude low-multiple operation.
There is currently no international news and comments that can analyze the trading signals for next week; Quide will pay attention to news and comments that may affect the trend of the gold market at any time, so as to bring analysis and strategies to everyone at any time.
Every calm analysis by Quaid is a step towards success. In the gold market, please trust Quaid's professional analysis. It can help you stand at the top of the gold trading market.

GOLD anyone ?...
hmmm...
...looking at this for a minute a day to smile, relax and recalibrate lasers

Interpretation of ideas after gold opensTechnical pattern: This week, gold closed in a "shooting star" pattern, which is a common peak signal, indicating that the price of gold may face a correction or decline.
Influence of news: This week, affected by Trump's tariffs and dismissal of Powell, gold first hit a record high of 3500 due to its safe-haven properties. Then Trump's remarks changed, and the price of gold plunged from the high point to around 3260. Overall, it ended in a volatile situation under the uncertainty of tariffs, Powell's stay and interest rate cuts. If there are no new safe-haven factors in the market news, there is room for further decline in the price of gold.
Short-term trend analysis
Four-hour level: After the safe-haven, the price of gold rebounded at the low point of 3260, but was unable to continue near 3370. It is believed that the high-level selling repair and low-level buying intervention have affected it. The opening of the gold price next week may continue to fall.
Hourly level: Since the decline in the price of gold, the rebound strength has been insufficient. It rebounded twice near 3260 below, and the overall center of gravity was downward before crossing 3380. Next week, pay attention to the 3330-3346 range to determine the nature of the rebound at the end of this week. At the same time, pay attention to whether 3260 can be broken. If there is a break, you can look down to 3221.
Operational suggestions: Overall, the overall idea for next week will continue to be bearish. Pay attention to the resistance of the 3330-3346 range on the top, and try to go short if it is touched; the initial support below is 3260, and the bearish trend can continue to 3221-3219 if it breaks.
Suggestions for being stuck at high positions: For investors who are standing guard at high positions, if they can withstand the pullback of gold prices, they can continue to hold and wait for the return of their capital; if not, it is recommended to recognize the loss and leave the market first, and then enter the market after the gold price has adjusted to the right level.

Will the gold market cool down after the easing of tariffs betweIf you want to use one word to describe the performance of the global financial market in the 2025 quarter, then in addition to the roller coaster, there is another word that will be particularly applicable: "safe haven is king".
After Trump launched the tariff storm, this directly pushed the gold price to a historical high, setting the strongest quarterly performance since 1986; and the increase in tariffs led to frequent surges in gold, and after the tariffs were eased, gold also experienced a sharp correction, and this week's gold market was very lively. The price of gold is like a roller coaster ride, making countless investors love and hate it.
Quaid's analysis:
Gold is adjusted in the short term, and it is still bullish in the long term.
In the short term, the US has a high voice for trade negotiations, the market risk appetite has rebounded, and Trump has forced the Federal Reserve to slow down. The independence of the Federal Reserve has been temporarily maintained. The short-term upward trend of gold prices may be weak, and the medium- and long-term bullish trend has not changed. The price adjustment space is also limited. In the short term, it is expected that the gold price will be mainly volatile and consolidated. Continue to pay attention to the progress of Sino-US trade negotiations and Trump's policy trends.
The long-term bullish view remains unchanged; the expectation of stagflation in the United States and the increase in the probability of recession if the Federal Reserve continues not to cut interest rates are the logic of medium-term bullish gold, and the continued cycle of US dollar credit contraction is the core support for long-term bullish gold.
There is no international explosive news for the weekend, and Donald Trump has not made any radical remarks for the time being. Quaid has no operational suggestions for the time being, and can only analyze based on the market trading situation this week. I hope to help everyone understand the current market situation and long-term analysis.
Quaid will continue to pay attention to international news and Mr. President's remarks in order to bring you real-time market analysis and suggestions at any time.

GOLD → Gold Market Forecast and AnalysisFor most of the period from 2025 to now, gold prices have risen almost continuously, hitting new all-time highs. Since October 2022, gold prices have almost doubled, rising by more than 25% in 2025 alone, reaching a new all-time high of $3,500 per ounce on April 22. The $4,000 price level, once considered untouchable, is now openly discussed in trading halls around the world.
The easing of global tensions, especially between the United States and China or in Eastern Europe, could significantly reduce safe-haven demand.
While this is not the base case for 2025, it is still an unexpected risk that traders must consider. In fact, gold prices have retreated from recent highs after US President Trump hinted that tariffs on China might be reduced.
The sharp rise in gold prices increases the possibility of a correction. If the upward momentum slows, profit-taking could trigger a rapid and violent sell-off. As with any parabolic rise, volatility is inevitable; prices often experience a short-term downward trend before setting new all-time highs. Traders with short-term strategies should be aware of such price declines and practice risk management: avoid large trades, set stop-losses, and diversify their portfolios.
Quaid wants to say:
Opportunities always come to those who dare to act. Be bold in the gold market, and the next winner will be you, my friend.

The gold weekly line is about to close and the short position coThe downward trend remains unchanged!
At the same time, after the current decline in gold, traders who have positions above should pay attention that the early morning rebound cannot exceed the stage pressure of 3292-3300. The larger the rebound, the weaker the downward momentum. After a continuous decline, the 3260 position can be seen below. After breaking, the 3230 point needs to be paid special attention to below. This is the golden section position of 50% retracement since the rise from 2956 to 3500 in this round. It is also a multiple resonance area in the trading concentration area. After reaching this point, traders who hold short positions should consider being more cautious.

Gold-----Buy near 3311, target 3340-3360Gold market analysis:
Gold has been volatile these two days. We said that we can buy and sell in the operational analysis, but in fact, it is more difficult. Think about it from another perspective. Intercepting it is a counter-trend transaction. Although the position you intercept is support, or even the low point of the shock, the possibility of it breaking is also increasing. In the past two days, the gold daily line has been a combination of one Yin and one Yang, and buying and selling have begun to fluctuate in structure. Today's idea is that we must first rely on yesterday's shock low point to go bullish on the big trend. Short-term operations need to chase, the amplitude is large, and the profit is also large. Today is Friday, plus the daily adjustment of the daily line, the weekly line also needs to close. Buying is expected to rise in the evening and the European and American sessions, but the Asian session will still fluctuate. The Asian session will intercept up and down. Pay attention to the closing of the weekly line today. If the weekly line cannot be closed today, selling will begin next week.
Gold market analysis:
Gold has been volatile these two days. We said that we can buy and sell in the operational analysis, but in fact, it is more difficult. Think about it from another perspective. Intercepting it is a counter-trend transaction. Although the position you intercept is support, or even the low point of the shock, the possibility of it breaking is also increasing. In the past two days, the gold daily line has been matched with one Yin and one Yang, and the buying and selling have begun to fluctuate in structure. Today's idea is that we must first rely on yesterday's shock low point to go bullish on the big trend. Short-term operations need to chase, the amplitude is large, and the profit is also large. Today is Friday, plus the daily adjustment of the daily line, the weekly line also needs to close. Buying is expected to rise in the evening and the European and American sessions, but the Asian session will still fluctuate. The Asian session will intercept up and down. Pay attention to the closing of the weekly line today. If the weekly line cannot be closed today, selling will begin next week.
In the Asian session, we focus on the large range of 3311-3360. The low point is 3305. The Asian session 3305-3311 is a super support and suppression position. The high point of yesterday's rebound was 3344. This position is a small suppression position in the Asian session. The rebound high point of the Asian session 3370 is estimated to be a big suppression in the Asian session. The hourly pattern suppression position is 3353-3360. The Asian session range is out, and we can operate well. If the Asian session does not break 3305, we will see a structural rebound at night. If it breaks, we will sell.
Support 3311-3305, suppression position 3344, strong pressure 3353-3360, and the watershed of strength and weakness in the market is 3330.
Fundamental analysis:
It's Friday again. The US dollar has fallen continuously and gold has risen continuously. The fundamentals and data released have long supported gold to suppress the US dollar.
Operation suggestions:
Gold-----Buy near 3311, target 3340-3360

4.25 gold short-term operation technical analysis!Spot gold suddenly fell sharply during the Asian session on Friday (April 25). At the end of the session, the current gold price was around $3,307/ounce, a plunge of more than $40 during the day.
Gold prices turned lower on Friday as hopes of a trade deal between China and the United States weakened safe-haven assets. The positive risk tone weakened the demand for safe-haven assets. In addition, optimistic US macroeconomic data on Thursday supported the dollar, which also hit gold prices.
Cleveland Fed President Hammack made it clear in an interview on Thursday that the Federal Reserve has basically ruled out the possibility of a rate cut in May. But she also released key information that if there is clear evidence of the direction of the economy, there is room for policy action in June.
Gold prices are currently supported near the $3,300/ounce mark, which is also the 38.2% Fibonacci retracement level of gold prices from this month's low (around $2,950/ounce) The latest round of gains is located.
If gold price falls below the $3300/oz mark, the next support for gold price is the weekly low near the $3260/oz area; if it falls below the above area, gold price may accelerate its decline and fall to the 50% retracement level (i.e. the area near $3225/oz) and finally fall to the $3200/oz mark. Some follow-up selling will indicate that gold has peaked and turn the short-term bias in favor of bearish traders.
Gold price resistance is around the $3368-3370/oz area, which should be a key level now. If it breaks through the above area, gold price may return to the $3400/oz mark. The subsequent rise may push gold price further to the $3425-3427/oz barrier. Once this barrier is overcome, bulls may retry to conquer the psychological $3500/oz mark.

Interpretation of 4.25 Gold Short-term Operation IdeasFrom the technical analysis of the hourly market, yesterday's low was at $3,306, and the rebound just now showed an obvious stop signal at this position. Based on this, the current short-term suppression level can refer to $3,315, and the higher level is $3,328. For short-term investors, you can consider waiting for the gold price to rebound to around $3,315 to arrange short orders and continue to be bearish on the gold price. The first thing to pay attention to below is the support of the low point just touched at $3,287. If this support level is lost, the next key support level will be $3,260, the first low point on the previous downward journey. If $3,260 is also effectively broken, the short-selling force will be further released, and the gold price may face a larger decline.

Confrontation between India and Pakistan pushes for risk aversioYesterday, the gold market opened at 3291.1 in the morning and then the market rose directly. The daily line reached a high of 3367.7 and then fell under pressure. The daily line finally closed at around 3345, and the daily line closed with a long upper shadow line. After this pattern ended, the short positions at 3496, 3468 and 3442 this week were reduced and the stop loss was followed up at 3400.
SELL: 3340 Stop loss: 58
TP1: 3330
TP2: 3320
TP3: 3305
BUY: 3300 Stop loss: 3295-92
TP1: 3320
TP2: 3335
TP3: 3360
We will update regularly every day to introduce how we manage active thinking and settings. Thank you for your likes, comments and attention. Thank you very much

Interpretation of gold short-term operation ideasAfter a surge in the morning, gold was suppressed and fell again in the afternoon and has been in a narrow range of fluctuations!
Evening operation ideas:
If the European session does not continue the Asian session's pull-up and continue to strengthen, the probability of evening fluctuations will increase. After a sharp pullback, it is not easy for gold to turn strong in the short term, so before yesterday's opening is broken, the possibility of continued pullback will increase!
Short-term suppression of the US market: 3330-35, look at a high and then fall
Support below: 3310-3300-3293
Data reference: The Federal Reserve will release the Beige Book of brokerage conditions at 2 a.m.
Trump will sign an executive order at 5 a.m.

Gold short-term trading looks at retracements
Don't make things difficult for yourself, don't waste the time, don't expect any sudden surprises, just hope there will be no sudden troubles, and that will be good enough.
Today, we will focus on the suppression of 3361-67. If this level is not broken, it may weaken and fall. Of course, if it breaks and rises, the price may still be strong. Therefore, short-term operations around this range today can be carried out with a stop loss of 3175 and a take-profit of 3317/3300. Only when it falls below can we further look at 3280-3250
Gold short-term trading: short near 3365, stop loss 3375, take profit 3317/3300
Hello traders, if you have better ideas and suggestions, welcome to leave a message below, I will be very happy
Gold re-surged at $3,400. China denies tariff negotiations with International gold prices rebounded as investors bought on dips after a sharp drop in the previous trading day, while the market focus remained on U.S.-China trade tensions.
As of press time, spot gold rose 1.6% to $3,340.79, reaching a high of $3,367 in the Asian session. Gold fell more than 3% on Wednesday, the biggest one-day drop since late November last year.
In addition, the decline in the U.S. dollar index made dollar-denominated gold cheaper for overseas buyers, which also supported gold prices.
Quaid's analysis:
Although the White House has repeatedly released signals this week that relations with Beijing may ease, China said on Thursday that there are currently no ongoing negotiations with the United States on tariffs. China's strong attitude also affects the current trend of gold.
In addition, the data released by the United States today on the number of initial jobless claims in the United States for the week ending April 19 and the monthly rate of durable goods orders in March also directly guided the trend of gold.
Quaid believes that the current trend of gold is still in an upward stage; gold is still supported by many favorable factors, and the "gold bulls" may eventually break through the $3,500 mark firmly.
Quaid recommends the operation strategy:
3335 long, 3330 stop loss, and look up to 3380.
Every decisive decision is paving the way for account value-added. Every decisive decision paves the way for account appreciation. Trust your own judgment, and gold will crown you.

Technical analysis of short-term gold operationsGold rebounded to $3,339 and fell back after encountering resistance. It accelerated its decline after the opening of the U.S. market. After falling to $3,260 and stabilizing, gold began to rebound, and was still suppressed by the integer of $3,300 until the closing. Gold broke upward at the opening of Thursday, rising to $3,367, and fell back to $3,314 after encountering resistance and stabilizing. It is currently trading at $3,337. Overall, gold further retreated to $3,260 to stabilize, and rebounded to $3,367 and encountered resistance, which is basically consistent with the lower space of $3,250 and the upper space of $3,385 given by us.
Gold rebounded after hitting a new low in a week on Wednesday, mainly because Bessant said that tariff negotiations will not start soon and will be conducted at the current trade level between China and the United States. Trump did not propose unilateral reductions in tariffs on Chinese imports and denied any upcoming tax cuts, which increased uncertainty and caused some safe-haven funds to flow back into the gold market.

Gold surged and then fell back to fluctuate, pay attention to 33
The first goal of trading is survival, and the second is profit.
📌 Driving events
After experiencing the biggest drop in five months, gold prices rose on Thursday (April 24) and returned to above the 3300 mark.
After US President Trump hinted that tariffs on China might be reduced and expressed no intention to remove Federal Reserve Chairman Powell, the market's risk aversion has cooled down. Gold hit a high of $3,367 during the Asian trading session, which can be regarded as ice and fire!
📊Comment analysis
For participants in the gold market, the impact of this price plunge is self-evident. The stock prices of gold mining companies have fallen accordingly, and the production capacity that expanded in the early stage due to the rise in gold prices may face the risk of shrinking profits.
At present, gold is under obvious pressure from above, and what needs to be paid attention to now is that the current round of gold adjustments is likely to continue, which means that it is not time to buy the bottom yet!
💰Strategy Package
Except for the early morning wave, the strength of the hourly line rebound is actually somewhat weak. As for the European session, Labaron is more inclined to continue to be bearish, and the current first round of rebound pressure is around 3350! If the rebound is in place, you can continue to try short orders!
⭐️ Note: Labaron hopes that traders can properly manage their funds
- Choose the number of lots that matches your funds
- Profit is 4-7% of the fund account
- Stop loss is 1-3% of the fund account

Gold fluctuates in a wide range, and the short-term trend is upwGold fell by $240 in two trading days, but the rebound was also very fierce, from yesterday's low of 3260 to 3367 in the early trading. The current volatility is still very large. The high and low points of $100 often appear, and it is normal to fluctuate by dozens of dollars. So pay attention to the market. There is no shortage of opportunities. Just grab what you can grasp.
The daily cycle has stepped back to the MA10 position. It has entered a critical stage. If the bulls recover, the strong rhythm is still there. It is too early to say that the peak has been reached. Pay attention to follow the market and don't be stubborn. The short-term resistance is 3386 and the 618 position of the decline and rebound is 3408. It is recommended to wait and see in the European session and look at the trend. Intervene in the US session.

Gold profit taking continuesThe gold market opened at 3337.5 yesterday due to the profit-taking of the previous day. After the market fell back to 3315.6, the market rose strongly to fill the gap. The daily line reached a high of 3386.7 and then fell strongly. The daily line reached a low of 3259.6 and then the market consolidated at the end of the day. The daily line finally closed at 3287.9 and the market closed with a long upper shadow line. After this pattern ended, today's market continued to be empty. In terms of points, the short positions at 3496, 3468 and 3442 the day before were reduced and the stop loss was followed up at 3400.
SELL:3340 45 50 Stop loss: 55
TP1:3330
TP2:3320
TP3:3300

Early Asian session. Latest market analysisIn early Asian session, spot gold rebounded slightly and is currently trading around $3,345/oz, supported by bargain hunting. The U.S. session continued its trend of retreating from record highs, falling nearly 3%, hitting a low of $3,260.08/oz and closing at $3,288.18/oz.
People familiar with the matter revealed that the Trump administration is considering reducing tariffs on imports from Asian powers, adding that any action would not be unilateral.
Quaid Analysis:
People are very relieved about the possibility of negotiations between major powers, and we are seeing this trend have a significant impact on the market.
Driven by central bank buying, tariff war concerns and strong investment demand, gold prices have risen by more than 26% since the beginning of 2025. A large number of long orders are facing profit-taking needs, and investors need to beware of the risk of further correction in gold prices.
From a technical perspective, gold prices hit $3,500, soared before this level, and then reversed sharply, which increases the risk of further correction in the short term.
The preliminary monthly rate of durable goods orders in the United States in March and the number of initial jobless claims in the United States for the week ending April 19 will be released on the Asian trading day. Investors need to pay attention to them. In addition, they need to continue to pay attention to the relevant news on the international trade situation and the geopolitical situation.
Action suggestions:
Go long at 3345, stop loss at 3340, watch 33380
If Quaid's analysis can help traders, then Quaid will be very happy.

Gold continues to pull back to the turning point!!!In the 4-hour chart, the price found support near the 3284 area (the recent swing low) and rebounded. Buyers stepped in at this position and set risk below this support level in an attempt to push prices higher again. Sellers hope that the price will fall below this level to push the price further down to the 3167 area.
1-hour chart
On the 1-hour chart, a short-term downward trend line can be seen, which is currently limiting the market's bullish sentiment. Sellers may establish positions near this trend line and set stops above the trend line with a target of 3167.

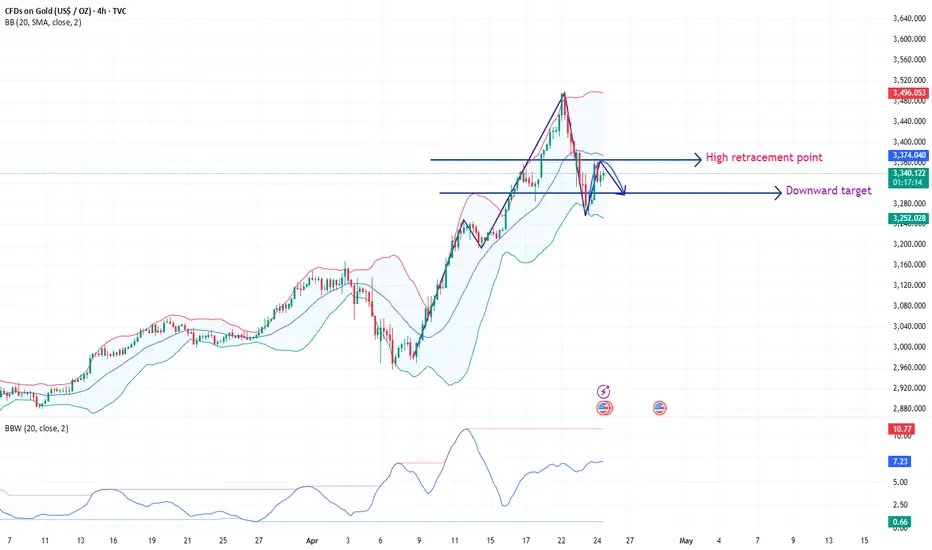
GOLD: Two Prominent Buying Areas to buy Gold From!Hey there! So, gold took a dip after hitting the $3500 mark, and it’s now at $3370. But here’s the thing, we think it might bounce back soon because it’s filled the liquidity gap. There are two possible points where it could turn around: right now or at $3330. Keep an eye on it and trade safely! Good luck!
Thanks for your support! 😊
If you want to help us out, here are a few things you can do:
- Like our ideas
- Comment on our ideas
- Share our ideas
Team Setupsfx_
❤️
