4.1 Analysis of gold intraday short-term trendFrom the daily chart, the gold price fell slightly after breaking through the previous high of $3127.76, but it is still in a strong upward channel overall. The current price has been stable above the 5-week moving average for many consecutive weeks, indicating that the medium-term trend is still healthy. It is worth noting that from the low of $2536.68 to date, gold has risen by more than 23%, and it is necessary to be vigilant about the risk of short-term adjustments. The next target will point to the psychological level of $3200. Factors supporting this view include rising global uncertainty, increased expectations of interest rate cuts by the Federal Reserve, and continued gold purchases by the central bank. In addition, the closing price needs to stabilize above $3135 to confirm the effectiveness of the long-term breakthrough. In this case, the price may accelerate upward, with a target of $3170.
Short-term resistance: 3130 3150 3170
The market is changing with the trend, and it is recommended to adjust the strategy in combination with real-time data!
Goldlongterm

4.1 Technical analysis of short-term gold trading BUYGold is currently temporarily maintaining a high range oscillation in the 4-hour level trend, but the short-term moving average continues to maintain a strong trend, and a wave of bottoming rebound in the 4-hour level trend has basically completed the repair of the technical pattern. Pay attention to the secondary pull-up trend after the high-level oscillation repair is completed. The hourly level trend is currently temporarily maintained in a high-level oscillation, but the strength and continuity of the US market's retracement are not particularly large. The technical pattern of the small-level cycle trend has also been gradually adjusted and completed, and it tends to be able to continue to rise in the late trading.
Intraday short-term operation:
BUY: 3110 Stop loss: 3005-3100 Target 3125-3130

3.31 Gold officially breaks through 3100In the early Asian session on Monday (March 31), spot gold once again saw a surge in prices shortly after the opening. The most active gold futures contract in New York was traded in one minute from 10:22 to 10:23 Beijing time on March 31, with 890 lots traded, and the total value of the trading contracts was US$279 million. Affected by Trump's latest tariff news, spot gold maintained the current bull market trend. The gold price broke through the US$3,000 mark and broke through US$3,100 only half a month after breaking through the US$3,000 mark. As of 10:39 Beijing time, it was reported at US$3,105.23 per ounce.
Gold technical analysis: Gold closed higher with a big positive line last week, and after consolidating at a high level, it increased strongly and closed at a high level. The weekly K-line is still strong, with a big bald positive line. There will be further continuation this week. However, the monthly line closed today. After the volume is released, we must also be careful of the wash of the high and fall. The daily chart has continued to rise and set a new high. The Asian session is a slow consolidation and then a slow new high. The consolidation is not the high, and the volume is the top. At present, there is further rise in the short term. Gold was stimulated by risk aversion over the weekend. It opened high and fell back on Monday. However, gold fell back under pressure at 3100 in the short term. We must pay attention to adjustments. Then gold is just adjusting. Wait patiently for it to fall back before going long. The technical side of gold shows a strong upward trend. US$3070 has become a new short-term support level. The current upward momentum is sufficient and there is momentum for further rise. The influence of gold bulls on the current trend of gold has reached the highest level in history, but the trading scale and heat have not reached the most crowded range in history. There is still room for funds to further increase positions, which provides support for gold prices.
3.31 Gold Operation Strategy Reference:
Short Order Strategy:
Strategy 1: When gold rebounds around 3100-3103, short (buy short) in batches with 20% of the position, stop loss at 3110, target around 3085-3075, and look at 3070 if it breaks; (Strategy is time-sensitive, more real-time layout strategies are announced in the channel.)
Long Order Strategy:
Strategy 2: When gold pulls back around 3070-3073, long (buy long) in batches with 20% of the position, stop loss at 3060, target around 3085-3095, and look at 3105 if it breaks; (Strategy is time-sensitive, more real-time layout strategies are announced in the channel.)

Summary of this weekThis week, the gold market continued its bull market, breaking through the historical high of 84 and closing. The gold price broke through the psychological barrier of 3,000. The market sentiment continued to be optimistic.
In this week's trading, we took the main approach of going long, holding long positions, buying back, and making significant profits, achieving the expected goals.
Next week, we will continue to make steady progress and formulate a more efficient profit plan.
If you also want to learn gold trading skills and profits in the market, then join my team.
Wish you all: Have a good weekend

Gold breaks new high again, the market waits for a pullback to gFundamentals: Gold hits a new record high today, and the market continues to hold a bullish view after the decline.
Gold is currently maintaining a relatively strong oscillating trend in the large-scale cycle trend, and the upward space in the large-scale cycle trend is likely to have not yet been completed. The daily level trend continues to maintain a relatively strong oscillating trend along the short-term moving average. The wave of decline before and after the European session has completed the repair of the technical form to a certain extent. The oscillating repair temporarily maintained at a high level in the hourly level trend currently has no particularly obvious trend. The range in the short-term trend may be compressed to the oscillating repair trend between 3060-85. Although there are some rebounds in the small-scale cycle trend, the strength and continuity are not too large. Pay attention to the short-term adjustment and repair.
Operation suggestions:
Short near 3080-7, stop loss 3085.2,
Long near 3059-60, stop loss 3053.1.
Real-time market intraday guidance.

3.28 Gold breaks new high again, holding on is the keyGold price hits a new record high of 3086, and today's low is the key
Gold price hits a new record high of 3086, which is in line with our bullish thinking of restarting strength since Tuesday
Now the price has also broken through the upper track of the green channel line. The next focus is on keeping low. Keeping low and breaking high will accelerate. Breaking the low point will easily return to sweeping
Today's low point defense position has two, the first is the early trading low of 3054, because it is a direct rise in the early trading to break the new high, and the afternoon continues to break the new high. In this case, it is particularly important to hold the early trading low ;
The second is the position along the green channel line, 3063-3061, which is also the position of the acceleration starting point
Then, next, hold the position along the green channel line, and switch upwards for at least 50-70 US dollars, corresponding to the resistance of the 3100-3115 area
The key point is to hold low, hold low and break high to see acceleration, and break the low point to turn to sweep
As shown in the figure, this wave of confirmed support began to rise, starting from breaking through the green dotted line suppression. After the breakthrough, repeatedly stepping back to confirm the 3015 upper and lower areas Support, then stand up and stabilize in the 3033-3030 area, and start an upward breakthrough
In the process, it is accompanied by a deep squat of 18-20 US dollars. After the leverage is completed, it will rise by more than 40 US dollars to break the new high
For the market that directly rose in the morning, there was a second sprint to break the high in the afternoon, so refer to 3068-3066 as support to continue to layout the bullish sprint to the 3080-3082 area
The price also accelerated the sprint and rose, and slightly exceeded the range of 3086
: Suppression line Under pressure, enter adjustment, squat 18-20 US dollars, confirm the support and continue to pull up more than 40 US dollars (what needs to be considered and verified at this moment)
For this pressure position, the focus is on the 3082-3085 area (now the excess range has reached 3086), using this as a suppression to find a space range of 18-20 US dollars, corresponding to the 3062-3060 range
The short position in the 3082 area fell to 3072-3070 as expected
Verify the conjecture step by step, time is the best verification tool!
Today is Friday, still the old rules, only provide information reminders for cooperative friends, if you need, you can find us, looking forward to the good news you have received!

GOLD 1H CHAR ROUTE MAP & TRADING PLAN FOR THE WEEKGOLD 1H Chart – 17th Feb 2025
Dear Traders,
Here’s the latest 1H chart analysis, outlining key levels and targets for this week trading plan
Gold is currently trading between two critical levels, with a gap above 2905 and below 2878. A confirmed EMA5 crossover and lock above or below these levels will indicate the next price direction. Until then, expect price fluctuations as these levels are tested repeatedly.
Keep in mind that Its president day today in the US and market will remain close today.
Our strategy remains focused on buying dips and monitoring key levels to identify potential bounce opportunities. Stay sharp!
Resistance Levels: 2905, 2920, 2942, 2949, 2972, 2994, 3011
Support Levels: Gold Turn Levels : 2878, 2852, 2837, 2817, 2802, 2776, 2747
Retracement Range: 2802 - 2817
Swing Range: 2747
GOLDTURN LEVELS ARE ACTIVATED!
EMA5 (Red Line) Analysis:
* Currently fluctuating between 2878 and 2905
* EMA5 positioning will be crucial in determining the next trading direction.
Bullish Targets:
EMA5 cross and lock Above 2910 → will open the following bullish Target 2928
EMA5 cross and lock Above 2928 → will open the following bullish Target 2949
EMA5 cross and lock Above 2949 → will open the following bullish Target 2972
EMA5 cross and lock Above 2972 → will open the following bullish Target 2994
EMA5 cross and lock Above 2994 → will open the following bullish Target 3011
Bearish Targets:
EMA5 cross and lock Below 2878 → will open the following bearish Target 2852
EMA5 cross and lock Below 2852 → will open the following bearish Target 2837
EMA5 cross and lock Below 2837 → will open the following bearish Target 2817
EMA5 cross and lock Below 2817 → will open the following bearish Target 2802 (Retracement Range)
EMA5 cross and lock Below 2802 → will open the following bearish Target 2747 (Swing Range)
Trading Plan:
* Stay bullish and buy pullbacks from key levels.
* Avoid chasing tops—focus on buying dips.
* Use smaller timeframes for entries at Goldturn levels.
* Aim for 30–40 pips per trade for optimal risk management.
* Each level can yield 20–40+ pips reversals.
Trade with confidence and discipline. Stay tuned for our daily updates! Please support us with likes, comments, and follows to keep these insights coming.
📉💰 The Quantum Trading Mastery

GOLD 4H ROUTE MAP TRADING PLAN FOR THE WEEKGOLD 4H Chart Analysis – 24th Feb 2025
Hi Everyone,
Please see our updated 4h chart levels and targets for the coming week.
Review of Previous Chart:
Entry Level: 2814 ✅
Take Profit 1: 2850.15 ✅ (Hit)
Take Profit 2: 2876.95 ✅ (Hit)
Take Profit 3: 2903.76 ✅ (Hit)
Take Profit 4: 2925.85 ✅ (Hit)
Take Profit 5: 2952.70 ✅ (Hit)
To Achieve TP6, TP7 and TP8, please consider the following scenario below. Read the caption carefully.
Key Level: 2876
Resistance Level: 2952, 2984, 3017, 3052
Support Levels (Goldturn Levels) : 2925, 2900, 2876, 2852, 2828, 2803, 2776, 2747
GOLDTURN KEY LEVELS ARE ACTIVATED at zone 2925 and below.
EMA5 Behavior (Red Line):
Current EMA5: 2935.28
FOCUS ON EMA5 REACTION DEEPLY
* EMA5 is fluctuating between two key weighted levels, with a gap above 2952 and below the 2925 GoldTurn level.
* A crossover of EMA5—either above or below the weighted level—will signal the next significant move for GOLD.
Bullish Targets
EMA5 cross and lock Above 2952, will open the following bullish target 2984
EMA5 cross and lock Above 2984, will open the following bullish target 3017
EMA5 cross and lock Above 3017, will open the following bullish target 3052
Bearish Targets
EMA5 cross and lock Below 2925: will open the following bearish target 2900
EMA5 cross and lock Below 2900: will open the following bearish target 2876
EMA5 cross and lock Below 2876: will open the following bearish target 2852
EMA5 cross and lock Below 2852: will open the following bearish target 2828
EMA5 cross and lock Below 2828: will open the following bearish target 2803 (Retracement Range)
EMA5 cross and lock Below 2803: will open the following bearish target 2747 (Swing Range)
Trading Plan:
* Stay bullish and buy pullbacks from key levels.
* Avoid chasing tops—focus on buying dips.
* Use smaller timeframes for entries at Goldturn levels.
* Aim for 30–40 pips per trade for optimal risk management.
* Each level can yield 20–40+ pips reversals.
ong-Term Outlook:
Maintain a bullish bias while using pullbacks as buying opportunities.
Buying near key support levels ensures better entry points and mitigates risks, avoiding the pitfalls of chasing tops.
Trade with confidence and discipline. Stay tuned for our daily updates! Please support us with likes, comments, and follows to keep these insights coming.
📉💰 The Quantum Trading Mastery

3.28 Gold Breaks Point, Falls Back to Support Long PositionsOn Thursday (March 27), affected by the news that US President Donald Trump announced new tariffs on imported cars, global trade tensions further escalated, market risk aversion heated up, and gold prices once again approached the record high set last week.
Fundamentals: Gold fell from its pre-US high. The decline supports the long position view.
The new US tariffs have exacerbated market tensions, and PCE data will become the next focus of attention.
The current market is active, and both long and short sides are engaged in fierce competition around key resistance levels. The dual drive of technical and fundamental factors has significantly amplified the volatility of gold prices.
The cumulative net inflow of gold ETFs in the first quarter of 2025 has reached 155 tons, and the total holdings have climbed to the peak since September 2023. In the previous trading day alone, the scale of a single-day increase of 23 tons set a record since 2022. The unexpected growth of central bank demand for gold purchases and the continued inflow of ETF funds together constitute the "two-wheel drive" for gold's medium- and long-term bullishness. If this trend continues, it will provide sufficient liquidity support for gold prices to break through historical highs.
The current price is close to the historical high, and some long profit-taking pressure is gradually accumulating. If the PCE data released on Friday is stronger than expected, or the Federal Reserve releases hawkish signals, it may become the fuse to trigger a pullback
Trend: shock upward trend
Support: around 3033.00
Resistance: around 3055.50

3.26 Technical analysis suggestions for short-term gold operatioIn the early European trading on Wednesday (March 26), spot gold continued to rebound in the short term, and the current gold price is around $3027/ounce.
Gold technical analysis, how to operate in the evening? ——
The daily chart of gold shows that gold prices are rising above all bullish moving averages, while setting higher highs and higher lows. The 20-day simple moving average (SMA) has gained upward momentum and currently provides dynamic support around 2954.70. At the same time, after correcting the extreme overbought conditions, technical indicators resumed their upward trend within the positive level. From the 4-hour line, gold prices are fighting against the mildly bearish 20-period SMA, but are still well above the bullish 100-period SMA and 200-period SMA. At the same time, technical indicators are retreating from the midline and slightly lower within the neutral level. Overall, it is recommended to treat gold operations with a wide range of fluctuations today!
Gold operation strategy at night:
Short order strategy: short near 3031 above, stop loss 3040, target near 3010;
We will update regularly every day and introduce to you how we manage active ideas and settings. Thank you for your likes, comments and attention, we are very grateful

3.25 Gold short-term operation technical analysis suggestionsOn Tuesday (March 25), the spot gold market showed a trend of consolidation under the interweaving of multiple factors.
Fundamental analysis: the game between policy expectations and risk sentiment
1. The expectation of the Fed's interest rate cut dominates the market sentiment
2. The suppression of risk aversion demand by risk events
3. Short-term disturbance of macroeconomic data
Technical analysis:
The current price fluctuates narrowly in the range of 3000-3033 US dollars. As the upper edge of the transaction concentration area in the past three months, 3000 US dollars has become a battleground for long and short positions. If the daily closing price effectively falls below this position, technical selling may push the price down to the support area of 2982-2978 US dollars, or even test 2956 US dollars (the support of the previous breakthrough position conversion). On the contrary, if the price stands at 3033 US dollars (overnight high), it is expected to challenge the historical high of 3057-3058 US dollars set last week, and a new round of upward space will be opened after the breakthrough.
Resistance: 25 30 40
Support: 18 08 3000

3.25 Gold short-term shock callbackGold's current strong trend in the large-scale cycle trend has changed. Pay attention to the support band around 2950 during the week. In the 4-hour level trend, the price rebounded and touched the previous pressure band and then began to fall back. The short-term moving average continued to diverge downward and continued to be weak in the short-term trend. The price began to slowly fall below the short-term terraced support band, tending to have a downward space in the short-term trend. The short-term trend began to show signs of stabilizing slightly after a wave of rapid declines. Pay attention to whether there will be a second downward trend after a small rebound and repair in the late trading. If it falls below 3000, look at 2990 85 below. Otherwise, look up 20-30

Gold----Sell near 3026, target 3000-2982Gold market analysis:
Last week, gold kept rising, but suddenly turned around and began to give back on Friday. The position of 3020 was broken, and it was not so strong in the short term. Is the big top of gold coming? This is the focus of traders at present. Judging from the previous pattern and moving average indicators, its adjustment has not changed the weekly trend. The weekly line closed positive last week, but there was a relatively long upper shadow line. The big top requires time and space to exchange. At present, I think there are signs of building a top, but it has not reached the top. The long-term trend is still buying, and the short-term has begun to repair. This week, we should not keep bullish and should adjust. Today, we will first look at the range decline. The rhythm of the shock must be grasped to grab big profits.
The above analysis chart of gold shows that a downward trend channel has been formed in 1H. The suppression position of the downward trend channel is around 3032. If this position is not broken, it is basically weak. The suppression position of the hourly pattern is 3026, which is also the high point of today's Asian session. Today's idea is to sell based on these two positions if it rebounds first, and pay attention to the long position around 3000.
Support is 3000 and super support is 2982, suppression is 3026 and 3032, and the strength dividing line of the market is 3017.
Operation suggestion:
Gold----Sell near 3026, target 3000-2982

Analysis of gold price trend next week!Market news:
Mainly due to the strengthening of the US dollar and investors' continued profit-taking, the US Treasury yields are rising, which put pressure on the international gold price and suffered a fierce sell-off. The London gold price once fell to around the $3,000/ounce mark during the session, and then recovered some of its losses. The geopolitical and economic uncertainties are lingering, and coupled with the expectation of the Fed's interest rate cut, the international gold price has risen for the third consecutive week. In addition, the geopolitical situation in the Middle East, which has pushed the London gold price to continue to refresh the historical high this week, may continue to help the gold price rise. Traditionally, gold is regarded as a safe investment in times of geopolitical and economic uncertainty, and usually performs strongly in a low-interest environment. This year, gold has set 16 new historical highs! Overall, the gold price has been mainly driven by geopolitical tensions in the near future. If the situation in the Middle East escalates over the weekend, and all parties are responding to Trump's tariffs in early April, and there is a possibility of renegotiation of the mining agreement in Ukraine, market uncertainty will increase, and the gold price is expected to aim at around 3,100, refreshing the historical high again.
Technical Review:
Gold fell below the support of 3025, the low point on Friday, and came to 2999. In the past few days, I have been emphasizing that gold will have a big retracement. I also arranged short orders in advance and easily took dozens of points of profit. The current decline is far from enough. Gold will continue to fall and return to normal! The 1-hour moving average of gold has begun to turn downward, and gold may open up room for decline. The 1-hour gold has now formed a head and shoulders top structure. Gold rebounds or continues to be short. The market is weak. The gold price tested the 3000 mark for the first time in the evening and has not yet broken it, but the market direction has turned short. If it does not break the first time, I believe there will be a second test in the future. Then the short-biased situation has been finalized. Long positions must be put aside first, because it is now a short market!
Next week's analysis:
Gold fell on Friday, falling below 3000 at the lowest, but then it began to rebound strongly. The gold market has begun to fluctuate, so what should gold do next week? Will gold continue to rush up or start to change at a high level? In fact, overall, if we say that gold has peaked now, it is too early, because there are still many uncertain factors to stimulate the increase of risk aversion, so it is possible to support gold to rise again. However, the impact of the news is only one aspect of our reference. After all, we cannot know a lot of information in time. We can only pay attention to the existence of this risk factor, so there is no need to be too speculative. We still start from the technical level. The 1-hour moving average of gold begins to turn downward. As long as gold does not rise strongly next week, the 1-hour moving average of gold may continue to move downward. Finally, if a downward dead cross short arrangement is formed, the downward space of gold can be truly opened. The resistance of the gold moving average has now moved down to around 3036. The high point on Friday was at the high point of the second rebound at 3037. So gold still has certain resistance in this range. Gold can be sold under the pressure of this range resistance next week, and it can be sold first when it rebounds around 3035.
Operation ideas:
Buy short-term gold at 3000-3003, stop loss at 2992, target at 3020-3030;
Sell short-term gold at 3035-3038, stop loss at 3047, target at 2990-3000;
Key points:
First support level: 3000, second support level: 2990, third support level: 2981
First resistance level: 3035, second resistance level: 3047, third resistance level: 3055

3.22 Gold Short-term Trend Analysis and SuggestionsTechnical analysis:
From the daily chart, technical indicators show signs of upward exhaustion and lose strength at extreme levels. At the same time, gold prices are holding above all bullish moving averages, with the 20-day simple moving average (SMA) providing dynamic pressure near 2941.70. From the 4-hour chart, the 100-period SMA and 200-period SMA continue to move higher, well below the above short-term moving averages. At the same time, the momentum indicator moves lower in the positive area but loses downward strength; while the relative strength index (RSI) corrects the overbought condition and then stabilizes near 61. Overall, Zhang Jinglin recommends wide fluctuations in gold operations today!
Short-term operation strategy:
SELL: Short near 3045 above, stop loss 3051, target near 3015, 3000.
We update regularly throughout the day and tell you how we manage active ideas and settings. Thank you for your likes, comments and attention, we are very grateful!

3.21 Gold peaking or rebounding?The three tracks of the 4-hour Bollinger Bands have shrunk severely, and the current range is compressed in the 3056-3012 range. As time goes by, the range will continue to shrink. The short-term support middle track and the MA30 moving average correspond to the 3034-3020 line. The 4-hour indicator macd has a high-level dead cross and runs with large volume. The dynamic indicator double lines are glued together and flat, indicating that there are signs of further decline in the 4-hour period. Pay attention to the suppression of the 3042-45 line in the short term.
The hourly macd dead cross is initially established, and the dynamic indicator sto is quickly repaired downward, indicating that the price shock is weak. At present, pay attention to the resistance of 3042-48 above.
In summary: Pay attention to the support of the 3025 line below during the day, and pay attention to the suppression of the 3057 line above. Combined with the shrinking of the 4-hour Bollinger Bands, the short-term price remains in the range of 3025-3053. The short-term resistance is at the 3042-45 line.
Resistance: $3,045; $3,079; $3,100; $3,108
Support: $3,018; $3,000; $2,974; $2,956

3.21 Gold Short-term Analysis and Operation SuggestionsGold hit a record high on Thursday (March 20) after the Federal Reserve hinted that it might cut interest rates twice this year, further enhancing the attractiveness of gold amid the current geopolitical and economic tensions. As of press time, spot gold was basically stable near $3,030, having hit a record high of $3,057.21.
——Gold Technical Analysis
From the daily chart, the volume indicator is firmly aiming higher, supporting another wave of gains, while the relative strength index (RSI) is stable near 72. At the same time, the price of gold is trading above all its moving averages, with the 20-day simple moving average (SMA) providing dynamic support near 2,936. From the 4-hour chart, technical indicators have eased from extreme levels, but are far from indicating an imminent downtrend. In addition, the 20-period SMA continues to rise steadily, currently around 3,011, while well above the longer-term moving average. Overall, Zhang Jinglin recommends rebounding and shorting as the main operation of gold today!
Gold short-term operation strategy:
SELL: 45 Stop loss 55
TP1:35
TP2:25
TP3:10

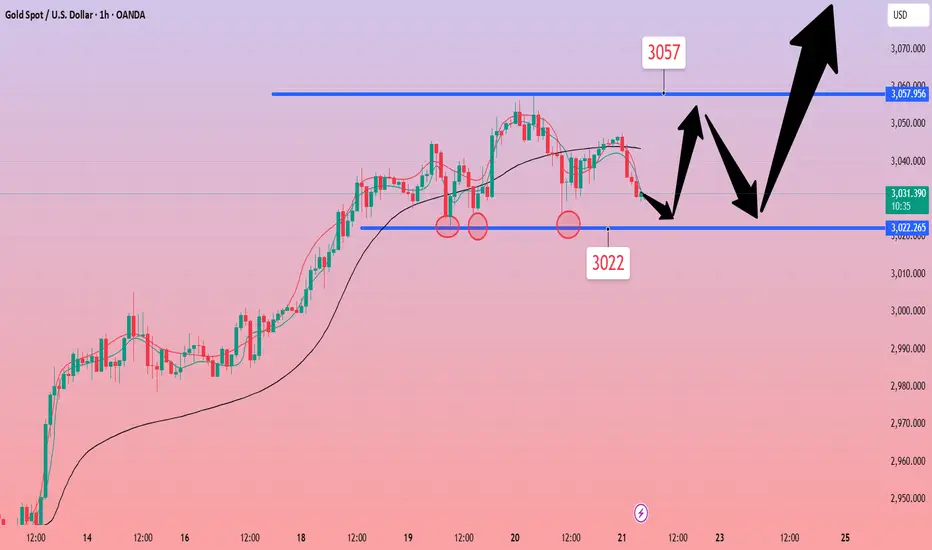
Gold------Buy around 3022, target 3060-3090Gold market analysis:
Recently, the market is dominated by bulls. The daily line has been setting new highs. However, after setting a new high of two points yesterday, the bulls did not continue. Today, we need to adjust our thinking in the short term. The bullish daily line cross star means that the short term needs to be oscillated and repaired. There is no market that has been rising all the time. Repair is inevitable. Is 3057 a big top? I can tell you very confidently that it is not. The current daily and weekly lines are both bullish. If there is no big waterfall on Black Friday today, the weekly line will still close with a big positive. Then gold will continue to hit a new high next week. The general direction of the unilateral rise can be followed.
Today, the gold bulls should not chase so aggressively, and they should adjust and wait patiently for the big position before considering it. In the Asian session, we pay attention to two position supports. One is 3020-3022, which is the recent entry direction. If this position is broken, the short-term will turn to short. Today's thinking also needs to be adjusted. After working for a week, it may be sold at the end of Friday today. The hourly support is around 3030. This position is supported by the pattern and 1-hour indicator. Buy before it is broken.
Support 3030, strong support 3020-322, pressure 3047, strong pressure 3057, the strength and weakness dividing line of the market is 3040.
Operation suggestion:
Gold------Buy around 3022, target 3060-3090
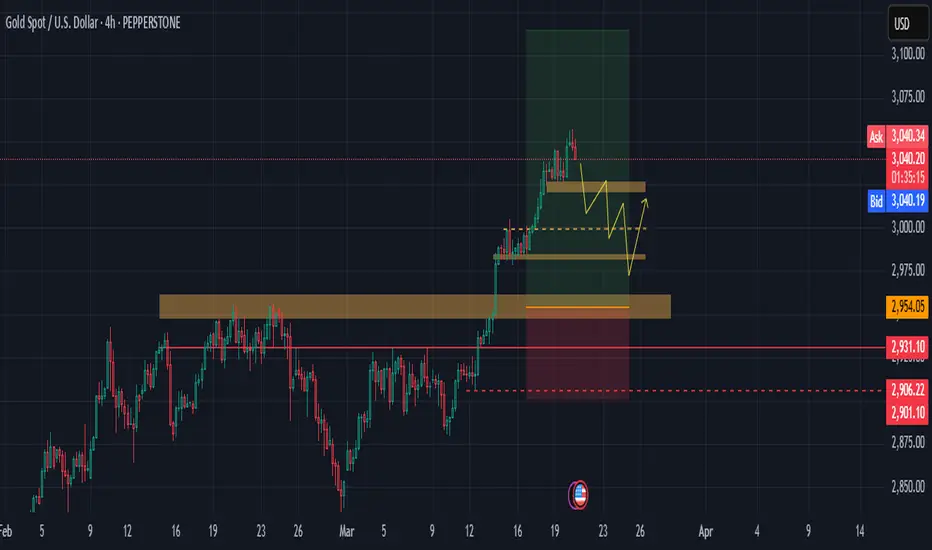
Gold Correcting ? CENARIO 1 Is it Gold correcting?
Gold prices hit record high above 3,050 USD as Fed maintains rate cut outlook by benefiting from a softer dollar as the Federal Reserve still signaled at least two more interest rate cuts this year.
And also benefiting from heightened safe haven demand due to the collapse of the Israel-Hamas ceasefire, sluggish Russia-Ukraine peace negotiations, and increased uncertainty over the U.S. economy under President Donald Trump.
3.19 Gold continues to peak, waiting for the Fed's interest rateThe gold market continued to rise strongly after opening yesterday, reaching the highest point of 3038 and then consolidating at a high level, with no obvious adjustment in the middle. Although we determined that the market would surge, it was still stronger than expected. The daily line finally closed with a big positive line with a slight shadow line. After this pattern ended, the bulls in today's market are still there.
Resistance level: 3045 3050

On 3.19, gold continued to fluctuate upward after breaking throuAs a safe-haven asset, gold has attracted more buying amid global political tensions: the escalation of the conflict in the Middle East and the continued strikes by the United States against the Houthi armed forces in the Red Sea region may affect the energy supply chain. The uncertainty of the ceasefire negotiations between Russia and Ukraine has led to a high risk aversion in the market. The increase in domestic political risks in the United States may affect market confidence and push up gold demand.
The rise in gold on March 18 is in line with my thinking. Obviously, the US market was suppressed at 3028. After a short-term retracement, it further broke upward. It is expected to continue the upward trend at night and see the suppression of 3044.
The weekly and monthly lines are concerned about the upper track position, and even diverge upward under the impetus of market sentiment. The specific position cannot be determined because there is no reference point, but it is only necessary to follow the market trend to do it, and the transaction is relatively simple. From a technical perspective, the upper track of the weekly line is 3030, and the upper track of the monthly line is 3050. This is the position that needs attention. In addition, the previous two waves of rises have gone through 4 positive monthly K lines, and then closed with a negative correction.
Support level
$2994; $2982; $2950
Resistance level
$3025; $3050; $3080

3.18 Risk aversion and expectations of rate cuts support gold toIntraday data analysis:
Gold hit a new record high and maintained an upward trend. For the support below, pay attention to the upper rail of the 4-hour Bollinger band at $3010, followed by the integer position of $3000, which is also near the high point of gold prices on Monday; for the pressure above, pay attention to the upper rail of the weekly Bollinger band at $3028, which is also the upper rail position of the current 4-hour Bollinger band. If the gold price continues to break upward, the upper space can pay attention to the upper rail of the monthly Bollinger band at $2950. The 5-day moving average and the MACD indicator cross upward, and the KDJ and RSI indicators cross upward. The short-term technical side is bullish.
Gold intraday reference: Supported by risk aversion expectations and interest rate cut expectations, gold maintains an upward trend and gold prices hit a new record high. In terms of operation, it is recommended to treat it with a volatile mindset. Pay attention to the support below at $3010, followed by $3000. Pay attention to the breakthrough near $3028 for the pressure above. If it stands firm here, you can continue to pay attention to $3050.

3.18 Gold Refreshes $3,000, Be Cautious About Backtesting RisksIn 4 hours, the main trend is continuous rising and breaking rising; the main trend is anti-falling; in terms of indicators, the stochastic indicator crosses downward, mainly empty, but the pattern is anti-falling. At the same time, the MACD double lines are glued together, without crosses. Therefore, the cross of the stochastic indicator is just a correction method for 4 hours to change time for space; the horizontal support position is at the support position of 2980 and 2955.
Short-term operation: SELL: 3000
TP1: 2990
TP2: 2980
TP3: 2970
As usual, we will update regularly throughout the day and tell you how we manage active ideas and settings. Thank you for your likes, comments and attention, we are very grateful!
