Goldman

GOLDMAN SACHS - SELL ideaWe see a sell here but need to manage the position with a tight stop loss just over the resistance level (elections usually cause the prices to rise).
Fundamentally, these are not happy times for banks.

Not too late to sell GSThe word is out Buffet liquidated his GS position which is not particularly 'bad' for GS.
Buffet injected $5bln into a weakened GS in 2008 with some significant conditions...
one of which GS execs could not sell stock against Buffet's position :) :) :).
That said, GS is still a decent short with initial potential down to about $192.

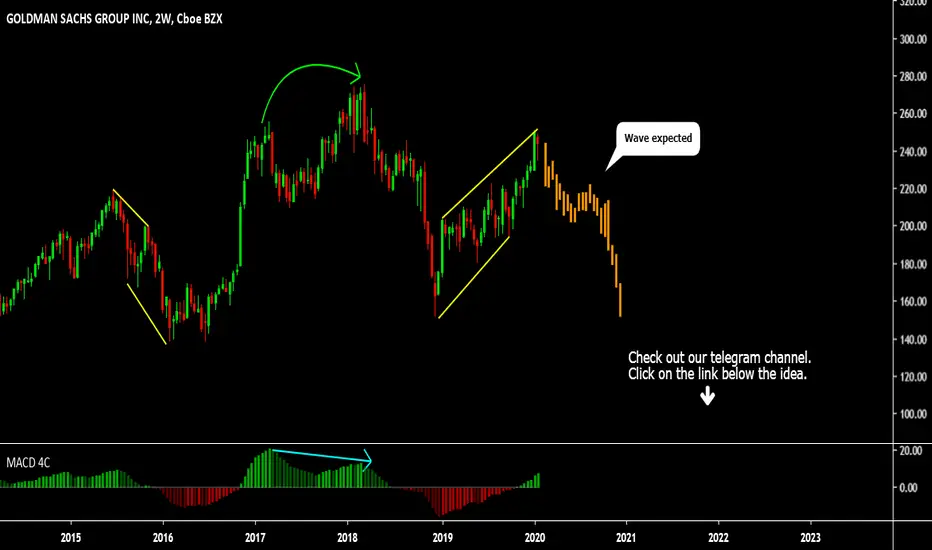
GS Goldman - Where is it heading?We are at ascending channel but key support area we break down further out of the bullish moment - we will have the bears come out...!
Now, I was very bullish on banks overall - even when they had there earnings. For this moment time technical aspects lets concentrate - if we go further below our next support area would be: 193 - 188 areas & Resistance areas would be: 219-225 areas.
Go through lower time frames once direction is confirmed, you could even add alerts to your charts or if you're feeling very confident add orders in.
Enjoy - have a great weekend.

GOLDMAN SACHS - Sell Opportunity - Target Remains @ $190Today we managed to break and hold below the 200 MA on the daily time-frame.
Target remains at $190

Goldman Sachs ScenariosToday marks the announcement of Goldman Sachs earnings. Some scenarios I could see happening

so good for buying now Goldman It is expected that in the last hour of the market today, buying this share will be good considering the previous conditions.
The market is also expected to have a surprise jump on the weekend.

BTCUSD ShortIf you can look at my horrible chart, you can just about see that a double top is forming.
Now you may be like well done you know how to identify what my 11 year old kid can do, but lets look outside of the box. Wall street is yet to open as new york is 5 am, and chicago is 4am, so some of the biggest players are still fast asleep dreaming about something.
Now if you have read the news, apparently Goldman Sachs believe that bitcoin is 'not an asset class', thus you would think that with the opening of the market we will see a sell of bitcoin.
Furthermore, we can see support has been broken, and that another dump pattern is starting to form.
Remember black thursday number one? Well, talking in the chat that is just about to be exactly 10 weeks, so who knows, maybe black thursday two is here; if only we had sales like black friday though....
P.S: Pls do not use this to invest your money, I am just laying the facts. Things can change real quick as many belive BTCUSD to shoot up, so just read more, and try to get to grips with this market.

GS SELL (GOLDMAN SACHS GROUP INC)Hi there. Price is forming a continuation pattern to the downside. Watch strong price action at the current price for sell.
GS Goldman Sachs: $245 artificially undervalued towards $1,000new markets new customers when the rich becomes richer and the rise of middle class require more banking needs
Goldman shall dominate this space in the next decade.
That liquidity from the FED and make America great again shall benefit strong hands
Price action wise it's a Parabolic to fresh highs
--
LOADED for the long run
warren may just mark this up to $300 to make a statement
REMINDER: this listed most issues and as underwriter packager
it knows how to surprise the PUBLIC

GS Long-Term Uptrend; End of 2019 Price Target: $200Goldman Sachs has been harried by the 1MDB scandal as of late. Look for the company's robust business to shake off the short-term concerns over 2019 and regain the old highs. The first green trend line gives us an idea of what the trend COULD have been for GS. The second green line delivers a more accurate picture of what the trading behavior will resemble in the long-run. Right now: be wary of this stock as it could reach 145-150 levels before the stock regains its momentum. After that, it should be clear skies ahead!

July 31,3 entry points. 1. Objective. Goldman Sachs
the interest rate decision will affect the banking sector downward, we expect strong falls and we will develop a bearish inverted priramide strategy.

BTC: $11,000 the road to $18kthe handler loves to CHURN and shake the weak both long and shorts get hammered
most especially with high leverage at 50s and 100s
for the 5x to 3x folks.. just Positon size as series of happenings and conversions are penting up demand

Goldman Sachs Group Inc potential reversal!Goldman Sachs Group Inc expected to rise up to 1st resistance at 211.72 where it could potentially react off and drop down to 1st support at 183.19.
Trading CFDs on margin carries high risk.
Losses can exceed the initial investment so please ensure you fully
understand the risks.

Goldman Sachs (GS) Cleared a LevelTheory is that each box jump/drop requires the same amount of time, and thus GS looks poised to spend some time bouncing between 205 and 220. Idea negated if 205 zone is lost.
Target: 220

Goldman Sachs Update - Buy Buy Buy!I've added the ichokucloud fibonacci to this chart. Looks like my previous analysis was correct, broke out from the base established over the past 2 months. Earnings Monday morning should make this pop along the new trend line.
NYSE:GS NYSE:GS

Bitcoin is growing, the ruble is falling, May gave upTuesday, compared with Monday, turned out to be much calmer in most financial markets. With the exception of the cryptocurrency market. There was a strong surge of optimism, resulting in a sharp increase in Bitcoin. For some time, the cryptocurrency was even quoted above 5,000, which was not the case since November 2018. The growth rate of Bitcoin reached 23% yesterday.
What about the reasons for growth, analysts shrug. There were no special reasons for this. It just looks like a planned attack, which, in view of the relatively low liquidity and market volume, was crowned with success. Some traders, however, suggest that such a rapid growth of cryptocurrency was associated with an April Fool's joke, according to which the US Securities and Exchange Commission (SEC) allowed Bitcoin ETF trading.
We do not recommend encouraging about this and rushing to buy cryptocurrency, because the lack of a proper fundamental base under growth signals in favor of a quick “return”. So we consider yesterday's growth of Bitcoin as a good opportunity for more expensive sales and quick earnings.
Brexit. May gave up and acknowledged that there is no point insisting on the current version of the contract. In the end, she said she wants to develop a new approach to Brexit, together with the leader of the Labor Party, Jeremy Corbyn. Apparently, Theresa May’s new plan will be some combination of her exit agreement and a variant of the customs union, advocated by Corbyn. Recall that the alternative to this is the extension of the Brexit's terms for a long time.
Analysts of the Goldman Sachs Group meanwhile predict a quick resolution of the problems and predict a pound growth. In their opinion, buying pounds can be the most profitable trade among all possible options for trading with currencies of developed countries. Note that we recommend buying the pound for quite some time and we do not plan to change our recommendation.
The ruble continues to be under pressure. The threat of new sanctions does not allow buyers to relax, and the attractiveness of the ruble from the position of "carry-trade" has recently dropped sharply. The reason is the same - an increase in the risk component in the form of new sanctions has sharply reduced the “attractiveness” of the “carry trade” with the ruble. It is much easier in this regard to work with Indian rupee, Mexican peso or Turkish lira.
From yesterday's macroeconomic statistics, it is worth noting perhaps the weak data on goods for durable orders in the United States (down 1.6%).
About the oil markets. OPEC reduced oil production by another 295K b / d in March, and the Iranian Minister of Petroleum Industry announced that OPEC + could be extended without any problems in June. Recall, we recommend buying oil on the intraday basis.

Goldman Sachs | Outlook & Earnings bearishLooking at Goldman Sachs chart.
The SQZ indicator continues to turn hard green. Indicating further down side.
The stock has been ascending on descending volume. Bearish sentiment.
The MacD is about to have a bearish crossover.
The chart follows the bearish sentiment that is seen across the market.

GS Broke Out Of Major Support, Potential Drop!GS broke out of its major support turned resistance at 171.75 where it could potentially drop further to its support at 137.33 (horizontal swing low support).
Ichimoku cloud is also showing signs of downward pressure which contributes to our bearish bias.


Goldman Sachs Testing Support, Potential Bounce!Goldman Sachs is testing support at 190.47 (100% Fibonacci extension, 61.8% Fibonacci retracement, horizontal swing low support) where it could potentially rise to its resistance at 230.72 (50% Fibonacci retracement, horizontal swing high resistance).
Stochastic (89, 5, 3) is testing support at 3.5% where a corresponding bounce could occur.

WTI Crude oil | 1D Bullish channel | Long supportOil is getting geared up to go with the volatile markets
$68 key psychological level
Break past $70
T1: $83
T2: $88
R/r =3/1
Stop loss 62$
__________________
A bull's case for oil by Goldman Sachs

Goldman Sachs respecting support line longThe chart says it all really, another bounce off our key support line.. we are long on this position
TP and SL are reserved for our clients.
