advances to near $2,055 as US yields declineHere is what you need to know on Monday, January 15:
• Gold price gains ground on risk-averse sentiment due to the Red Sea situation.
Israel-Gaza conflict intensified after Houthi attacked a US Navy vessel.
• US Treasury yields contribute to downward pressure on the US Dollar.
Barclays revision of the Fed rate cut has changed market sentiment.
Gold prices continue to advance for the third consecutive day on Monday, trading higher and reaching around $2,055 per troy ounce during the Asian session. The upward movement in the price of the yellow metal is attributed to the risk-averse due to the geopolitical tensions in the Middle East, coupled with the speculation regarding potential rate cuts by the Federal Reserve (Fed) in March.
The concerns over the escalation of the Israel-Gaza conflict have intensified, especially after Iran-led Houthis fired an anti-ship cruise missile at the USS Laboon in the Red Sea on Monday. This development has contributed to increased demand for gold prices, a traditional safe-haven asset during times of heightened geopolitical uncertainty. Market participants remain vigilant for potential impacts on shipments in the Strait of Hormuz while closely monitoring Iran's response to recent geopolitical developments.
The US Dollar (USD) hovers around 102.40 with a negative bias, influenced by the decline in US Treasury yields, possibly triggered by the softer Producer Price Index (PPI) data from the United States (US). The DXY has trimmed its intraday gains as a result of the drop in US Treasury yields. The 2-year and 10-year yields on US bond coupons trade lower at 4.14% and 3.94%, respectively, at the moment.
Additionally, Barclays revised its forecast on Friday for the first Federal Reserve rate cut, moving it to March from June. This change in outlook has shifted market sentiment towards expectations of an easing monetary policy by the Fed, putting downward pressure on the Greenback. In a note released on Friday, analysts from Barclays expressed their expectation for the Federal Open Market Committee (FOMC) to reduce the Fed Funds rate by 25 basis points at the March meeting.
Goldmansachs

Wednesday: Gold focuses on the 2020~2040 rangeGold is still dominated by short sellers, with the daily chart closing in the positive zone, the MA10/7 daily moving average suppressing the MA2038/47 opening downward, and the central axis of the RSI indicator adjusted. The short-period hourly chart and the four-hour moving average are glued together, and the price is running in the middle and lower rails of the Bollinger Bands. Technically, gold continues to adjust and fluctuate and runs bearish. However, market data gradually emerges in the second half of the week and needs to be focused on. We will continue to pay attention to the 2040/2020 range adjustment during today's trading day. Trading ideas still look at shocks and short-term participation!
To be honest, the shock yesterday was really severe. If you are not calm, you may run away early and miss the drop of more than ten dollars. Only persistence is victory. No matter how the gold price fluctuated, it failed to rise above the suppression of the 4-hour 20 moving average. Today, we continue to short gold relying on moving average suppression.
Trading straregy:
Short-term gold 2017-2019 long
Short-term gold 2038-2040 short
XAUUSD: 10/1 Today’s Market Analysis and StrategyGold technical chart daily pressure 2040-2053, lower support 2000
The four-hour pressure is 2040, and the lower support is 2016
One-hour pressure is 2040, support below is 2016
✅Operational suggestions: Gold has now physically broken through the 2040 mark. Today’s rebound near 2040 will be the main target for shorting, first look at the 2020 mark. If the strength is strong, continue to look at the 2000-1966 mark. The first small resistance above is currently the 2031 mark, followed by the 2040 mark. It is the entry price of short order
SELL:near 2053
SELL:near 2040
SELL:near 2032
You don’t necessarily trade according to the points I mentioned, technical analysis only provides trading direction!

XAUUSD:8/1 gold market analysisGold technical chart daily pressure is 2053, with support below 2040-2000
Four-hour pressure 2053-2063, support below 2000
One-hour pressure 2044-2053, support below 2024
Operational suggestions: Gold NFP first fell and then rose on Friday. After breaking through the 2030 line, it began a substantial counterattack, and after touching the early decline point near 2063, it began to fall back. There was a large-scale sweep of long and short markets. Today, we will continue to pay attention to the 2040 dividing line at the hourly level. The price will continue to go long above the long-short dividing line and go short below!https://www.tradingview.com/x/a2OrCW1c/
You don’t necessarily trade according to the points I mentioned, technical analysis only provides trading direction!

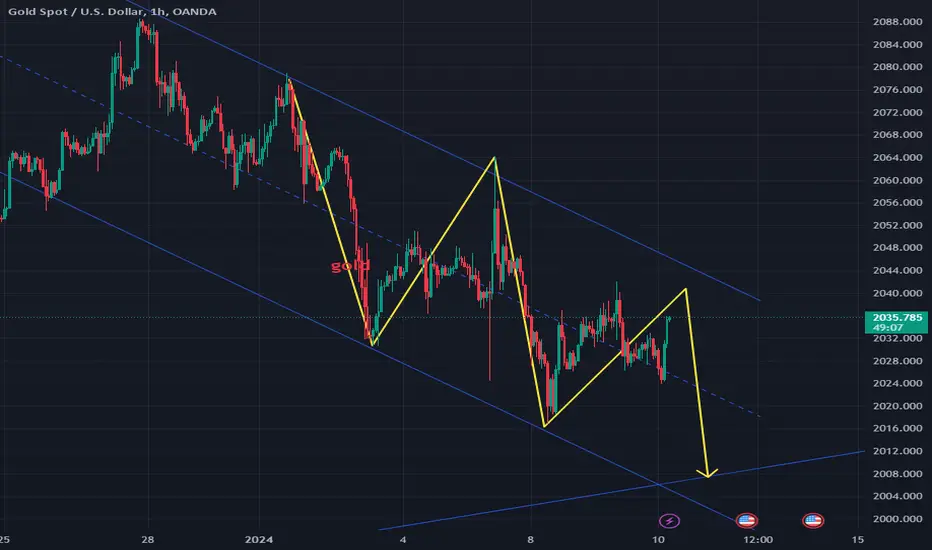
📉⏰ Gold's Major Drop Tomorrow: Get Ready for the Tumble! 💥🚨👀Gold closed today at 2065.265 (-0.57%). We had anticipated this move a few hours before it happened, and we have been calling for this move since the beginning of the week. However, despite our predictions, many bullish investors and those with diamond hands are still not convinced that the bull trend has reversed and that we are now officially in a bear market.
Tomorrow's drop in gold price will be huge compared to what we have witnessed today. And if it does not happen tomorrow, we expect it to happen the next trading day after January 01, 2024.
Why? The hourly charts are in a dangerous spot
Enough of the talking! Let's look at the charts now, because prices and charts are trustworthy. The gold 1-hour chart indicates that the trend has shifted to the bearish side.
Let's look at the gold miners -
NUGT (GOLD MINERS BULL INDEX X2) 3 DAILY CHARTS: We can see that there is double top formation on the RSI.
GDX 3 DAILY CHART: We can see a double top formation on the RSI as well.
XAUUSD 3 DAILY CHART: We can see a double top formation on the RSI as well.
Based on the 3 daily charts, the first target is $1982.

XAUUSD: 27/12 Today’s Market Analysis and SuggestionsGold technical chart daily pressure is 2066-2072, with support below 2040
Four-hour pressure is 2066, support below is 2044
One-hour pressure 2066-2072, support below 2055
Operational advice: The advice given yesterday was absolutely correct. The gold price reached its lowest level near 2054 and then fluctuated upwards. It continued to test the 2066 mark. It is currently consolidating at the 2066 mark and waiting for the next attack! Look towards the vicinity of 2072-2080 and then look at the 2100 mark
BUY:near 2055
You don’t necessarily trade according to the points I mentioned, technical analysis only provides trading direction!

Analysis and plans for gold after the market opens tomorrowSpot gold's rebound continued last week as the Fed's favored core personal consumption expenditures (PCE) price index for November came in lower than expected.
Gold prices briefly tested above $2,070 on Friday before falling back to the day's opening price. Last week, gold prices hit a maximum of $2,070.67 per ounce and a minimum of $2,015.99 per ounce.
The 4-hour K-line encountered resistance and suppressed the early highs, and the overall trend was still downward. Although gold rebounded to a certain extent yesterday, without breaking through 2070, I personally do not expect the continuity to be strong. To put it simply, shorting will be the main focus next week on rallies. The first resistance above is near 2058. If the counterattack does not break this position, you can go short.

XAUUSD:22/12 market analysis and suggestionsGold technical chart daily pressure is 2066-2072, with support below 2040
Four-hour pressure is 2066, support below is 2040
One-hour pressure is 2066, support below is 2040
Operational advice: Today is the last trading day of Christmas, and the market will be closed for the next three days. Please trade with caution and finish your positions before the market closes!
BUY:near 2040
SELL:near 2066

XAUUSD: Friday market analysis and suggestionsAfter gold surged today, it did not break through the previous high of 2047. Then the market on Friday will have two trends:
The trend of the first chart according to me found support below the channel, and then began to rebound and hit new highs.
Second, if it can fall below 2027 on Friday, the top of the callback in 2047 will be confirmed, and it will be difficult for Gold 2015 to support it. There will be a waterfall tomorrow.
According to the current trend, the first trend is more likely to occur.
remind:
Friday is the last trading day before Christmas, and the market will be closed for three consecutive days.
Trade cautiously on Friday and be sure not to leave your positions open until next week
The market opening next Tuesday is likely to be a gap-like opening
If you want to know more details about the gold trend, you can contact me at any time↓

XAUUSD: 22/12 Asian Market AnalysisNow that gold has broken through a new high, a new band of rise has begun! Next hit the 2060 pressure!
From the hourly chart, gold has an obvious upward trend. This week's shock is a normal adjustment in the upward process. The adjustment is to accumulate strength for another rise. The end of the adjustment means that a new band of rise has begun! The new band target is at least the 2060 line, or even a record high!
Gold is still going long now, and you can enter the market directly near the Asian plate 2045! The adjusted rise generally does not give too many opportunities to get on board. If there is a small correction, just BUY!

Gold price edges lower amid modest USD uptickGold price (XAU/USD) struggles to capitalize on the previous day's positive move and trades with a mild negative bias heading into the European session on Tuesday. A slew of influential Federal Reserve (Fed) officials recently tried to push back against market bets for early interest rate cuts in 2024. This, along with the post-Bank of Japan (BoJ) selling around the Japanese Yen (JPY), lends some support to the US Dollar (USD) and exerts some pressure on the non-yielding yellow metal.
Apart from this, the prevailing risk-on sentiment across the global equity markets is seen as another factor undermining the safe-haven Gold price. That said, geopolitics remains the biggest risk for the markets. Furthermore, worries about a deeper global economic downturn, particularly in China and the Eurozone, might continue to act as a tailwind for the XAU/USD. Traders might also refrain from placing aggressive bets ahead of a key US inflation reading, due on Friday.

XAUUSD: 14/12 Today’s Analysis and RecommendationsGold technical chart daily line, upper pressure 2040-2072 and lower support 1983
Four hours, the upper pressure is 2042 and the lower support is 2000
One hour, the upper pressure is 2042-2066 and the lower support is 2021-2000
✅Operational suggestions:
Yesterday, gold rose strongly and broke through the 2000 mark. The 2010 level above also briefly fluctuated and then broke.
I have said before that the 2000 mark is the watershed between bulls and bears, so above the 2000 mark we turn long and look towards 2060-2100, and maintain the low-long thinking during the day. Above, 2042 and 2066 are also effective suppressions.
BUY: Near 2021, target 2040-2060
SELL: Near 2042, target 2030-2020
SELL: Near 2066, target 2040-2030
You don’t necessarily trade according to the points I mentioned, technical analysis only provides trading direction!

Market Guide Latest Trading Plan
in the last buy order. Traders who followed made big profits. This is cause for celebration.
The gold market currently remains at the 2043-2044 level. Prior to this our buy order was closed at this location. The profits are very considerable. At present, the pressure from above still exists. There is no dominant news today, so at this position, I think we can mainly sell gold in the short term.
2043-2047sell
tp:2033
sl:2053
For newbies. It is often more reasonable to follow a good trading signal than to trade randomly on your own.
If you are still new. Or being unable to close the deal on your own. You can refer to my trading ideas. Hope it helps you.

The time to buy gold has arrived. Follow the market guide
For newbies. It is often more reasonable to follow a good trading signal than to trade randomly on your own.
The last order has been taken profit. At present, gold has reached near our buying point after falling. I said before that the short term focus is on selling high and buying low. But now that gold has fallen back, it gives you a buying opportunity. You can buy directly in 2033-2034. If it falls back, you can continue to add buy orders.Target 2040
If you are new to this. You can't complete the transaction on your own yet. You can refer to my trading ideas. hope it helps you.

#GOLD #GoldUpdate
Following yesterday's FOMC news, we witnessed a remarkable surge in gold, signaling a potential ongoing upward trajectory. The specific timeline for this rise remains uncertain.
Our analysis involves a simultaneous examination of gold on the chart. According to our assessment, gold has exhibited an impulse and could sustain its ascent through the (1.2.3.4.5) waves.
We've identified what appears to be a bullish flag at the conclusion of wave 3. However, exercise caution in your trades, as gold may surge further before undergoing a correction in the form of (ABC) or possibly correcting at this juncture.
Feel free to trade with us and access our concurrent analysis in our VIP group, offered at no cost.

gold updateGold Update:
We've conducted an analysis of gold for the upcoming trading week, anticipating a minor correction before its continued decline to $1978. The short zone is expected from 2012-2014$.
Stay connected with us for a trading week filled with potential profits, and remember, it's all completely free.

🐬 New trend of GOLDEllie wants to send you some small analysis, hope you will like it. Thanks for reading ♥
If we get to the beginning of Europe, PLAN EUROPE, Gold may react at the resistance zone 1,995 - 97, but if we can maintain the zone 1,990 - 92 to 1,987 - 85, the opportunity to Buy still remains with the same targets. Only if during the middle of the European session Gold cannot surpass the 2,000 - 02 range, then we will sell earlier with a target price of 5 - 7.
The price is 1,991.30
Please trade carefully, don't turn it into a game but turn it into an investment opportunity ♥♥♥

Xauusd:Will it rebound again?
Yesterday, Federal Reserve Chairman Powell spoke publicly again, saying that Fed officials are not sure that interest rates are high enough to end the inflation war, and that the help they can get in expecting improved supplies of goods, services, and labor to reduce price pressures may be nearing the end.
After Powell's speech, traders postponed their bets on the timing of the Fed's first interest rate cut from May to June next year.This has also boosted the trend of the US dollar and US bonds
Hawkish voices continue to appear within the Fed. Richmond Fed Chairman Balkin said that although “real progress” has been made on inflation, it is not yet clear whether the Fed needs to continue to raise policy interest rates to complete its work. He is not as optimistic about the rate of inflation decline as some others.
O'neal Pace, acting president of the St. Louis Fed, said he did not want to rule out the possibility of further interest rate increases if necessary.
(These all suggest the possibility of continued interest rate increases in the future)
Yesterday, gold was the same as I predicted. The data on unemployment benefits did not make gold fall below 1944, so it began to rebound, reaching a peak of 1965.
On the 1H chart, the downtrend line has been broken. Pay attention to the support situation after today's decline. If it does not fall below 1950, you can continue to watch the rebound continue.
We need to pay attention to the upper resistance point range:
1968-1972
1975-1980
Pay attention to the range of support points below:
1950-1953
1941-1945
1933-1938
So you can choose to buy around 1945-1952, observe the strength of the rebound, strictly set the stop loss, and gradually buy according to the funds, so that your success rate will be greatly increased
If you don't know how to trade, join me and let us learn together to improve the success rate

XAUUSD:10/11 Today’s Trading StrategyOn Friday, gold in the Asian market was operating in the 1955-1960 range. Spot gold ended three consecutive days of decline, getting rid of the lowest point in nearly three weeks, and once exceeded 1960. From the perspective of technical analysis, the daily head-and-shoulders top pattern has been partially formed, and the right shoulder's 2004 decline has now reached $50. This decline may have room for correction in today's trading. At present, after three consecutive trading days of decline, the market has rebounded, but the pressure point is located near the 1970 middle track of the daily cycle Bollinger Bands. Therefore, the key resistance level for today’s intraday rebound is near 1970. If it can hold above 1970, the market may continue to rise.
Gold stabilized at a low level yesterday and rose, forming a double bottom at 1944. Gold's US market combined with data pushed it higher. The highest point was resistance at 1965.4, and finally closed at 1958.33. The daily line ends with a small positive line with an upper shadow line. After the continuous decline, the gold price closed the positive line for the first time. This does not yet represent a reversal of the trend. The short trend temporarily paused and changed from a straight decline to a shock range. At the four-hour level, the Bollinger Bands show signs of narrowing. The dividing line between long and short is at 1979. After breaking through this level, the price of gold will strengthen again. Otherwise, it will continue to maintain a short retracement. The support below will focus on 1953, and if it breaks, look at 1944.
SELL:1968-1970
SL:1975
TP1:1962
TP2:1955
BUY:1947-1950
SL:1944
TP1:1957
TP2:1963

xau/usdGold has reached the buying zone we forecasted a month ago. Stay connected with us for real-time market updates. Our dedicated team of traders is committed to providing you with top trading opportunities, and it's all at no cost to you.

XAUUSD:8/11 Today’s Trading StrategyLooking at the 4-hour chart, the Bollinger Bands are opening downward, and gold has encountered resistance and fallen since last Friday's high of 2004. There is only a single positive line on the K line, which is structurally very weak. Yesterday, the US market closed with a positive line in the 4-hour period. Seen as a correction, a single positive cannot change the trend. In addition, the continuous decline has made the indicator seriously oversold. The stochastic strength indicator RSI has reached the bottom with signs of turning. The short-term rebound correction is also reasonable. The rebound is for fell.
In the short term, gold is currently in a downward trend and has turned from a very weak form to a concussive trend. The price has temporarily formed a double bottom support rebound near 1953. It is expected that there will be a second bottom move after the rebound correction. If the second bottom does not reach a new low, this wave of decline will come to an end. At that time, go long on dips. If it breaks below 1953, it will start a new round of decline. Today, we will continue to pay attention to the support situation in this area. If gold continues to weakly break below the support, then the price below Looking further towards the vicinity of 1940. The top short-term focus is on the resistance near 1975/1978. This is near the low point of the previous high point shock. It is currently running downwards and pay attention to the top-bottom transition. If it continues to strengthen, focus on the vicinity of 1986, which is the golden section of 0.618 where gold fell by 1956 since 2004. But if gold rebounds too strongly, then you need to be careful that the market may fluctuate at a high level. In terms of gold operation ideas, it is recommended to focus on short selling on rebounds.
BUY:1955-1957
SL:1950
TP1:1965
TP2:1970
SELL:1970-1973
SL:1978
TP1:1965
TP2:1960

waiting for a signal from the FedThe main stock indexes on Wall Street continued to extend their climbing streak, while US 10-year Treasury yields also increased as investors braced for speeches by at least nine officials. Federal Reserve (Fed) officials this week, including Fed Chairman Jerome Powell on November 9.
According to CME FedWatch, traders are discounting a 90% chance that the Fed will leave interest rates unchanged at its December meeting.

Important developments of GOLD🔴Gold price assessment
📌Gold rose sharply on Friday as the war situation in the Middle East continued to heat up. Israel expanded its bombing of the Gaza Strip, causing local Internet and phone services in Gaza to be cut off. Gold prices increased to the same level as in 2010, the highest level recorded in the past 5 months.
💢The war has greatly affected the price of gold. Everyone should carefully place SL TP when trading.💢
