Goldman Sachs Group Analyze 🦀!!!Goldman Sachs Group succeeded in making a Bearish 🦀Crab🦀 Harmoni Pattern near the resistance line.
I expect that Goldman Sachs Group will lose at least 15% of its value.
The 🎯target🎯of this downtrend can continue at least to the trend line.
Goldman Sachs Group Analyze (GSUSD), Timeframe 1H⏰(Log scale).
Do not forget to put Stop loss for your positions (For every position that you want to open).
Please follow your strategy, this is just my Idea, and I will be glad to see your ideas in this post.
Please do not forget the ✅' like '✅ button 🙏😊 & Share it with your friends; thanks, and Trade safe.
Goldmansachs

9/18/22 GSGoldman Sachs Group, Inc. ( NYSE:GS )
Sector: Finance (Investment Banks/Brokers)
Market Capitalization: $112.036B
Current Price: $326.21
Breakout Price: $335.15
Buy Zone (Top/Bottom Range): $325.35-$306.65
Price Target: $361.40-$363.50
Estimated Duration to Target: 60-63d
Contract of Interest: $GS 11/18/22 330c
Trade price as of publish date: $15.45/contract

Goldman Sachs Playing The Weekly Bullish Reversal PatternIn this update we review the recent price action in Goldman Sachs and identify the next high probability trading pattern and price objectives to target

It's the energy, babyINVESTMENT CONTEXT
Inflation in the UK reached 9.1% in May, up a tad from 9.0% reading in April
IEA warned the EU to brace for a potential full cut of energy supply from Russia, with outsized repercussions on the bloc's GDP
Germany’s finance minister called the EU ban on sales of combustion engines cars by 2035 a “wrong decision”
Goldman Sachs upped its latest forecast for probability of a recession over the next two years from 35% to 48%; ARK's CEO Cathie Wood identified in the Fed's excessively tightening monetary policy a cause that could plunge the economy into recession
On June 21, ProShares launched its Short Bitcoin Strategy ETF (BITI), the first inverse exchange-traded fund linked to BTC, which allows investors to bet against the world's largest cryptocurrency by market cap
Crypto exchange FTX extended a USD 250mln credit line to crypto lender BlockFi, shortly after bailing out crypto broker Voyager Digital with a USD 485mln loan
PROFZERO'S TAKE
All Profs timely highlighted the criticality of energy driving the next steps of the ECB monetary policy - other than hopefully accelerating replies from the industrial side, in an effort to ensure greater security and diversification of supply to the continent. Now those warnings are coming to the fore. The Central Bank of Spain estimates a full halt of energy supplies from Russia would plunge EU GDP by between 2.5% and 4.2%; Goldman Sachs locates the crunch at 2.2%, with sizable impacts in Germany (-3.4%) and Italy (-2.6%). Risk management predicates the "build back better" doctrine - when a major crisis strikes, opportunities arise for decision makers to rebuild infrastructures, making them more resilient. Profs really hope this time the EU won't turn a blind eye to the opportunity of pursuing for once a coordinated, integrated, energy strategy
The escalating narrative between U.S. President Biden and the energy sector majors regarding lifting energy output is starting to look paradoxical to ProfZero. According to EIA, U.S. crude oil production was 17.44mboe/d in Q2 2020, at the trough of the pandemic (on April 20, 2020, WTI futures closed on negative territory at USD 37.65/boe below zero); it took 5 quarters for the industry to add 1.5mboe/d, setting production at 18.94mboe/d in Q3 2021, and yet 3 more quarters to add another 1mboe/d (output in Q2 2022 is estimated at 19.94mboe/d). U.S. production broke through 20mboe/d only once in history, on Q4 2019 - at the peak of the previous economic cycle. President Biden demand to hike internal output in a bout to put a lid on retail fuel prices looks therefore hazardous; it would heavily backtrack on the much-touted energy transition off from fossil fuels, while amassing capital investment in a sector that has been demonstrated to require entire quarters before its output may adjust. Even deeper into detail, U.S. refining capacity plummeted from all-time high in - guess when - Q2 2020 at 17.72mboe/d to 15.56mboe/d in Q1 2022, owing exactly to the energy transition kicking older plants off the industry, while leaving higher margins ("crack spreads") to those who stayed. As much as soft commodities, the move off from crude oil into natural gas has been taken for granted for too long. Policy makers were swift to point the finger to the bad guys; but too little was done to build the infrastructures of the energy of the future. A few more refinery runs won't make up for the problem
PROFTHREE'S TAKE
Out of the crude oil frying pan, into natural gas fire - mindful of coal burn. The Netherlands lifted limits on its three coal-fired power plants from 35% to full capacity until 2024; similar measures were undertaken by Austria, Germany and Italy as Russia goes all-out on natural gas curtailments. European Commission President Ursula von der Leyen urged Europe not to "backslide" its long-term commitment to cut fossil fuel usage, and to remain focused on "massive investments in renewables". ProfZero and ProfThree's eyebrows are as high as TTF gas prices - with but 4 months ahead of winter season, and the notorious impossibility for renewable energy to be stored, Profs are in fact fearing a much more worrisome backslide for the EU - one into full energy recession

Goldman Sachs Fib ConfluenceIn this update we review the recent price action in Goldman Sachs and identify the next high probability trading opportunities and price objectives to target

Weekly stock pick #4 and last of the week. Don't usually invest in funds but I like the set up here with 12M crossing 36M moving average , a lot of space to move up and the energy sector is good fundamentally at the moment . Id be entering now and selling 50-100% gains.
www.gsam.com

GS To Rise In Value?Good Day To The Investing World
Goldman Sachs has a bullish future, and its clear to see why. The graph shows us that the long entry is larger than the short entry, showing the value is increasing. Second, with US stocks going up in value, and the US Economy recovering from the big hit of increased interest rates, Goldman Sachs will almost very likely treat it as an opportunity. Lastly, the lines on the graph, which shows us that GS's high and low are both going upwards.
As always, read the graph if your opinion differs!

GS Fibonacci Circle Price Positions There are two positions we are either in
The white rectangle which is the beginning of a rejection pattern along the circle, or a green circle which is a bullish pattern that finds support on the circle
I am leaning more towards the green circle position (bullish state) due to the position price being quite highly above the circle and it is more comparable to the green circle on the yellow fib ring
Being above the green trend line adds to this bullish assumption
This is the Weekly chart for GS (Goldman Sachs)

HOLD THE LINE! Market Makers managed to push BTC under the important support of about 28200 . As you know from my previous Analysis BTC is very well correlated to SPX and it does not look good there either. I try not to do margin trading so I sold some of my BTC and put a BUY order around 21k . (Many OGs hope that BTC will not fall lower than the All time high of the previous cycle.
I wonder though how BlackRock and Citadel as well as Goldman Sucks managed to crash this market in a concerted manner, what they are up to next????
I mean obviously all the big players are all in on crypto and want to own the whole sector....

Expected Key Points Goldman Sachs 12 May 2022Godman Sachs 12 May 2022
The current implied volatility is at 46.4%/year
So that converted into daily is 2.92%
The close of yesterday was 301.55
So based on that our channel for today is going to be compressed within
TOP 310.5
BOT 282.5
with a probability chance of 78.2% based on the last 3007 candles
From fundamental point, today we have
PPI and initial jobless claims releases and these mark a huge volatility moment
At the same time the current values are expected to be bearish.

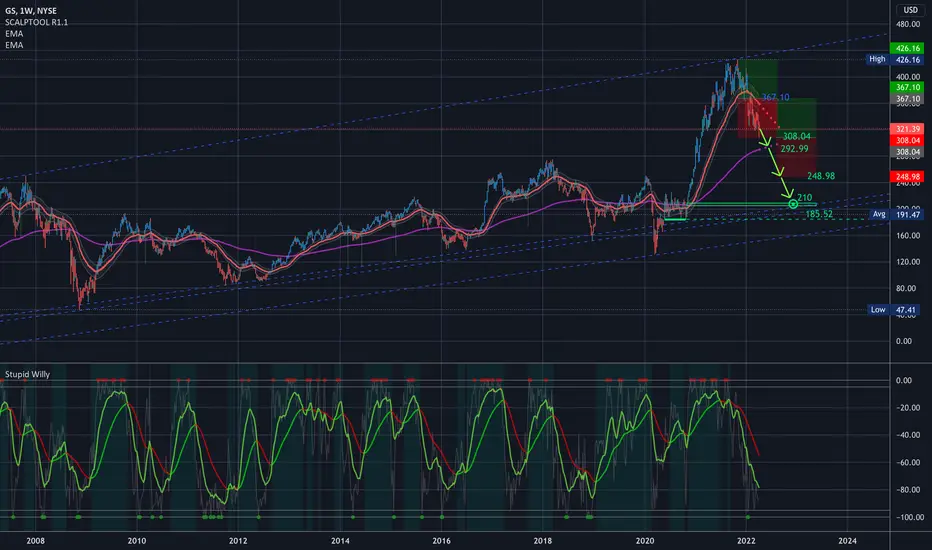
$GS Goldman Sachs - Key Levels, Analysis, & Targets$GS Goldman Sachs - Key Levels, Analysis, & Targets
This is a very long view, taking GS from the bottom of 2008 until today…. I’m expecting another 35% drawdown from here, but not necessarily by the end of the year which I have pictured… I was just running out of room so I didn’t want to push it further out.
I’d say by the end of 2023.
Around 210 I’d be comfortable truly going long again. Until then, it’s trader country.
Every target is a good target to add for a swing, and personally, I’m just going to continue selling puts at the bottom of the expected range until we’re at least under the 250 level.
Trade setup
1 at 308.04
1 at 292.99
2 at 248.98
4 at 210
8 at 185.52
(Then multiply by your multiplier (x5, x10, x100, x1000, etc to find your position size)
---
I am not your financial advisor. Watch my setups first before you jump in (or go back and review my past setups)… My trade set ups work very well and they are for my personal reference and if you decide to trade them you do so at your own risk. I will gladly answer questions to the best of my knowledge but ultimately the risk is on you. I will update targets as needed.
GL and happy trading.
IF you need anything analyzed Technically just comment with the Ticker and I’ll do it as soon as possible…
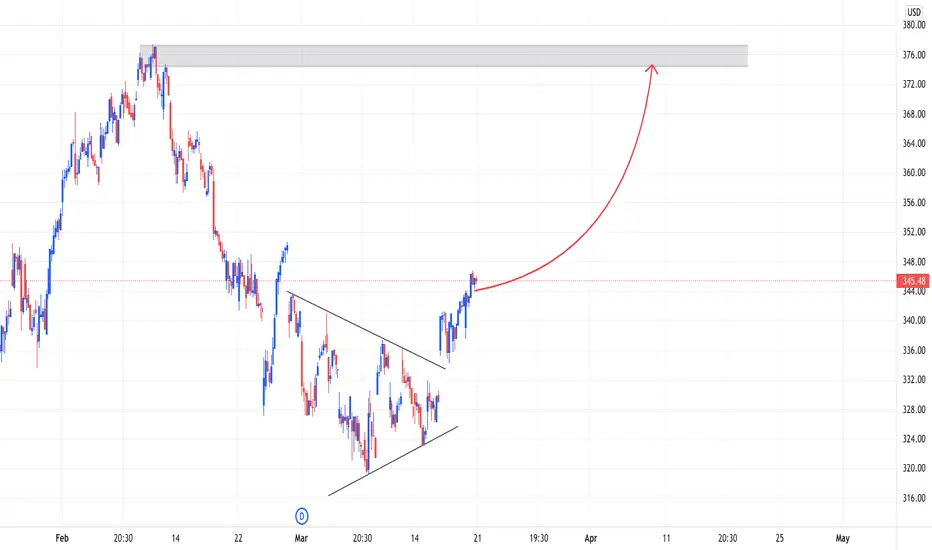
GSGoldman Sachs GS . 1H
A symmetrical triangle breakout with positive momentum (breakout gap) and a retest.
Expected target level of 355 riyals..
* Technical analysis and not a direct recommendation..
Goldman losing its pile of Gold. GSImmediate targets 344, 325, 301. Invalidation 467.
We are not in the business of getting every prediction right, no one ever does and that is not the aim of the game. The Fibonacci targets are highlighted in purple with invalidation in red. Fibonacci goals, it is prudent to suggest, are nothing more than mere fractally evident and therefore statistically likely levels that the market will go to. Having said that, the market will always do what it wants and always has a mind of its own. Therefore, none of this is financial advice, so do your own research and rely only on your own analysis. Trading is a true one man sport. Good luck out there and stay safe

Another short on Goldman. GSBDGoals 18.84, 18.32, 17.69 . Invalidation at 22.23 .
We are not in the business of getting every prediction right, no one ever does and that is not the aim of the game. The Fibonacci targets are highlighted in purple with invalidation in red. Fibonacci goals, it is prudent to suggest, are nothing more than mere fractally evident and therefore statistically likely levels that the market will go to. Having said that, the market will always do what it wants and always has a mind of its own. Therefore, none of this is financial advice, so do your own research and rely only on your own analysis. Trading is a true one man sport. Good luck out there and stay safe

GSCO - Weekly / Goldman Sachs Per usual, GSCO pays out Executives at the HIghest rate in history
and promptly implodes $63 from its recent November Highs.
November - the chosen month for ALL Highs in Equity.
_________________________________________________________
$3.8bn, or $10.81 per share, compared with $4.36bn, or $12.08 per share
YOY.
Bonuses up 31% year on year in the fourth quarter @ $3.2bn,
Annual salary expenses were up 33% @ $17.7bn in 2021.
Wage Inflation...
Traders at Goldman had a stellar year.
Management missed out on Floating Tennis Ball XMAS this Year.

Goldman Sachs Long over $400#GS
Banks been strong running off interest rate news from Feds. Saw a cool off mid week and sideways action ending friday. GS best level for calls is 400. This has been a trade over and over here. 405, 412 targets on calls. Puts can work below 389 but keep in mind 386 is a strong support as well. Id wait to close below this level before going short here.

Meanwhile $GS not doing well today...Big down candle so far on the big bank... $XLF with some relative weakness this morning...

LONG GS: INFLATION/ FED HIKE CYCLE/ 6X PE/ -10% CORRECTION ZONELong GS @383
TP: 600+
SL: N/A
GS at -10% correction lvl. Only trading 6x 12ttm and forward earnings. fed hikes/ inflation/ increasing rates good for banks especially as GS ramps up retail exposure/ loans.
Also if u look at last 2 years GS has bounced off of the -10% lvl every time.

LAST BLOWOFF top wave structure GOLDMAN SACHS TOP NEAR427 My view of what is just ahead is a 5th and finally wave up before the market as a whole is setup to break

Liquidity Area needs to be filled for Bullish movement I take a sell trade to the liquidity area and wait for some Bullish confirmation in the liquidity area. Gold still Bullish but some money is to be made traders.

GOLD BEARISHI see liquidity thats need to be filled in bottom. I have a low stop for Bullish setup to grab "resent high".
Gold is bullish but there is some money to grab before bullish momentum.

OXY: $2.40 | Asset Management for Big Boysfor Institutional levels whod like to move assets and sleep well at night
could be the next big win similar to Solana when it was at $2 few moons ago

10/17/21 GSGoldman Sachs Group, Inc. ( NYSE:GS )
Sector: Finance (Investment Banks/Brokers)
Current Price: $406.07
Breakout price trigger: $405.00(hold above)
Buy Zone (Top/Bottom Range): $396.75-$379.00
Price Target: $419.30-$421.60 (1st), $465.00-$467.40 (2nd)
Estimated Duration to Target: 19-21d (1st), 123-130d (2nd)
Contract of Interest: $GS 11/19/21 410c, $GS 1/21/22 430c
Trade price as of publish date: $9.70/cnt, $10.27/cnt
