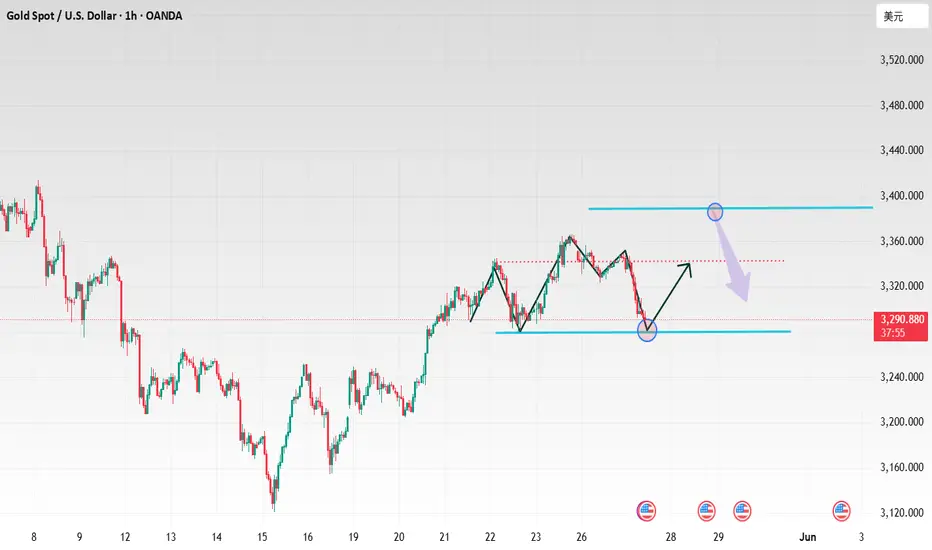
Gold trading direction remains bullish
Gold prices fell under pressure, breaking through 3,300 points during the session and eventually closing at a low level. The lack of fundamental support and the rise in US assets eventually caused gold prices to fall back, and are still in a falling stage.
At the beginning of this week, we made it clear that we would not enter the market at a high level to chase the rise. Gold prices are facing important technical suppression. Falling back may be inevitable, but it is also normal. Only by falling back can we expand the space for rising prices. The upward trend will not be changed during the adjustment. Under this development background, the next trading path is clear.
At the beginning of the week, although the US dollar rebounded, it is still unknown whether it can continue!
After the 20-year US Treasury auction last week was cold, this week will usher in the 5-year and 7-year Treasury auctions. If it is cold again, the market will only increase its distrust of the entire US assets. If so, it will theoretically be good for gold prices.
On Thursday, the market will welcome the minutes of the Federal Reserve's May monetary policy meeting, followed by speeches by several Federal Reserve officials. What will be the final tone? It is difficult to make predictions and affirmations now, and the market needs to observe inflation from this meeting and speech most, so as to clarify expectations on whether the Federal Reserve will cut interest rates or not, which requires special attention.
5.29 Federal Reserve Meeting Minutes
Whether the gold price retreats or fluctuates, it will not change the upward trend. This is a point we have made clear many times, but it should be noted that it is different from last year.
This year's rise is unlikely to rise from the beginning of the year to the end of the year like last year. This year's rise must go through multiple cycles and large space back and forth, especially leveraged transactions. Positions must be controlled and risks must be strictly controlled. Those who are not leveraged only need to wait patiently and use time to exchange space.
Yesterday, the price of gold retreated as expected, falling below 3,300 points during the session. After reaching the effective support level, it rebounded, but the strength was not strong and the space was not large. The final price was not high. From today to now, there has not been a strong rebound, and even if there is, it is difficult to sustain.
As of today, Wednesday, the decline in gold prices has not yet ended completely. The support tested yesterday is expected to be tested again, or even broken. From a technical point of view, there is still a lot of room for expansion below, but the trend of gold prices is not completely determined by a single technical aspect. It must be combined with fundamental information to make a comprehensive judgment.
In short, the upward trend of gold prices has not changed. In the stage of retracement and adjustment, it is necessary to control the rhythm of long and short changes. If it can retrace and lower the price, there will be more room for the next rise.
Goldmansachs

Analysis of gold trend at night and how to arrange it🗞News side:
1. Trump's view on Russia is not optimistic
2. Trump boasted in a post that his threat to impose tariffs on the EU worked
📈Technical aspects:
Gold does not seem to have a strong rebound. After touching 3305, the rebound momentum has weakened and it has been hovering between 3300-3290. Judging from the hourly chart, I think it is still in a state of correction. Then we may see another drop in the evening to accumulate momentum. This is why I chose to manually close the position near 3300 while waiting for the rebound just now. In the evening, bros can pay attention to the support line of 3280-3270 below to look for entry trading opportunities.
If you agree with this view, or have a better idea, please leave a message in the comment area. I look forward to hearing different voices.
FOREXCOM:XAUUSD FXOPEN:XAUUSD TVC:GOLD FX:XAUUSD OANDA:XAUUSD

Gold hits around 3280, please go long in the short term
📌 Driving Events
Gold prices fell more than 0.50% on Monday as demand for safe-haven assets decreased after U.S. President Donald Trump announced a postponement of tariffs on the European Union. Trading activity remained subdued as the U.S. and UK markets were closed for public holidays. As of this writing, the gold/dollar exchange rate was around $3,294. Trump issued a statement on Sunday, postponing the date of the 50% tariff on EU goods to July 9, and market sentiment improved. As a result, gold prices came under pressure and fell after a sharp rise of 4.86% last week (the strongest weekly performance since early April)
📊Commentary Analysis
Focus on the support level of 3285/80. If this area is touched for the first time, go long
💰Strategy Package
🔥Selling area: 3345-3350 SL 3355
TP1: $3333
TP2: $3325
TP3: $3308
🔥Buying area: $3280-$3285 SL $3275
TP1: $3312
TP2: $3330
TP3: $3345
⭐️ Note: Labaron hopes that traders can properly manage their funds
- Choose a lot size that matches your funds
- Profit is 4-7% of the fund account
- Stop loss is 1-3% of the fund account
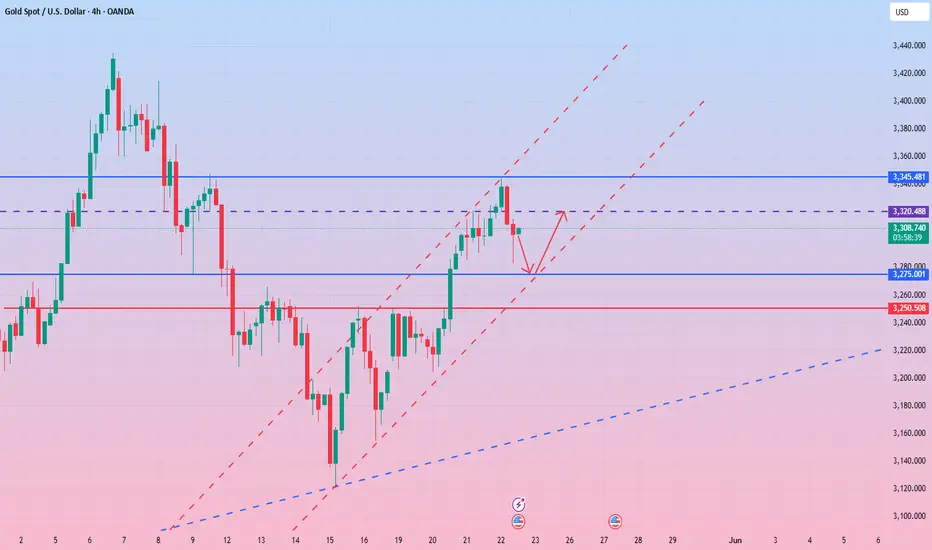
How will the short-term trend of gold develop?From a technical perspective, the overall volatility is limited. In the near future, the upper side is under pressure from the trend line, and the lower side is affected by the 4-hour middle track support. The overall trend is maintained in the range of 3365-3322. The current monthly line is approaching its closing, and the short-term market is temporarily in a high-level oscillation stage. In the 4-hour cycle, the price range is gradually narrowing, waiting for a directional breakthrough. The lower support focuses on the 3325-3320 middle track position and the previous top and bottom conversion support of the 3308 line; the upper pressure focuses on the 3352 and 3365 areas. After a slight high opening, it weakened. The overall idea is still to treat it as a wide range of fluctuations. It is recommended to be long and short in operation, and adjust the strategy after breaking through.
Operation suggestion: Go long near 3330-3323, and the target is 3340 and 3352;
If the pressure near 3352 is not broken, consider shorting, and the target is to fall back to the 3330 line.

Gold bulls advance as expected Mainly go long on pullback.Today, gold opened lower and fell, reaching the lowest level of 3331. Then the bulls exerted their strength, reaching the highest level of 3356 and then adjusted back. The overall trend was highly consistent with the expected judgment. Looking back at the market last week, the technical side of gold continued the bullish pattern, and the oscillating upward trend was significant. From the daily level, the price repeatedly tested around the 3200 mark at the beginning of the week, and finally stabilized successfully, laying a solid foundation for the bull market. On Friday, it was supported by the 3280 mark, continuing the strong oscillating upward trend, forming a reverse middle Yang pattern, and the daily K line closed with an oscillating upward break of the middle Yang, fully demonstrating the short-term bullish pattern of gold prices, and bullish expectations continued to heat up.
Based on the current gold trend analysis, the focus below is on the 3330-3320 range support, and the focus above is on the 3380-3400 resistance. In terms of overall strategy, the bullish thinking is maintained before breaking 3320 to avoid blindly guessing the top.

How to plan for gold price box fluctuations🗞News side:
1. The situation between Russia and Ukraine escalated again
2. Israel in the Gaza Strip was once again criticized by the international community
📈Technical aspects:
After gold opened lower today, it fell into a small box-shaped shock in the short term. It seems that the situation in Russia and Ukraine and the Middle East over the weekend did not have further impact on the gold price. The gold daily level closed with a positive line again, injecting new vitality into the trading space last week. These two rounds of rise not only successfully crossed the resistance level of 3250 last Monday, but also further broke through the suppression of 3320, showing a clear upward trend. The current volatility is more like a correction after breaking through the previous high! Last Friday, the price failed to break through the 3370 line several times and encountered resistance continuously, which shows that the pressure from above is still relatively strong! Due to the particularity of today's market trading, the technical side of the hourly chart shows a downward trend. The European session temporarily focuses on the 3350-3355 line resistance, and the 3330-3320 support is seen below.
If you agree with this view, or have a better idea, please leave a message in the comment area. I look forward to hearing different voices.
FOREXCOM:XAUUSD FXOPEN:XAUUSD TVC:GOLD FX:XAUUSD OANDA:XAUUSD

XAU/USD) Bullish reversal analysis Read The ChaptianSMC trading point update
Tchnical analysis for XAU/USD (Gold vs US Dollar) on the 4-hour timeframe, using Smart Money Concepts (SMC). Here's a breakdown of the idea behind this analysis:
---
1. Trend & Structure
The previous downtrend was broken with a change of character (ChoCH), suggesting a possible bullish reversal.
After the ChoCH, the market formed bullish order blocks which have been respected, confirming the bullish sentiment.
---
2. Key Levels
Support level: Around 3,220–3,240 region, coinciding with the 200 EMA, which has acted as dynamic support.
Order blocks: Several yellow zones indicate areas of institutional buying interest.
The most recent "new order block" is closer to the current price, showing a potential short-term demand zone.
---
3. Price Projection
The chart suggests a bullish continuation, projecting a move towards:
Target Point 1: Around 3,350–3,349.50
Target Point 2: Around 3,408–3,407.98
These levels are likely based on prior highs or imbalance zones.
---
4. RSI Indicator
RSI is above 65, showing bullish momentum, but nearing overbought territory (>70), which could signal a short-term pullback before continuation.
---
5. Trade Idea (Visualized Path)
A potential small pullback into the "new order block" around 3,280 is expected.
From there, price may rally to the next supply zones or previous highs, offering a potential gain of ~1.44%.
Mr SMC Trading point
---
Summary of the Idea
This is a bullish continuation setup based on:
Trend reversal via ChoCH.
Strong order block formations.
EMA 200 support.
RSI confirmation.
Traders might look to enter near the new order block (around 3,280), targeting 3,350 and then 3,408, while managing risk below the order block support.
Pleas support boost 🚀 analysis follow K

Gold prices remain strong as tariffs heat up again
Hey everyone, let's comment on the gold price next week from May 26, 2025 to May 30, 2025,
📌 Driving Events
Gold prices resumed their upward momentum on Friday, surging nearly 2% on the day and up more than 5% for the week as the dollar weakened amid renewed trade tensions. Gold prices rebounded from an intraday low of $3,287 to $3,359 as escalating rhetoric from Washington fueled investor demand for safe-haven assets.
U.S. President Donald Trump has intensified the trade standoff with the European Union, declaring that negotiations are "going nowhere" and threatening to impose a 50% tariff on EU imports from June 1. For months, Fed policymakers have made it clear that they want more clarity on the response from fiscal and trade policies and the economy before taking further action on interest rates. Over the past month, this cautious stance has prompted traders to withdraw their bets on a rate cut in the June meeting, and the market now expects the policy pause to continue until the July meeting. However, futures market positions show that the probability of a rate cut before the end of September is still slightly above 50%. This is essentially a bet that the situation will become clearer in the next four months: either slowing inflation paves the way for policy easing, or the economic deterioration forces the Fed to increase stimulus.
📊Comment Analysis
Tariff news has begun to heat up again, and the United States and the rest of the world have not yet reached a consensus on negotiations, and gold prices have benefited from this rise. The big time frame shows that the price is breaking out and continuing the upward trend
Technical:
Based on the resistance and support levels of gold on the 4-hour chart, Labaron has identified the following important key areas:
Resistance: $3412, $3436
Support: $3315, $3280, $3245
⭐️ Note: Labaron hopes that traders can properly manage their funds
- Choose a lot size that matches your funds
- Profit is 4-7% of the capital account
- Stop loss is 1-3% of the capital account

Buying on pullbacks remains the main theme!Tariff turmoil resurfaces, gold price jumps!
The Trump administration once again wields the tariff stick, threatening to impose a 50% tariff on the EU from June 1, and saying that there has been no progress in the negotiations between the US and the EU. Because the timing of this threat is quite subtle. Just earlier this week, the EU just submitted a new framework proposal to the US to restart bilateral trade negotiations. This directly led to a jump in gold price tonight!
Faced with the tough stance of the US, the EU is not sitting still. It is reported that the EU has formulated a contingency plan. If the negotiations fail, it will impose additional tariffs on US exports worth 95 billion euros in response to Trump's "reciprocal" taxation and 25% tariffs on cars and some parts, which will inevitably cause further impact on the market!
The bulls are in control and are unwilling to give the bears too many opportunities to cover their losses. Therefore, the strategy of following the trend needs to be more active - strong markets usually do not experience a deep retracement, and the correction phase will not break the previous low for the second time. After the current gold price surged to 3365, the intraday bull defense position should be set at 3340. The previous low of 3320 has been effectively supported, and the bulls have taken the absolute initiative, and there will be no short-selling opportunities in the short term. Based on the current strong bullish performance, continuing to maintain a bullish mindset is the core of the transaction.
Operation strategy:
1. Gold recommends going long in the 3340-3330 area, with a target of 3350-3360.
2. Gold recommends going short in the 3365-3375 area, with a target of 3350-3340.

Trump triggers risk aversion, how to position gold?🗞News side:
1. Trump plans to impose a 50% tariff on the EU
2. Houthi armed forces strike Israel again
3. Pay attention to the impact of the US dollar trend on gold
📈Technical aspects:
Trump is "crazy?" He suggested to impose a 50% tariff on the EU directly from June 1, and threatened to impose a 25% tariff on iPhones not produced locally. This news caused the euro, European stocks, and iPhone stock prices to plummet. At present, the gold price is consolidating between 3350 and 3360. For the US market, it is necessary to prevent a wash, but the short-term increase has been too large. If there is a rapid adjustment, the amplitude will also be large. Therefore, the US market is stuck in the range operation. Pay attention to the support of 3335-3325 below. If it continues to rise, pay attention to the resistance range of 3375-3385.
If you agree with this view, or have a better idea, please leave a message in the comment area. I look forward to hearing different voices.
OANDA:XAUUSD FX:XAUUSD TVC:GOLD FXOPEN:XAUUSD FOREXCOM:XAUUSD

Seize the opportunity in the gold marketGold fell after reaching a high point during the day, reaching a high of 3345 before going out of the big drop space, and the evening star appeared in the 4H cycle. Combined with the correction of the top divergence of the indicator, the short-term will enter the adjustment stage. Pay attention to the middle track support around 3280-75 in the future market. If it does not break, you can consider going long. Pay attention to the upper pressure of 3320 and 3335. Keep the idea of shock in operation!
Operation suggestion: Go long on gold around 3280-3275, and look at 3300 and 3320. Go short if the rebound pressure of 3320 is not broken.
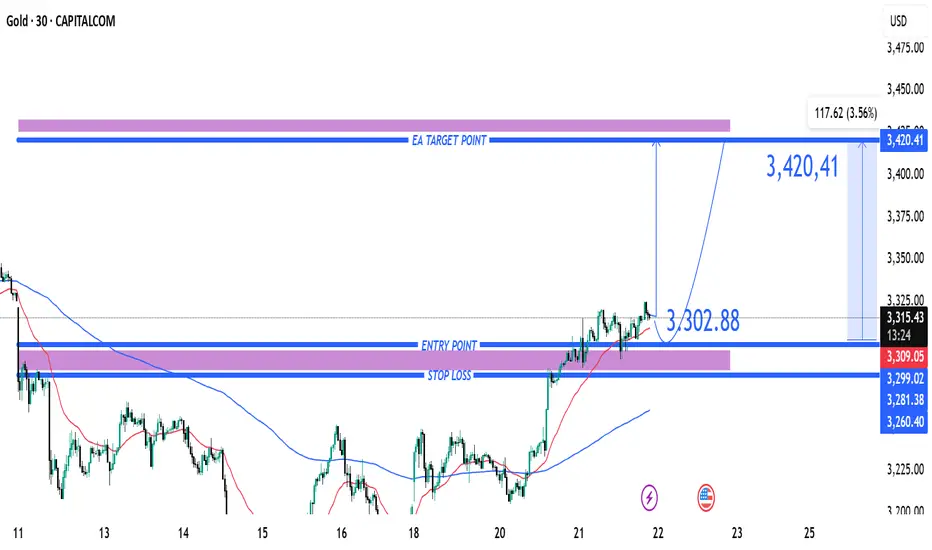
Gold (XAU/USD) Bullish Breakout Trade Setup – Targeting $3,4201. Entry Point Zone (~3,302.88 - 3,317.09):
This is the area where a long position (buy) is suggested.
The price has already moved slightly above this zone, indicating the trade may have already been triggered.
2. Stop Loss (~3,260.41 - 3,299.02):
Positioned below the entry zone to limit downside risk.
Suggests that if the price drops below this support zone, the trade idea is invalidated.
3. Target Point (3,420.41):
A bullish target suggesting a potential upside move of ~117.62 points (or ~3.56%).
This zone acts as a take-profit level.
4. Technical Indicators:
Moving averages (possibly 50 EMA in red and 200 EMA in blue) show a bullish crossover recently, supporting the upward momentum.
5. Pattern Outlook:
The chart implies a possible cup-and-handle or bullish consolidation breakout pattern, anticipating continuation upward.
Summary:
The strategy depicted is a bullish breakout setup:
Buy near 3,302.88–3,317.09
Stop Loss near 3,260–3,299
Take Profit near 3,420
This setup favors buyers as long as the price remains above the stop-loss zone. If the market holds this structure, there's a good risk-reward ratio for a move to 3,420.41.
Will gold continue to rise as risk aversion heats up?
📌 Gold driving factors
At present, the current market sentiment has turned cautious, driving safe-haven funds into gold. Previously, Moody's downgraded the US sovereign credit rating, and President Trump's promotion of a large-scale tax cut bill is expected to be passed by Congress, further strengthening the theme of "selling the United States" and exerting continuous pressure on the US dollar.
In addition, the resurgence of disputes between the United States and China on the chip issue, and the news that the Group of Seven is considering imposing tariffs on cheap Chinese products, have exacerbated the uncertainty of the global economic outlook, further suppressing the US dollar, while supporting gold, a traditional safe-haven asset, to an eight-day high. Gold prices also benefited from the heating up of geopolitical tensions. CNN reported that several US officials revealed that Israel is preparing to launch a strike on Iran's nuclear facilities.
📊Commentary Analysis
The current market is still running in a range of shocks. Therefore, the US market is still trading repeatedly around the range for the time being. For the time being, the small range will temporarily look at the 3320-3285 line!
💰Strategy Package
Gold: Short when it retreats to around 3325-3320, stop loss at 3330, target around 3290! For long orders, look at the support situation and then enter the market at the right time!
⭐️ Note: Labaron hopes that traders can properly manage their funds
- Choose the number of lots that matches your funds
- Profit is 4-7% of the fund account
- Stop loss is 1-3% of the fund account

Grasp the core strategy of trend tradingGold continues to be bullish and will go to the area near the gap of 3325. At that time, the short-term may be blocked and fall back. If it breaks, look at the area near 3340-3345. In the 4H cycle, relying on the moving average to support the rising stage, and the Bollinger is in an open state, there is still room to see above. The support for the fall back is to pay attention to the top and bottom of the small cycle of 3285, followed by the low point of 3274, but there will not be too much retracement in the strong position. In terms of operation, the main fall back is long, and gradually look at 3325 and 3345. Shorting can only be entered at key points, and fast in and out without fighting.
Operation suggestion: Go long on gold near 3285-74, look at 3315 and 3325! If it is extremely strong, go long on the support of 3298-3295!

Gold is rising strongly, can it retreat and go long today?🗞News side:
1. US officials said Trump's statement was related to the Golden Dome Project, which may affect the flow of funds
2. The tension in the Middle East has intensified, and the risk aversion sentiment has increased, which is good for gold
3. Although the withdrawal of Indian and Pakistani troops has eased the regional situation, geopolitical risks still exist
4. Trump mentioned the tax bill, which affected economic expectations and affected gold investment sentiment to a certain extent.
📈Technical aspects:
Yesterday we gave the view that there would be suppression at the 3290 level above, but affected by geopolitics, risk aversion sentiment rose again. Today, the moving average spread upward, and the Bollinger Bands opened and expanded, and the situation is still bullish. At present, we need to pay attention to the key short-term support level, focusing on the 3280-3285 support line. If the price retreats to this level and does not weaken, it can be considered as an opportunity for us to go long. If the resistance of 3320 is broken through strongly, the upper target will move up, and the lower support will also move up accordingly. 3300 will be converted into an entry opportunity for bulls to pull back. Therefore, we need to observe the price continuity in the European session. If the European session continues to break highs, the US session's correction will still be mainly based on long positions. During the day, it is recommended to wait for gold to retreat to 3290-3280 and try to arrange long positions, looking upward to 3320-3330.
If you agree with this view, or have a better idea, please leave a message in the comment area. I look forward to hearing different voices.
FOREXCOM:XAUUSD FXOPEN:XAUUSD TVC:GOLD FX:XAUUSD OANDA:XAUUSD

Gold price suddenly rises, how to get out of the trap at night🗞News side:
1. Humanitarian crisis in Gaza Strip, many civilians injured. I hope that world peace is all right
2. The call between the Russian and Ukrainian leaders is still ongoing
📈Technical aspects:
After gold fell back after touching 3250, it rose again and has broken through to around 3270. This rapid rise was unexpected. Although the 1H moving average turned upward, the gold price is currently consolidating at a high level. It is not suitable for us to enter the market at this time. We should remain on the sidelines and pay attention to the pressure at 3290 above. The short-term support below needs to pay attention to 3250-2540.
If you agree with this view, or have a better idea, please leave a message in the comment area. I look forward to hearing different voices.
OANDA:XAUUSD FX:XAUUSD TVC:GOLD FXOPEN:XAUUSD FOREXCOM:XAUUSD

Is the gold trend caught in a vicious circle of ups and downs?
In the short term, the trend of gold prices has been separated from the influence of fundamentals, and is more dominated by emotional games. In particular, the price of gold once rose by 30% in 2025, which seriously stimulated the speculative sentiment in the market and made it easy for gold prices to fall into a vicious circle of "big ups and downs".
Next, the price of gold will become more sensitive to a series of factors, especially trade wars and tariff policies, geopolitical turmoil, the Federal Reserve's monetary policy and US macro data, as well as global central banks' gold purchases and physical demand, etc., will cause violent fluctuations in the short term. These are the points we need to pay close attention to!
Views on the trend of gold in the European session!
Looking back at the gold trend of the daily line in the past few days, the high resistance is generally maintained at around 3165-3150. This is also the fundamental reason why gold has been jumping up and down during this period, but it is still weak and under pressure overall. In addition, the current trading price is at the upper end of Friday's range, and the bullish momentum is not large, basically maintaining near a neutral point!
Since the market continued to be under pressure at 3250 yesterday, the market's bullish considerations need to be lowered first. At the same time, since it has been under pressure below 3265, the current short-term adjustment is obvious on the technical side, and short orders still need to be followed up! At present, we can only wait and see whether the market breaks upward or downward, and follow the trend.
Gold: Retreat to low longs near 3200 once, defense at 92, target at 3235! Retracement to near 3240-45 to gamble on short orders!

It’s the right time to shortUS President Trump recently criticized Fed Chairman Powell again, calling him "slow to act" and emphasizing that the Fed should cut interest rates as soon as possible to support the economy. Trump believes that delaying interest rate cuts may lead to the risk of recession in the US economy, but the Fed still takes inflation and employment data as the core of decision-making, and the two sides have obvious differences in policy positions.
At present, the Fed's interest rate cut expectations have been postponed and the magnitude has been reduced. Coupled with the expectation of rising US bond yields, the gold market sentiment has weakened. The world's largest gold ETF recently reduced its holdings by 8.98 tons to 918.73 tons, reflecting the cooling of institutions' short-term bullish enthusiasm for gold. Technically, gold prices continued to weaken after breaking through key support last week, and the weekly closing was negative, suggesting that shorts were dominant; the daily level was constrained by the 20-day moving average, and the volatile downward trend may continue in the short term. Focus on the 3250-3265 line resistance during the day. If it cannot break through, the $3,200 mark below may face a test.
Gold recommendation: short sell when it rebounds to 3245-3252 range. Target 3230-3220.
How to layout in the battle between long and short positionsGold surged directly at the opening, which is in line with our analysis expectations. We gave a short position near 3240-45. As expected, gold fell to the 3230 line for profit. There is great pressure from above and limited space above. Up to now, it has been fluctuating near 3220. For gold, we are now focusing on the short-term support of 3200-06. If it breaks through this position, it is very likely to go to the 3175-90 line.
From the current trend analysis, today's support continues to focus on 3170-80, strong support 3150, and upper pressure 3253-60. Relying on this range as a whole, the main tone of high-altitude low-multiple cycle participation remains unchanged. In the middle position, you must watch more and move less, be cautious in chasing orders, and wait patiently for key points to enter the market. I will notify you of the specific operation strategy in time and pay attention to it in time.
Gold operation strategy: short gold rebound near 3240-50, target 3230-3220. Pay attention to the support of 3202 and 3175 below, and go long according to the strength of the decline!

XAU/USD) back up Trand analysis Read The ChaptianSMC Trading point update
Technical analysis for XAU/USD (Gold vs. US Dollar) on the 4-hour timeframe suggests a bullish reversal setup from a key support zone. Here's a breakdown of the idea:
Key Observations:
1. Support Zone (Yellow Box at ~3,100–3,140):
The price recently touched a significant support area marked by multiple previous bounces (green arrows).
The latest green arrow shows a bullish reaction from this zone, indicating potential for an upward move.
2. Resistance Zone (~3,220–3,250):
This intermediate zone is expected to be the first area of interest for bulls.
The analysis suggests a brief pullback or consolidation before continuation.
3. Target Point (~3,375):
The chart outlines a projected move to around 3,375, aligning with a previous supply zone and the upper channel line.
This is likely the main target for a swing trade.
4. EMA 200 (Blue Line - ~3,221):
Price is hovering around the 200 EMA, acting as a dynamic resistance.
A breakout above this would add bullish confirmation.
5. RSI Indicator (~41):
RSI is recovering from an oversold region (~38), indicating potential momentum building for a reversal.
Mr SMC Trading point
---
Conclusion:
This is a bullish reversal setup with:
Entry zone: Around 3,120–3,140
Short-term resistance: ~3,220–3,250
Final target: ~3,375
Invalidation: A clear break and close below the yellow support box (~3,100)
Pales support boost 🚀 analysis follow)

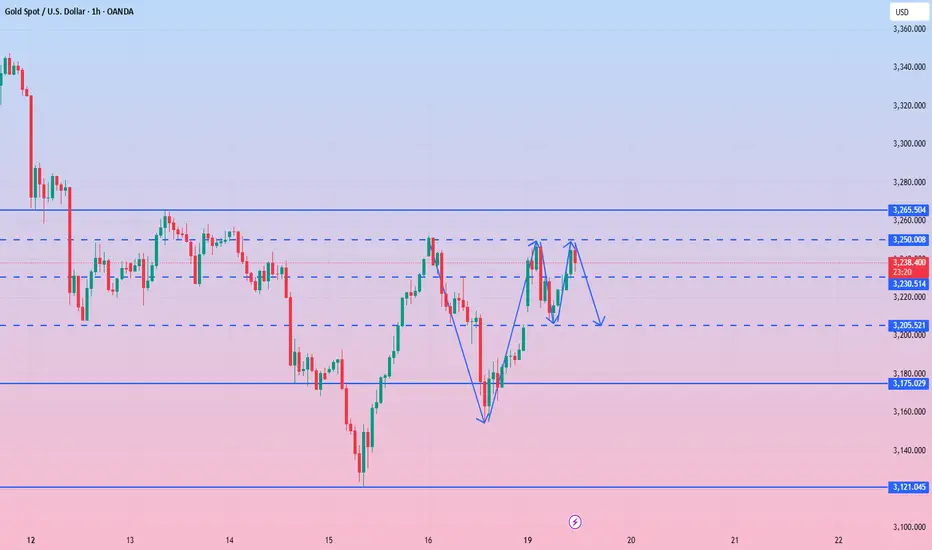
XAU/USD) bullish trend analysis Read The ChaptianSMC trading point update
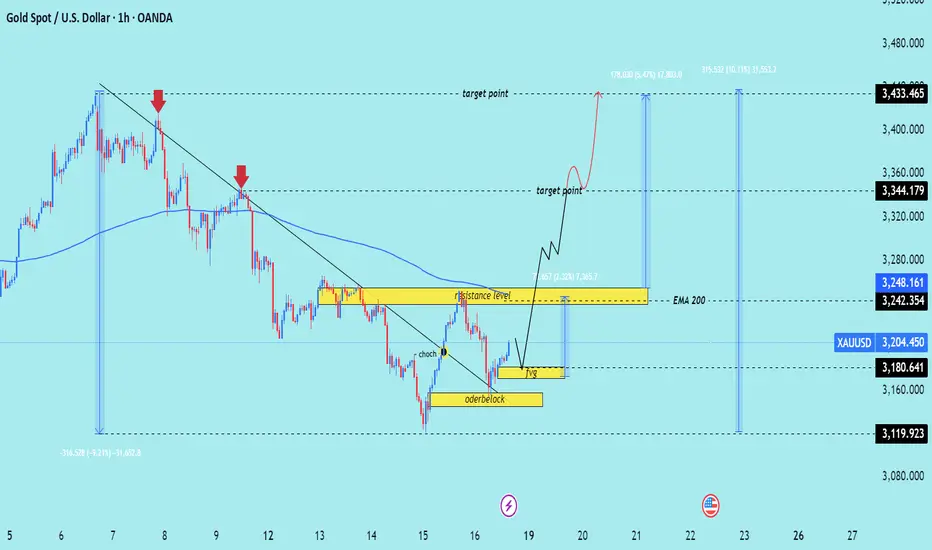
Technical analysis of XAU/USD (Gold Spot price against USD) on a 1-hour timeframe, featuring a Smart Money Concept (SMC) approach. Here's a breakdown of the key ideas presented:
---
1. Downtrend & Trendline Break
The chart initially shows a downtrend with two red arrows marking lower highs.
A trendline is broken, indicating a potential shift in market structure.
CHOCH (Change of Character) is labeled — a key SMC concept signaling a reversal from bearish to bullish structure.
---
2. Orderblock & FVG (Fair Value Gap)
A bullish orderblock is highlighted, indicating an area where institutional buying may have occurred.
A Fair Value Gap (FVG) is shown, which often acts as a magnet for price to fill inefficiencies before continuing in the intended direction.
---
3. Resistance & Target Zones
A resistance level is marked near 3248–3250, which price may revisit and possibly break.
Two target points are identified:
First target: ~3344
Final target: ~3433
---
4. EMA 200
The EMA 200 is acting as dynamic resistance; a break above it adds confluence to the bullish bias.
---
5. Expected Move
The analysis anticipates:
1. A pullback into the FVG or orderblock.
2. A bullish continuation after mitigating those zones.
3. Price aiming for the resistance and eventually the upper targets.
Mr SMC Trading point
---
Conclusion
This is a bullish outlook based on a structural break (CHOCH), institutional demand (orderblock), and gap-filling logic (FVG). The price is expected to pull back slightly and then rally toward the 3344 and 3433 levels if it holds the orderblock zone.
Pales support boost 🚀 analysis follow)
XAUUSD Bearish Setup with Key Entry, Stop Loss & Target LevelsEA GOLD MAN XAUUSD
Entry Point: $3,235.94
Stop Loss: $3,235.94 (above current price, suggesting a SELL trade)
Target Points:
EA Target Point (Downside): $2,974.71 (Short target)
EA Target Point (Upside): $3,505.03 (Long target — likely alternate scenario)
Resistance Level: $3,121.49
Nearby Support Zone: Around $3,000–$2,975
📉 Trade Strategy Implied
This appears to be a short position setup:
Sell at: ~$3,220–$3,235
Stop Loss: $3,235.94
Take Profit: $2,974.71
Risk/Reward Ratio: ~1:3 (very favorable setup if thesis holds)
The upside target ($3,505.03) might be for a different scenario — if price reverses and breaks above resistance.
🧠 Market Structure Observations
Trend: A bearish break from a previous ascending channel.
Momentum: Price has bounced slightly after hitting support, but the moving averages suggest bearish momentum may persist.
Key Risk: If price breaks above $3,236 convincingly, it could invalidate the short setup and trigger a bullish run.
📌 Summary
Bias: Bearish (based on current setup)
Setup: Short with tight stop above resistance
Confirmation Needed: Watch for rejection at the $3,220–$3,236 zone and a breakdown below $3,200 for follow-through.

Gold has a strong deep V, 3200 support is good for longThe 1-hour moving average of gold begins to turn and continue, so the momentum of gold bears begins to weaken, and gold bulls may begin to exert their strength. However, gold started to rise all the way from 3120 to 3252 yesterday. Gold rose by about 130 points, so the volatility began to increase. Therefore, we must wait patiently for gold to adjust. Because of such a large fluctuation, an adjustment will also be tens of dollars. We must wait patiently for the adjustment and stabilize before going long. After gold breaks through 3192, it is considered a strong deep V breakthrough of important resistance. Then 3192 of gold has now become an important support level. If it falls back to 3192 in the Asian session, go long on dips. If gold falls back to near the 3200 mark, you can try to go long.
Since gold has started to reverse strongly, gold bulls have begun to show their muscles. In the short term, we should not be stubbornly bearish anymore. We should be flexible and adapt to the market. The market is like this, changing rapidly. We should adapt to the market and not be too obsessed with bears or bulls. Obsession is a trap. Gold bulls are strong now, so gold is now the home of bulls. Go long when the Asian session falls back.
