Gold MCX Bullish MoveGold as long as it is staying above the ichimoku cloud it can show a bullish move from here within a few days.. this month we can expect some movement on the upside clearing highs.
Stop loss can be kept near 94700-95300 levels with target of 102000 - 105000 with this month.
Goldmcx

Gold remains up at the beginning of this week
📌 Gold Consulting
Gold prices rose sharply on Monday, reaching their highest level in more than four weeks, affected by the escalation of geopolitical risks caused by the conflict between Russia and Ukraine. The re-escalation of trade tensions between China and the United States prompted investors to buy gold throughout the day. As of this writing, XAU/USD is trading at $3,377, up 2.70%.
Market sentiment turned sour on news that Ukraine launched an airstrike against Russia, destroying long-range bombers and other aircraft. Meanwhile, US President Trump doubled the tariffs on steel and aluminum imports to 50%, effective June 4, and his remarks against China led to a decline in US and global stock markets. CNBC
Reports said that Trump and Chinese President Xi Jinping may talk this week, but not on Monday.
📊Comment Analysis
Gold prices maintained their upward momentum at the beginning of this week, but tariff tensions and war with Russia remain unpredictable. Gold prices are supported and will return to the 3400 area.
💰Strategy Package
🔥Sell Gold Zone: 3409-3411 SL 3416
TP1: $3400
TP2: $3388
TP3: $3372
🔥Buy Gold Zone: $3313-$3315 SL $3308
TP1: $3327
TP2: $3340
TP3: $3355
⭐️ Note: Labaron hopes that traders can properly manage their funds
- Choose the number of lots that matches your funds
- Profit is 4-7% of the fund account
- Stop loss is 1-3% of the fund account

Gold is rising strongly, waiting for a breakthrough.Gold prices soared after the Asian market opened, reaching an intraday high near 3363. However, today's market is also affected by many black swan events.
Event summary:
On the eve of the ceasefire negotiation between Russia and Ukraine, Ukraine attacked a Russian military base with a drone; the United States said it was unaware of the incident.
Trump made a statement saying that China violated the relevant provisions on trade tariffs, and then the US Treasury Secretary said: The United States will never default. This news has worsened Sino-US trade relations.
Due to the sudden black swan event, the sentiment for gold as a safe-haven asset has rapidly heated up, and the price of gold has skyrocketed in the Asian market.
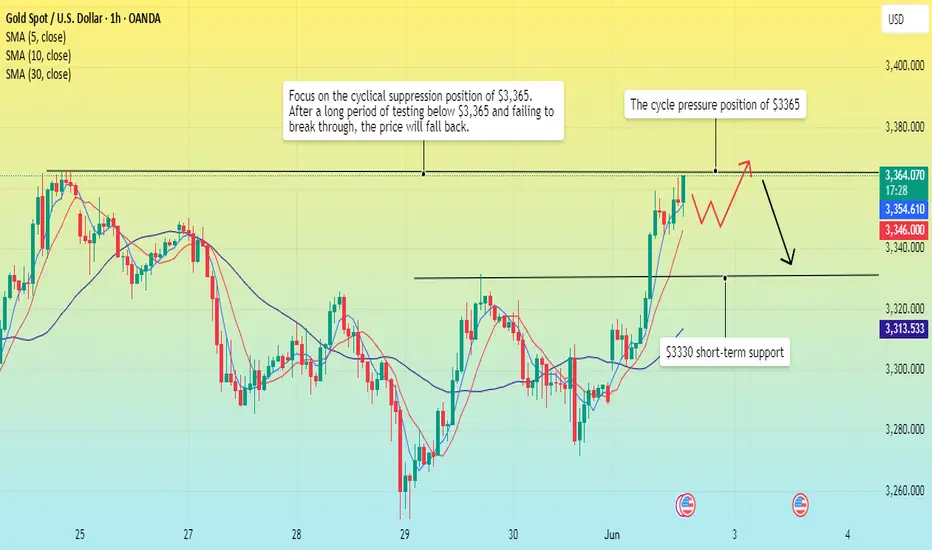
At present, due to the impact of international events, the price of gold has calmed down after the correction, and is currently consolidating around 3355. The 1-hour chart shows that the 5-day MA moving average is currently flat, but the 10-day and 30-day MA moving averages have turned sharply and are on an upward trend, so I think that the current rise in gold has not yet reached its peak.
Market analysis:
The support level in the Asian morning session is around 3300, and the gold price has successfully stood above 3330, and the lower support has also moved up to around 3330; the intraday gold price has a very small retracement, and it is still breaking through the upper side. It is currently trying to break through the cycle suppression level of 3365. After a strong breakthrough, it will reach the cycle high point of 3370. If it fails to break through strongly, the price will fall below 3365 and may touch the current support level of 3330.
Operation strategy:
Buy near 3345, stop loss 3335, target range 3360-3370.
Short term is still dominated by short positions!Although the easing of trade tensions in the short term has led to a correction in gold prices, the three core factors supporting the strength of gold still exist: expectations of loose global monetary policy, rising geopolitical risks, and the long-term weakening trend of the US dollar. In particular, the market expectation that the Federal Reserve may maintain loose monetary policy will continue to provide momentum for gold to rise.
From the daily chart, the price of gold has shown a clear upward trend since this year. Although there have been several corrections in the middle, the bulls still control the medium and long-term market. After the previous rise in the H4 cycle, it is not so strong now. Instead, it is a volatile trend. The Bollinger band is closed, and the trend strength still needs market stimulation to rise again.
The 1-hour moving average of gold has begun to turn, so the rising strength of gold bulls has been suppressed. The high point of the 1-hour rebound of gold has been getting lower and lower, and the low point has also begun to fall. The 1-hour gold has begun to fluctuate downward. The downward trend of the gold rebound is suppressed near 3340. Gold rebounds near 3340 and can still be shorted.

Trump's tariff measures trigger market shocks
📌 Driving events
Last Friday, as Trump threatened to raise tariffs on the European Union to 50%, and also pointed the finger at smartphone manufacturers such as Apple and Samsung, the market's risk aversion sentiment suddenly heated up, and spot gold closed up nearly 2% on the day.
On Sunday local time, US President Trump announced after a call with European Commission President von der Leyen that he would extend the deadline for the European Union to face 50% tariffs to July 9. Trump told reporters on his way back to Washington on Sunday: "We had a very pleasant call, and I agree to postpone the deadline."
Bloomberg analysis said that there are signs that US President Trump may relax his radical stance on EU trade, which will affect gold's safe-haven status.
At the geopolitical level, the conflict between Israel and Iran is imminent. The Israeli army's shooting of a diplomatic delegation has triggered international condemnation. Netanyahu has maintained a tough stance in the Israeli-Kazakh conflict; Trump's mediation of a ceasefire between Russia and Ukraine has been frustrated. The Wall Street Journal revealed that when he spoke with the European side, he said that Putin believed that the Russian army was "winning", which contradicted his public statement. This week, the market focus shifted to the Fed's policy minutes, the Bank of Japan's rate hike expectations, European and American economic data, and OPEC+'s production increase plan. The interweaving of trade frictions, debt risks and geopolitical conflicts has kept the uncertainty of the global pattern high.
📊Comment Analysis
The first support level for gold prices may be in the range of $3290-3300/ounce. If it falls below the above support, the next support for gold prices will be $3250/ounce and $3200/ounce (50-day moving average). On the upside, the first resistance for gold prices is $3370/ounce. If this obstacle is overcome, the next resistance for gold prices will be $3430/ounce and $3500/ounce (historical high).
Labaron will digest a series of economic data to be released by the United States this week, such as durable goods and home sales, as well as the consumer confidence index. The U.S. stock market will be closed on Monday due to the Memorial Day holiday.
💰Strategy Package
⭐️SET UP GOLD PRICE:
🔥SELL GOLD zone : 3388- 3390 SL 3395
TP1: $3376
TP2: $3363
TP3: $3350
🔥BUY GOLD zone: $3301- $3299 SL $3294
TP1: $3312
TP2: $3325
TP3: $3338
⭐️ Note: Labaron hopes that traders can properly manage their funds
- Choose the number of lots that matches your funds
- Profit is 4-7% of the capital account
- Stop loss is 1-3% of the capital account

Gold at critical stage (ready to short)Gold is at critical stage any movement from here will be sharp downside, I will wait for it
It is forming M pattern in Day chart

GOLD / XAUUSD: Breaking the down channel (correction wave)Therefore, if the 21-day SMA holds in the event of a weak US Non-Farm Payroll (NFP) report, a rebound toward the immediate static support-turned-resistance at 3260 could occur.
A sustained move above that level would encourage Gold buyers to push further toward the former channel support, now acting as resistance, at 3405.

3360 neckline is being tested!
📊Comment Analysis
Short-term short positions need to rebound further and confirm the signal before following. After the US market breaks through the 3360 defense point, it is temporarily not possible to continue to be bearish. The US market will first look at the rebound, and then make further arrangements after approaching the 3360 line.
💰Strategy Package
Long positions:
The US market temporarily enters the market to go long when gold falls back to around 3297-3310 US dollars. Target 3340, stop loss 3345.

Gold Trend AnalysisContinuing the plunge in stock markets on Monday, gold also headed for a low. The reason is that the market's expectations for the Fed to cut interest rates by 50 basis points in September have declined. The yield on the 10-year U.S. Treasury bond has risen to 3.94%. These two pieces of information have undoubtedly greatly weakened traders' confidence in entering the market. However, as a traditional safe-haven asset, gold has performed well amid geopolitical tensions and concerns about a global recession. Continued tensions in the Middle East and concerns about the outlook for the global economy have provided support for gold. At the same time, data from the People's Bank of China showed that gold reserves at the end of July were the same as the previous month, showing the central bank's stable demand for gold. Support level 2430 2450 Resistance level 2395 2385 2370 What do you think of the trend of gold? Welcome everyone to follow and comment

Gold next week trading signal analysisAt the end of the week, for this week, I can only say that the profit is almost perfect, I believe you are also very happy? After all, as far as I give the single statistics, this week killed more than 200 points of profit, I feel exaggerated, and these profits, also proved the end of the trough period, and, as far as the current statistics of this month, I also did recover the early losses and further profits, to the single, this month, profit and loss, the current statistics there are nearly 100 points of profit, The specific profit this month is about 98 points, this point, you can compare and verify yourself, in short, the list is one to one, this point, you can judge yourself. Of course, due to the actual and operational process will inevitably have a little accident, so the specific profit and loss, you also need to compare according to their actual situation, in short, as long as there is no accident, such as the market malicious washing and Chen Feng my state of instability, otherwise the cycle is just the number of profits, this, thank you for your persistence. So now, July is coming to an end, other, I am not greedy, there is a good ending on the line, then at the moment, other, I do not say much, directly to next week's market analysis, you can read the following reference to understand.
-- Gold Friday market review --
Friday morning, gold opened in the 2364 line, the opening that fell into the 2364-2361 range of oscillations saw, but the good times did not last long, early in the morning, gold suffered a wave of crashing disc flash collapse in 2355, and then blocked to usher in a bull counterattack, gold is therefore a break of 2360-2370, the highest to 2379 line to usher in a stop back down, Long and short in the 2378-2370 range after a sawing encounter under 2370, but the bears did not usher in a further outbreak, but on the eve of the European trading stopped at 2368 ushered in a rebound 2375 line. During the European session, gold first went down a wave near 2365, and then stopped to usher in a slow rise in shock, gold is also slowly going up a wave near 2375 ushered in a stop shock, overall, during the European session, gold is deep in the 2375-2370 range. And the United States trading period, PCE data released bearish, but unexpectedly, gold did not usher in a sharp fall, but was blocked by 2371 ushered in a bull outbreak, gold is therefore broken 2380, the highest to near 2391 to usher in a halt, then fell back 2379 blocked into a wide range of volatility, long and short in 2390-2380 repeatedly saw, It closed at around 2,387.
- Is gold hitting a stage bottom? Super week attack, gold long short how to choose? -
At the end of the week, for this week, gold is also relatively ushered in a large fluctuation, at the beginning of the week, gold shock from 2400 above ushered in a short outbreak of 2383 stop rebound, gold on the eve of the outbreak of GDP data, the highest is also a rebound of 2431 line, then for this point, I also mentioned in the blog earlier, In the case of gold sticking to the see-saw near 2400, there must be a rebound near 2420, more likely to break 2420 and usher in a reversal plunge, then in fact, the market is also fluctuating as I analyze, after all, as of Thursday, GDP and unemployment benefits and PCE data are all as bearish as I analyze. Gold is also expected to usher in lower 2360, and for this I also said, gold is expected to usher in a stage bottoming out in the 2360-2350 region, and gold is also in the 2353 ushered in a recovery, just said Friday Chen Feng I expect PCE more help gold bulls counterattack 2400-2420, in fact, The highest also rose to around 2391, which is still a little gap with my analysis, but in general, PCE explosion and negative rise this is a fact, this, you can read my recent analysis blog to verify.
So what about next week's gold bulls and bears? In fact, for this point, I don't need to say that you all know that next week's market is not simple, after all, for next week, the Federal Reserve interest rate resolution and Powell's speech came, coupled with the multiple outbreaks of ADP, PMI, unemployment benefits, non-agricultural, unemployment rate and other data, in terms of this market, I think it is limited ability to make a clear prediction and control. In fact, I can't blame me, after all, the current gold market, institutional control of the influence is too big, the influence of the data is limited, moreover, in the near future, the surprise of the data is also slightly increased, take Thursday, PCE data range is so lower than the previous value of the case, Friday's PCE annual data is actually synchronized with the previous value, in terms of this possibility, Minimal probability can appear, which also reflects the current market is not calm, especially at present, the market expects the possibility of the Federal Reserve rate cut in September is a certainty, and then refer to the current inflation slowdown and the Federal Reserve officials said that the need to cut interest rates in advance of the speech, maybe this week will usher in the rate cut landing is not necessarily, so in this case, you also need to be cautious. Of course, for next week, if the data is positive, Powell does not rule out the possibility of further eagles to fight interest rate cuts, this point, you must not blindly bet on the short.
So for next week, at the beginning of the week, we must still look at a wave of rebound, after all, gold on Friday since the 2355 stop to rebound, this wave, gold is also facing a stage of bottoming out, after all, in any case, in the case of excessive interest rate cut expectations, gold since 2483 high 2353, Bears have ushered in a fall of 130 points, in the short term, gold also has a certain rebound demand, coupled with the current interest rate minutes and Powell's speech in the case, gold will have a high probability of buying expectations to pull up, that is, before Thursday, gold will have a high probability of further impact 2420-2430-2450, of course, Do not be too happy too soon, after all, for Powell's speech, his remarks are often disappointing, once Powell unexpectedly put eagle in this speech, coupled with the strong non-agricultural employment performance, that gold may also usher in the possibility of further collapse, for next week, the focus is to pay attention to the market news situation and then choose the future market, All in all, next week, the market will inevitably have malicious control of the situation, you must remember to pay attention to the control of risk.
So for next week, Monday, it is expected that gold will not have any big high and low open possibility, in this regard, for Monday, you can focus on a wave of 2390 can be successfully broken, of course, if 2385-2380 does not break, you can also directly see more than 2400 mark gains and losses, such as successfully broken 2400, Then do more directly on the trend to see 2420-2430. Of course, if you break 2380, you can also wait for 2373-2370 not to break again. All in all, for next week, try to keep back to the long to layout, short cautious. As for the specific analysis and operation details, I will make an update on Monday, please remember to strictly follow my requirements to control the position and stop loss basis.

Gold 70,100 possible !!we have seen on daily time frame price formed rising wedge pattern
on friday 7jun we seen a bearish big candle confirming the breakdown of the pattern
price then tried to take a bounce from recent orderblock
but we can clear see that the bearish pressure is not letting the bullish orderblock go any further up
causing the price to form a small triangle pattern which will eventually work as buildup for more down side and we can 70,100 level in coming days
will further after price hits 70,100 level
follow for more

Cup Pattern Formed, wait confirmationNow Cup Pattern formed and wait for the Breakout. Because Breakout is the only confirmation to achieved Cub Target. In stock market commonly formed Cup & handle Pattern.
I want to help people Make Profit all over the World throughout my entire life. Additionally, I am eager to Receive Money form Worldwide because of my Potential.

Gold prices remain bullish. Available to buy now
Gold prices in Asia were flat.
No news about assists yet
The price of gold remains within a narrow range of 2177-2179. The long and short competition is fierce.
Based on the observation of MA and four-hour trend chart, the market is still in a small long trend. The bulls are obviously stronger than the bears. And the trend of rising and diverging should continue.
Today’s trading target remains at 2186-2190. Mainly buy low.
Radical friends can do so at a location near 2177.
Friends who don’t want to take risks can proceed below 2175
Control risk when trading.

Gold made a perfect profit today, continue with the strategic la
There must be some hobby, just like the love of time for plants and trees.
I didn’t feel deeply about it before. As my trading time and age increase, I find this statement more and more wonderful!
This kind of hobby is like finding a place for the soul to live.
Especially every time I focus on the market and make a settlement, every time it runs as expected, it is like eating candy in life. I think this is my meaning, and my soul will eventually have something to rely on.
In terms of gold, in early trading we directly prompted 2370-2 to be short. And after profit reduction, you can hold it in the mid-term and arrange two positions, namely short-term and medium-long term.
Quick retracement of 2350 as expected.
When it continues to be suppressed below 60 in the afternoon, it is necessary to go short directly.
Although there was a slight difference of 1-2 US dollars and we did not enter the market, the market was in line with our expectations.
After the European market retracement, what should be the next plan?
After rising and falling in the early trading, the price continued to weaken in the afternoon. Even in the correction market, it was still weak in the evening.
Weakness and extreme weakness need to be distinguished.
If it is an extremely weak form, the price will definitely retrace without rebounding. But this is not the case currently. Instead, it rebounds first and then retreats.
Therefore, the next strategy can focus on the 57-59 short position, use 63 as the defensive position, break the position to adjust the position, and continue to look at the vicinity of 48-43 below.
If you have started to like my strategies, please let me know

Gold prices will return to highs again. Buy gold nowLast night, the price of gold broke through a new high again, reaching the 2287 line. As expected last night. Then it continued to fluctuate until the European market opened because prices were on the higher side. Gold made a technical repair after the start of the European session. The price of gold plummeted by about $20 from 2287. The current price is 2268.
News: Risk aversion caused by the war in Gaza continues to ferment. Short-term bulls are still strong. gold. Dollar. as a hedging product. They all continue to attack.
Trend: Overall, buying at low prices is still the main trend. It is not difficult to see from the above picture that the short-term repair is only for a day. The general cyclical trend is still upward. From an hourly perspective, the current support position for technical repair is located at the 2259-2264 line. Combined with MA technical indicators, there is a certain pressure for long-short conversion at 2270. Once the 2270 position is established, it will inevitably rebound within the day.
During the day, buying is still the main focus. Today we focus on the impact of the announcement of ADP news. On Friday, we need to focus on the release of (U.S. non-farm payrolls after seasonally adjusted March).
trade:
Gold price is at 2263-2268 to buy
tp2283-2287
SL2254
Pay attention to controlling risks and positions during operation. Stay concerned.

Trade idea for NY looks like gold is ready for a pullback. its making new high from past 4-5 days. Today we have powell speech and ADP-NFP.

Gold price will continue to climb to 2202-2207
Long trading range
Gold remains strong.
28/3 is mainly buying.
2192-2190buy
Tp2202-2207
Sl2183-2186
Related Products: MCX:GOLD1! FXOPEN:XAUUSD VELOCITY:GOLD OANDA:XAUUSD ACTIVTRADES:GOLD TVC:GOLD CAPITALCOM:GOLD NCDEX:GOLD

Shorting gold on rallies, circular operation
Gold briefly rose in early trading and fell back to around 2172. The rebound at 2186 last night has lost its strength. The short-term position of No. 4 and No. 5 is still under pressure (2188 and 2195). The downward support point focuses on around 2165. In the short term, you can go short around 2183.
gold:sell2183-2188
TP:2178-2175
SLl:2195
Gavin welcomes everyone here, I will prove myself, join me, and there will be more and more family members in the future

SILVER's biggest breakout on cards!No doubt, it has took years to complete. Yet could took more in wait!
We shall be seeing the silver to new highs very soon...

advances to near $2,055 as US yields declineHere is what you need to know on Monday, January 15:
• Gold price gains ground on risk-averse sentiment due to the Red Sea situation.
Israel-Gaza conflict intensified after Houthi attacked a US Navy vessel.
• US Treasury yields contribute to downward pressure on the US Dollar.
Barclays revision of the Fed rate cut has changed market sentiment.
Gold prices continue to advance for the third consecutive day on Monday, trading higher and reaching around $2,055 per troy ounce during the Asian session. The upward movement in the price of the yellow metal is attributed to the risk-averse due to the geopolitical tensions in the Middle East, coupled with the speculation regarding potential rate cuts by the Federal Reserve (Fed) in March.
The concerns over the escalation of the Israel-Gaza conflict have intensified, especially after Iran-led Houthis fired an anti-ship cruise missile at the USS Laboon in the Red Sea on Monday. This development has contributed to increased demand for gold prices, a traditional safe-haven asset during times of heightened geopolitical uncertainty. Market participants remain vigilant for potential impacts on shipments in the Strait of Hormuz while closely monitoring Iran's response to recent geopolitical developments.
The US Dollar (USD) hovers around 102.40 with a negative bias, influenced by the decline in US Treasury yields, possibly triggered by the softer Producer Price Index (PPI) data from the United States (US). The DXY has trimmed its intraday gains as a result of the drop in US Treasury yields. The 2-year and 10-year yields on US bond coupons trade lower at 4.14% and 3.94%, respectively, at the moment.
Additionally, Barclays revised its forecast on Friday for the first Federal Reserve rate cut, moving it to March from June. This change in outlook has shifted market sentiment towards expectations of an easing monetary policy by the Fed, putting downward pressure on the Greenback. In a note released on Friday, analysts from Barclays expressed their expectation for the Federal Open Market Committee (FOMC) to reduce the Fed Funds rate by 25 basis points at the March meeting.

Inverted H&S pattern | Bulls in the marketDaily time frame has swing breakout and Inverted H&S pattern as well.
the Inverted H&S pattern has 1:1.69 as risk reward ratio.

Gold Break Down : Hitting 7 Month Low. Crucial Support zoneGOLD(US$/Oz) stands at a 7 month low ever since March 2023. The precious metals commodity is standing at a crucial support levels of the channel ever since April 2023.
Although the charts shows momentum bottoming but the supply constraints and Macro factors may pull it down to levels of 1833,1806 post which we can see it pulling back to channel Trendlines again. The worst case scenario is still open for 1784 but for now that looks a less probabilistic from technical point of view.

Go long gold now!After last week’s sharp rise, gold temporarily stagnated at the 1963 high. On Friday, the small negative line retraces and corrects. The week’s closing work has not further risen to break new highs. The overall rise has come out of the high volatility after the surge, and there is room for retracement It is not enough to change the bullish structure for the time being, but the continuous exploration of highs without breaking the highs also exacerbates the risk of short-term corrections
Last Friday emphasized that gold fell back in 1950, and the layout was bullish. It was close to the 1963 high point. The position of 1963 has also been reminded many times. Once again, we tried to see 1963 fall under pressure, and we firmly grasped this opportunity
Technically, after the sharp rise at the beginning of last week, gold fell back under pressure at the end of the week in 1963. Up to now, it has continued to run sideways at a high level. During the week, gold temporarily remained below 1963 to see high volatility. It is difficult to get out if the high point of 1963 is not broken. There is room for a big rise. On the contrary, it is more likely to increase the pullback after a high level of stagflation. Last Friday’s drop at the low point of 1950 is the first support, followed by the 1940 mark. Structurally, it may follow the confirmation of the back step and then rise. The key point is The stabilizing support point of stepping back can be decided before the market is combined with the K-line shape of the hourly chart. The support point of the retracement can be deep or shallow, and the weaker retracement should pay attention to the 1940 mark before stabilizing, and arrange the entry point of multiple orders in combination with the pattern retracement in the operation.
In terms of intraday operations, the support point for last Friday's fall was at 1950. For the time being, this point has not been broken, and it also has a certain supporting effect. In case of being short-lived, it is recommended that gold be around 1950 once more, and the target is above 1960; There are many market adjustments in the 1940 area, the loss is 1933, and the target is 15-20 US dollars; the empty order strategy revolves around the participation of light positions below 1963, and it is enough to strictly break the new high and stop the loss to leave the market.
If you don't know how to trade accurately, then contact me and I will give you accurate advice!
