Gold Rebounds Slightly After Dropping to 3295📊 Market Update:
Gold bounced back to 3320 after dipping to 3295 amid USD strength and rising bond yields. The recovery was fueled by short-covering, but traders remain cautious ahead of upcoming U.S. PCE data – the Fed’s preferred inflation gauge.
📉 Technical Analysis:
• Key Resistance: 3330
• Nearest Support: 3295
• EMA: Price is hovering near the 09 EMA on the H1 chart → neutral to slightly bullish in short-term correction.
• Candle / Volume / Momentum: H1 candles show mild recovery with increased volume, but no clear reversal signal yet.
📌 Outlook:
Gold may range between 3295 and 3330 before a breakout, depending on incoming U.S. economic data. A break above 3330 could trigger a short-term rally.
Goldminers

Will the gold bearish trend continue?
💡Message Strategy
The gold market is facing a complex game of long and short factors in the near future. On the one hand, US President Trump announced that Iran and Israel had reached a "comprehensive ceasefire", and the market's risk aversion demand plummeted, and gold was under obvious short-term pressure. However, according to Reuters, Israel still has small-scale military operations, which has led to differences in the market's optimism about the situation in the Middle East, and the downward space of gold is temporarily limited.
On the other hand, US economic data is mixed. In June, the S&P global manufacturing PMI remained unchanged at 52, the service industry PMI fell slightly to 53.1, and the composite PMI fell slightly to 52.8, suggesting that the momentum of economic expansion has slowed down marginally. More importantly, Fed officials have released dovish signals one after another. Fed Governor Bowman expressed concern about labor market risks and supported interest rate cuts this year, echoing Governor Waller's expectations of a rate cut in July. This adjustment in monetary policy expectations has led to a weakening of the US dollar, providing some support for gold prices.
📊Technical aspects
1. Pay attention to the defensive position at the weekly level. As time goes by, this position is now in the 3316-3315 area. After breaking 3333 at noon, it accelerated to reach here, so pay attention to the gains and losses here in the future, so as to prepare for the next space switch
2. The daily line has been defending the lifeline for nearly a month. The current lifeline position is 3355. No matter how it pierces in the previous process, the final closing line must return to the top of the lifeline, thus becoming a support area
This means that today's closing is very critical. It can be closed below the lifeline, and then switch space downward to enter the area from the lifeline to the lower track 3355-3280
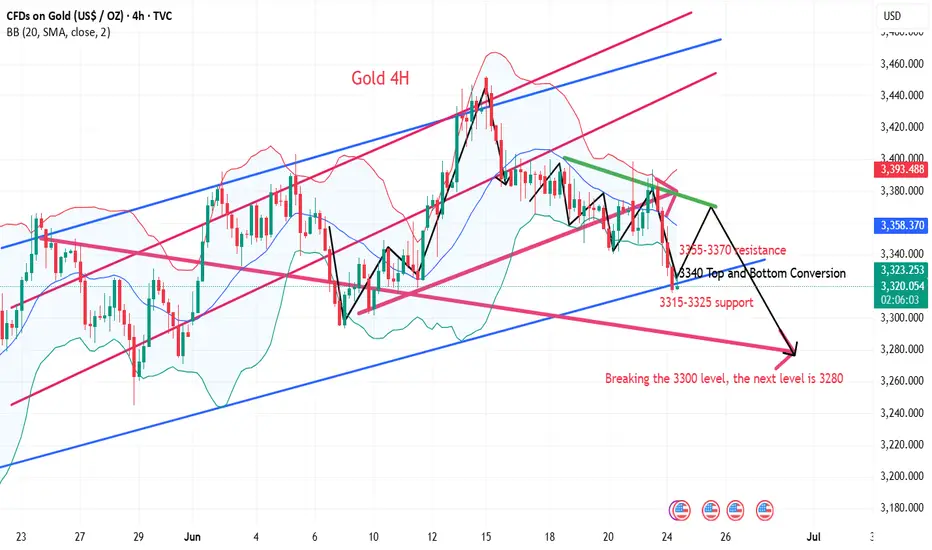
3. The four-hour pattern opens downward. Yesterday, the resistance of the upper track of the pattern was determined twice, and then it began to fall continuously, fell back to the lifeline, and then fell below the lower track of the pattern. Now it is further down and breaking the low
Then, keeping high is the key, breaking low is the focus. The previous starting and falling acceleration points are 3357 area, 3370, and finally 3388-3390.
Today's high point is 3370 area. The resistance range of 3357 is determined at noon. The pattern opens downward. Keep high and break low to see acceleration. After breaking the high point, it returns to sweeping.
4. The double lines of the hourly chart are glued together to form a pressure area. The interval of 3355-3370 just coincides with the two resistances above. Use this as suppression to switch space downward.
5. The large channel cooperates with the small channel. The price falls below the lower track position of the large channel and begins to switch space further downward. The top and bottom conversion position is 3340, and the final acceleration starting point is 3348.
Use this as suppression, and look down to the weekly defense line area of 3316-3315.
If it falls below, the next support will focus on the 3300 mark. If it breaks 3300 again, the next position is 3280
💰Strategy Package
Short Position:3348-3354,SL:3375,Target: 3300-3310
Long Position:3280-3290,SL:3260,Target: 3340
Bearish Continuation Pattern Detected on GOLD/USD Bearish Continuation Pattern Detected on GOLD/USD 📉
📊 Chart Analysis Summary:
The GOLD/USD chart shows a clear bearish continuation pattern, following a rejection from a major resistance zone.
🔍 Key Technical Highlights:
🔺 Resistance Zone:
Strong resistance at 3,420 – 3,440 USD, marked by multiple rejections (🔴 red arrows).
Price formed a Bearish Harmonic Pattern (likely a Gartley or Bat), suggesting reversal from this resistance.
🔻 Bearish Momentum:
After the pattern completed, price broke below the minor support structure and is currently forming lower highs and lower lows, indicating bearish structure.
📉 Support Level:
Strong horizontal support zone around 3,298 – 3,300 USD, marked as “TARGET.”
This area was previously tested (🟠 orange circles) and now projected to act as a target level again.
🔄 Minor Retracement Zone:
Expecting a minor pullback to 3,347 USD (purple line) before potential continuation downward.
This zone aligns with the previous support turned resistance (classic SR flip).
🎯 Target Projection:
Based on the bearish impulse and measured move, the projected target is around 3,298.758 USD, which coincides with the previous support zone.
📌 Conclusion:
The price action suggests a high-probability bearish continuation, targeting the 3,298 USD zone unless the price breaks and holds above 3,347 USD. Traders may consider selling on rallies with a confirmation of rejection at resistance.
📉 Bias: Bearish
📍 Invalidation: Break and daily close above 3,347 USD
📉
📊 Chart Analysis Summary:
The GOLD/USD chart shows a clear bearish continuation pattern, following a rejection from a major resistance zone.
🔍 Key Technical Highlights:
🔺 Resistance Zone:
Strong resistance at 3,420 – 3,440 USD, marked by multiple rejections (🔴 red arrows).
Price formed a Bearish Harmonic Pattern (likely a Gartley or Bat), suggesting reversal from this resistance.
🔻 Bearish Momentum:
After the pattern completed, price broke below the minor support structure and is currently forming lower highs and lower lows, indicating bearish structure.
📉 Support Level:
Strong horizontal support zone around 3,298 – 3,300 USD, marked as “TARGET.”
This area was previously tested (🟠 orange circles) and now projected to act as a target level again.
🔄 Minor Retracement Zone:
Expecting a minor pullback to 3,347 USD (purple line) before potential continuation downward.
This zone aligns with the previous support turned resistance (classic SR flip).
🎯 Target Projection:
Based on the bearish impulse and measured move, the projected target is around 3,298.758 USD, which coincides with the previous support zone.
📌 Conclusion:
The price action suggests a high-probability bearish continuation, targeting the 3,298 USD zone unless the price breaks and holds above 3,347 USD. Traders may consider selling on rallies with a confirmation of rejection at resistance.
📉 Bias: Bearish
📍 Invalidation: Break and daily close above 3,347 USD

Is World War III not far away?
The market has always been a zero-sum game between longs and shorts. No matter how successful you are in other aspects, in the market, winning and losing are the only criteria. Recently, many traders have been asking what to do if gold and crude oil lose money? How to recover the losses? In fact, it is normal to have such concerns. After all, as long as it is an investment, there will be risks. And facing this risk of loss, most traders will be panicked, so here I am your beacon in the endless darkness!
The ultimate question of the conflict: Is war inevitable?
The key variable of the current situation lies in Iran’s way of retaliation: will it choose a small-scale attack on the US military base to shock the tiger, or will it go all out to block the Strait of Hormuz? The US military deployment also reveals subtle signals: the "Ford" aircraft carrier battle group has entered the Arabian Sea, and the B-52 bomber has entered the Al Udeid base in Qatar. This "force deterrence + limited strike" strategy seems to avoid a full-scale war with Iran while trying to curb its nuclear program.
However, history has repeatedly proved that the "powder keg" in the Middle East is never short of sparks - a gunshot in Sarajevo in 1914 triggered World War I, and a bottle of laundry detergent became an excuse for the Iraq War in 2003. Today, when news of US fighter jets bombing Iranian nuclear facilities comes out, and when Iran lists US citizens as targets, the direction of this conflict has gone beyond the "controllable range".
For ordinary investors, whether war breaks out or not, the value of gold as crisis insurance has been redefined, and every alarm in the Middle East may become a charge for gold prices to rebound.
Interpretation of gold trend in European session
Gold trend surged at the opening, but failed to break through the watershed line of 3405 expected at the weekend. At present, the support of risk aversion conflict failed to break through the key resistance level. The short-term trend is still the same as last week's analysis. It is still weak and bearish. The stimulus of news can only have a certain impact on short-term operations, and will not change the trend. At present, we have been insisting on seeing a break and fall last week, but it has not come yet. The first test position this week is still the small double bottom of 3340!
Gold continues to retreat on the hourly line. Under the current situation where the short-selling momentum continues to exert force, first see whether the double bottom support of 3340 is effective. If the early retreat is in place and fails to break through, it can be seen that the support is short-term rebound upward. The second decline point of 3372-75 is seen above. Unless the United States makes trouble again, it is still possible to arrange short orders!
Gold: Retracement to 3338-40, defense at 30, target at 3365-70! Short at 3372-75 when it pulls back, defend at 3380, target at 3345-40!

Let’s talk about gold’s movement
This week, the fundamentals are relatively relaxed. The two sides of the Middle East war continue to fight each other. The market is relatively tired, resulting in the relative weakness of gold, silver and oil. From the technical perspective, the gold price continues to fluctuate and fall. After falling to the bottom, it rebounds rapidly. The overall bulls are strong again. Let's briefly sort it out:
1: Fundamentals: Market aesthetic fatigue leads to continuous adjustment of gold, silver and oil;
2: Technical aspect, the fundamentals are relatively weak, resulting in the technical adjustment of "up and down puncture" to wash the plate!
To sum up: This week's trend is very difficult to operate; long, the fundamentals are weak; short, the overall risk aversion has not disappeared; therefore, there is a trend of constantly piercing the lows, and then constantly pulling up; the overall trend is a decline of three and a rise of two!
The current overall environment:
1: Fundamentals:
The first stage: The Middle East war is still going on, the two sides continue to fight each other, and their attitudes are strong; the opposing forces of the camps are obvious; the impact is far-reaching! The first stage is a continuous confrontation; risk aversion is born, assisting the strong rise of gold, silver and oil; we are still in the first stage!
The second stage: the opposing camp forces gradually exit; for example, the United States decides whether to exit within 2 weeks, which is actually waiting for the intensity of Iran and Israel's next move. The United States exits and the war expands; the United States and the West exit indirectly, and the Middle East war becomes protracted. Refer to the Russian-Ukrainian war. The United States and the West continue to wait and see, then the Middle East war will form a multi-to-one situation, which is relatively unlikely. Israel is a "nail household" placed in the Middle East by the United States and the West. The United States and the West will not sit idly by and watch Israel being completely defeated.
The third stage: the end of the war; this stage is far away; refer to the current Russian-Ukrainian war; once the war starts, it will not end easily, whether it is an agent, the forces behind the camp, or the forces of a third party, without the final benefits in hand , will not end the war, such as the chaebols that support it, the military and industrial enterprises that support it, the political ladder strategic goals that support it, etc.
To sum up: we are currently in the first stage of the war, and the subsequent second stage is the core stage of the market, so we have to be careful about risk aversion repeatedly, and be careful about risk aversion rekindling, so that the bulls can "stir up a thousand waves again, but at this stage, the market continues to pierce and wash the market, which makes us very uncomfortable! We can only choose to follow the trend, and then choose different support levels, and deal with it mainly in line with the trend
This week's trading ideas: First, they are all trend-following ideas, and second: they are all support points, but they are not very smooth, and the uninterrupted piercing, stopping the decline, and pulling sharply are all uncomfortable
Next week's market outlook:
1. Weekly K, it is still a time-for-space mode, the price is resistant to falling, the indicator is corrected, here 3500 is definitely not a high point in the future; but it still takes time to promote the continuous upward attack of weekly K! Therefore, from a long-term perspective, I still suggest that gold is mainly bullish;
2. Daily K, the stochastic indicator continues to be near the central axis, forming a bottoming out and rebounding; the indicator is in a dead cross, the price is resistant to falling, and the market is washed here, washing "the sky is hanging and the earth is dizzy"; at the same time, in terms of form, it continues to fluctuate and rise. After multiple rises, the probability of subsequent breakouts is relatively high;
3. 4 hours, the stochastic indicator is golden cross, the form is bottoming out and rebounding, and it is also an uninterrupted decline and piercing, and then a sharp rise; the high-level one-word interval of 4 hours is integrated It is a relay sideways signal; the follow-up means the continuation of the trend;
To sum up: technically, the daily K-line is sideways and resistant to falling, and the weekly K-line is sideways and resistant to falling. The subsequent multiple upward tests on the technical side will gradually form a break; fundamentally, the subsequent second stage has not yet arrived completely, and the attitude of the United States in the next two weeks will also determine the direction of the second stage of the war
I suggest that the idea is to maintain the trend of low-multiple ideas. In terms of position, refer to the support and choose the uninterrupted layout of the support position; wash-out response: do a good job of risk control, wash-out is also helpless; short-term: try to avoid it as much as possible. Without a fundamental change, don't over-lay out short-term. Trend: combining fundamentals and technical aspects, the subsequent breakout of 3500 and the probability of setting a new high are relatively high

GOLD/USD Falling Wedge Breakout PotentialChart Analysis:
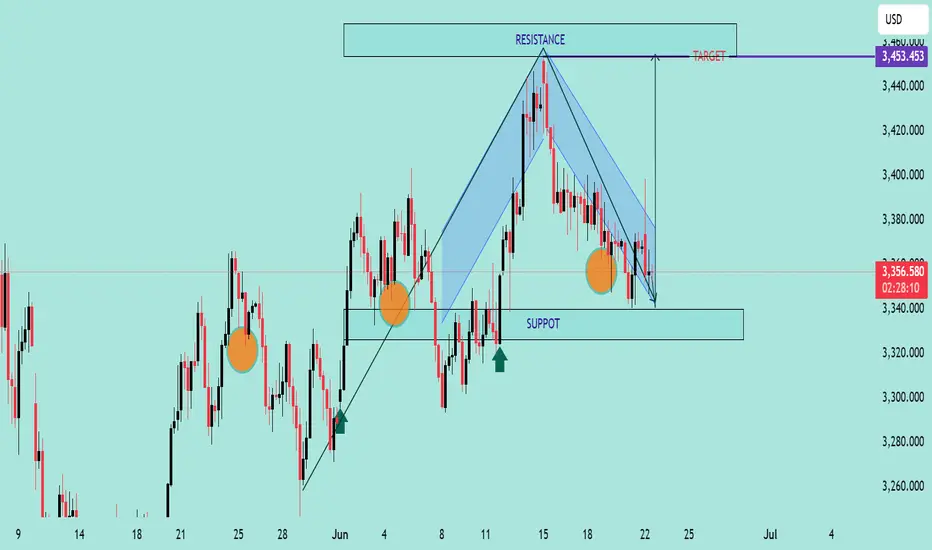
The chart illustrates a Falling Wedge Pattern, a bullish reversal setup typically signaling a breakout to the upside.
📌 Key Observations:
📉 Downward Channel: Price has been compressing within a falling wedge (highlighted in blue), indicating potential exhaustion of sellers.
💪 Support Zone: Strong support observed near the 3,340 level, with price rejecting this zone multiple times (highlighted with orange circles).
🔼 Bullish Signals: Price recently tested the lower wedge boundary and bounced, suggesting potential reversal.
🎯 Breakout Target: Projected target after breakout is around 3,453.453 USD, aligned with previous resistance zone.
🟢 Buy Pressure Arrows: Green arrows signal previous bullish reactions from similar demand zones.
📈 Conclusion:
If price breaks above the wedge’s upper boundary with volume confirmation, a bullish rally toward 3,453 is expected. Keep an eye on breakout retest for entry validation.
✅ Trading Plan Suggestion:
Entry: On breakout above wedge resistance
SL: Below recent swing low (~3,330)
TP: 3,453 zone 🎯
🔔 Note: Wait for a confirmed breakout before entering to avoid false signals.
The rebound is weak, is it expected to continue to decline? 📰 Impact of news:
1. Geopolitical situation
2. Pay attention to the impact of short-term trends of the US dollar and silver on gold
📈 Market analysis:
The weekly level large range sweep is still going on, with a focus on the space defense dividing line area of the 10-day moving average and the 3315-3310 area. After falling back to the lifeline in four hours, it continued to bend downward under pressure. During the sweeping decline, the suppression became more obvious. Whether there will be a wave of large-volume market, the pattern is expected to further open and guide the direction. In this process, note that the lifeline 3375 is also the resistance point determined by the last rebound last night. Use this as suppression to sweep the range below. On the whole, for the future gold, if it can maintain the rhythm of defending highs and breaking lows, and successfully closes at a low level today, then next week it is expected to further switch downwards to sweep space. Therefore, we will continue to focus on two support areas, one is 3345-3335, and the other is 3315-3310 after breaking
🏅 Trading strategies:
BUY 3345-3335
TP 3355-3365
SELL 3365-3375
TP 3345-3335-3315
If you agree with this view, or have a better idea, please leave a message in the comment area. I look forward to hearing different voices.
TVC:GOLD FXOPEN:XAUUSD FOREXCOM:XAUUSD FX:XAUUSD OANDA:XAUUSD

When will the price of gold fall?Market news:
In the early Asian session on Friday (June 20), spot gold fell narrowly and is currently trading around $3,360 per ounce. London gold prices fluctuated violently under the dual influence of the Fed's hawkish stance and geopolitical tensions. Powell's hawkish stance cooled the market's expectations for interest rate cuts. As a non-yielding asset, international gold is under obvious pressure under high interest rate expectations. In sharp contrast to the Fed's hawkish stance, geopolitical tensions have provided important safe-haven support for international gold prices. The escalation of the Israeli-Iranian conflict has not only exacerbated tensions in the Middle East, but also triggered market concerns about the global security environment. As a traditional safe-haven asset, gold is often sought after when geopolitical risks rise. In the short term, the continued escalation of the conflict between Israel and Iran may continue to drive safe-haven funds into the gold market, but the direction of the Fed's monetary policy and the specific implementation of the Trump administration's tariff policy will have a key impact on the medium- and long-term trend of gold prices.
Technical Review :
Gold maintained a volatile closing. The daily chart closed with alternating buying and selling for four consecutive trading days. There was no trend continuation. We will continue to pay attention to the 3350/3390 range during the day. Today's trading ideas are still short-term, selling at high prices and buying at low prices to participate in the volatile trend.So far this week, gold has been difficult to break out of the continuity of buying and selling. Yesterday, Thursday, under the temporary performance of gold's short-term dollar trend, we are optimistic that gold will fluctuate in the range, with the maximum range at 3350/3400, but there may often be a breakout on Thursday. Therefore, today we should pay attention to both trading within the range and the strength after the breakout.
Today's analysis:
Gold fluctuated overall yesterday due to the early closure of the US market, and the fluctuation was not large. However, gold as a whole is still biased towards selling. Gold is now weak in buying and rebounding, so there is a lot of room for gold selling. Next, we will continue to sell gold. If there is no particularly large profit to support gold, then gold buying may not cause any big waves in the short term. Gold 1-hour moving average continues to cross and sell downward. Gold selling is strong and there is still room for downward movement. After gold fell yesterday, the highest rebound was around 3378, and then it continued to fall back. After rebounding several times, it did not break through 3378 again. Gold continued to sell at high prices under pressure at 3378. Gold is now fluctuating and falling, and the center of gravity is constantly moving downward. With this trend, gold may accelerate downward at any time.
Operation ideas:
Short-term gold 3335-3338 buy, stop loss 3328, target 3370-3380;
Short-term gold 3360-3370 short, stop loss 3387, target 3330-3340;
Key points:
First support level: 3352, second support level: 3344, third support level: 3331
First resistance level: 3378, second resistance level: 3388, third resistance level: 3400

XAU/USD(20250620) Today's AnalysisMarket news:
The Bank of England kept interest rates unchanged at 4.25%, and the voting ratio showed that internal differences were increasing. Traders expect the bank to cut interest rates by another 50 basis points this year.
Technical analysis:
Today's buying and selling boundaries:
3369
Support and resistance levels:
3409
3494
3384
3353
3344
3329
Trading strategy:
If the price breaks through 3369, consider buying, and the first target price is 3384
If the price breaks through 3353, consider selling, and the first target price is 3344

Gold-----sell near 3393, target 3380-3366Gold market analysis:
Yesterday, gold was basically a repeated shock, the K line was repaired at one position, and buying and selling were back and forth around the M side of the suppression platform 3405. Yesterday, our analysis was completely in line with our expectations. Yesterday, we also repeatedly arranged 5 sell orders, arranging 3382 break sell, 3387 sell, 3393 sell, 3382 sell, 3377 sell. Today's idea is to continue selling. The daily line cannot determine the bottom of this wave of decline. There are data in European and American time today. I think we can rely on the 3405 platform to be bearish before the data. If 3405 breaks, we adjust our thinking to be bullish. Otherwise, we can sell repeatedly. Gold is oscillating in the short term. Try not to chase it and wait for it to rebound and suppress the position to sell. In addition, the daily moving average suppression position of the moving average is 3396-3363, which is also the main reason for its repeated game at this position. The weekly buying momentum is not dead yet. Be cautious of its rocket in the second half of the week.
In today's Asian session, we will first focus on the suppression of 3395. The risk of taking more is relatively large. The low point below is not stable. The Asian session fell to 3370 and rebounded quickly. From the perspective of the pattern, 3372-3366 is the support. The suppression position of the 1H hourly moving average is near 3395. Yesterday's US session rebounded at around 3396, and the hourly K suppression position was 3400. All the above are suppressed. In addition, the opening position today is also near 3393.
Pressure 3393, 3400, 3405, support 3382, 3370, and the watershed of strength and weakness in the market is 3382.
Fundamental analysis:
In the previous fundamentals, we have been paying attention to geopolitical factors. The situation in the Middle East has indeed changed the way gold and crude oil are traded. Today we focus on the monetary policy of the Federal Reserve, and there is also a speech by Chairman Powell during the US session.
Operation suggestions:
Gold-----sell near 3393, target 3380-3366

GOLD/USD Support Retest & Breakdown SetupGOLD/USD Support Retest & Breakdown Setup 📉🔍
🔹 Overview:
The chart indicates a potential bearish continuation pattern on GOLD/USD as the price is approaching a key support level at 3,335.305. Previous price action shows multiple rejections from the resistance zone (~3,435), followed by lower highs – a sign of weakening bullish momentum.
📊 Technical Analysis:
🔺 Resistance Zone (~3,435)
Multiple rejections (🔴 red arrows) indicate strong supply pressure.
Price has failed to break above this area thrice, forming a clear ceiling.
🔻 Support Zone (~3,335)
Marked as the target for a short setup.
Price is testing this level again after forming a minor consolidation below lower highs.
A clean break below this purple zone may trigger a continuation to the downside, targeting the broader support range below (~3,240).
🟠 Bearish Structure:
Series of lower highs (highlighted with circles).
Breakdown pattern is developing with declining bullish momentum.
📈 Potential Play:
A confirmed breakdown below 3,335 could lead to a drop toward the next major support.
If support holds, short-term bounce is possible but limited by the dominant resistance.
📌 Conclusion:
GOLD/USD is currently in a bearish setup, with the market eyeing a potential breakdown below a critical support zone. If this level fails to hold, we could see accelerated bearish momentum toward the lower support range.
💡 Caution: Wait for a confirmed close below support before entering any short trades.

XAU/USD) Back support level Read The captionSMC trading point update
Technical analysis of XAU/USD (Gold Spot vs U.S. Dollar) – 2H Timeframe:
---
XAU/USD Bearish Rejection from Resistance – Short-Term Sell Setup
Key Observations:
1. Rejection from Upper Channel & Resistance Zone:
Price was rejected sharply after touching the upper boundary of the ascending channel and the newly established resistance zone (~3400–3420).
A strong bearish candle confirms selling pressure at the top.
2. Support Retest in Progress:
The price is currently descending toward the EMA 200 and the KYY support zone (approximately 3343–3348).
The previous bounce originated from this level, making it a significant retest zone.
3. EMA 200 as Confluence:
The 200 EMA (currently at 3346.92) aligns with the support zone, increasing the likelihood of a bounce or at least temporary pause in bearish momentum.
4. RSI Bearish Signal:
RSI has dropped below 50, confirming a momentum shift toward the downside.
Still above oversold territory, suggesting more downside room.
---
Trade Idea:
Bias: Bearish (Short-Term)
Entry Zone: Around 3390–3400 (confirmed rejection area)
Target Zone: 3348 – 3343 (KYY support + EMA 200)
Stop Loss: Above 3425 (just above resistance zone)
Mr SMC Trading point
---
Summary:
Gold has faced a clear rejection at a key resistance zone within an ascending channel, and is now targeting the EMA 200 and previous structural support. Short opportunities could be considered toward the 3343–3348 zone, with RSI and price action supporting the move.
Please support boost 🚀 this analysis)

GOLD/USD Bearish Rejection at ResistanceGOLD/USD Bearish Rejection at Resistance 📉🟥
🔍 Technical Analysis Overview:
The GOLD/USD chart shows a clear bearish rejection pattern forming near the resistance zone around $3,450, marked with red arrows. After price tested this level twice, strong selling pressure appeared, resulting in a sharp decline.
📌 Key Observations:
🔴 Resistance Zone:
Price was rejected from the resistance area around $3,450 twice, indicating strong seller presence.
Double top-like behavior seen with lower highs confirming weakening bullish momentum.
🟠 Support Zone:
A well-respected support level near $3,250 has been identified based on past reaction (highlighted with orange circles).
Price previously bounced twice from this zone, validating it as a strong support level.
🎯 Target Level:
A near-term target of $3,305.586 is marked, which aligns with previous reaction zones and short-term structure support.
If momentum continues, a deeper push toward $3,250 support is probable.
📉 Bearish Bias Justified By:
Clear rejection from resistance
Lower high formation
Current consolidation with downward bias
Possible breakout to downside if $3,305 fails to hold
⚠️ Risk Note:
If price retraces and breaks back above $3,400 with volume, the bearish setup will be invalidated.
📊 Conclusion:
The chart favors bearish continuation with a primary target around $3,305, and extended downside to $3,250 if bearish pressure sustains. Traders should watch for bearish confirmation patterns below current price before engaging.
🔽 Resistance: $3,450
🔼 Support: $3,250
🎯 Target: $3,305

Gold Miners Stocks Go 'The Rife Game' in Town. Here's WhyGold mining stocks have emerged as one of the top-performing asset classes in 2025, driven by a combination of surging gold prices, improved profitability, and shifting investor sentiment.
Here’s fundamental and technical analysis of the key factors behind this outperformance, by our @PandorraResearch Super-Duper Beloved Team :
Record-High Gold Prices Fuel Margins
Gold prices surpassed $3,000 per ounce in March 2025 for the first time in history, marking a 14% year-to-date increase. This rally stems from:
Safe-haven demand amid geopolitical tensions, economic and political uncertainty including U.S. trade policy volatility.
Central bank buying , particularly by China, India, Turkey, and Poland, to diversify away from the U.S. dollar.
Anticipated interest rate cuts , which reduce the opportunity cost of holding non-yielding assets like gold.
Higher gold prices directly boost miners’ revenues.
For example, the NYSE Arca Gold Miners Index NYSE:GDM returned nearly 30% YTD by early March, outpacing both physical gold OANDA:XAUUSD (+14.5%) and the S&P 500 SP:SPX (-3.8%). Companies like Agnico Eagle Mines NYSE:AEM and Wheaton Precious Metals NYSE:WPM reached all-time highs, while ASX-listed miners such as Evolution Mining ASX:EVN (+39.5% YTD) and West African Resources ASX:WAF (+56.6% YTD) outperformed Australia’s broader market.
Margin Expansion and Shareholder Returns
Gold miners are leveraging rising prices to improve profitability:
Stabilized costs for labor, energy, and equipment have widened profit margins.
Free cash flow growth enabled dividend hikes and share buybacks. U.S. Global Investors, for instance, offers a 3.91% annualized dividend yield.
Undervalued stocks: Many miners traded at historically low valuations relative to gold prices, creating buying opportunities. Barrick Gold NYSE:GOLD (P/E 15.6) and Newmont Corp NYSE:NEM (P/E 15.5) remained attractively priced despite gains.
Royal Gold NASDAQ:RGLD , a streaming company with a 60.3% operating margin, exemplifies how non-traditional miners capitalize on gold’s rally without direct operational risks.
Sector-Specific Catalysts
Mergers and acquisitions. Consolidation activity has increased, with larger firms acquiring high-potential projects.
Copper exposure. Miners like Evolution Mining benefit from rising copper demand, diversifying revenue streams.
Institutional upgrades. Analysts at Macquarie and Morgan Stanley endorsed Newmont and Evolution Mining, citing currency tailwinds and free cash flow potential.
Macroeconomic and Market Dynamics
Dollar weakness. A declining U.S. dollar enhances gold’s appeal as a hedge.
Equity market volatility. With the S&P 500 struggling, investors rotated into gold equities for diversification (0.3 correlation to broader markets).
Fiscal deficits. U.S. budget imbalances and inflationary pressures reinforced gold’s role as a store of value.
Outlook for 2025
Analysts project further gains, with gold potentially reaching $3,300 per ounce. Miners are expected to sustain momentum through:
Operational efficiency improvements to align with higher gold prices.
Continued capital discipline , avoiding overinvestment in new projects.
Dividend growth , as seen with U.S. Global Investors’ monthly payouts.
Technical Outlook
The main technical graph for Gold Miners ETF AMEX:GDX indicates on further Long-Term Bullish opportunity, to double the price over next several years, in a case of the epic $45 mark breakthrough.
Conclusion
In summary, gold miners’ 2025 rally reflects a confluence of macroeconomic uncertainty, disciplined capital management, and gold’s structural demand drivers. While risks like cost inflation persist, the sector’s fundamentals and valuation upside position it as a compelling component of diversified portfolios.
--
Best 'Golden Rife' wishes,
@PandorraResearch Team 😎

GOLD/USD Bearish Rejection at Resistance ZoneGOLD/USD Bearish Rejection at Resistance Zone 📉🟥
📊 Technical Overview:
The chart for GOLD/USD shows a clear price action behavior between a well-defined resistance zone (~3,480–3,510) and a support zone (~3,260–3,280).
🔻 Bearish Signals:
The price has tested the resistance zone multiple times (highlighted with red arrows and orange circles) but failed to break above it, indicating strong selling pressure.
The current price action suggests another lower high formation, which is a bearish signal 📉.
Recent candles are rejecting the upward move, pointing to potential downside movement.
🟩 Support Confirmation:
Previous reactions from the support zone (green arrows) show that buyers have consistently stepped in near the 3,260–3,280 range.
This level remains a key demand zone where a bounce might be expected.
🔁 Outlook:
If the price continues to reject the resistance and follows the pattern, we might see another drop towards the support area.
A break below the support zone would confirm a bearish breakout and could open the door to deeper downside targets.
📌 Conclusion:
GOLD/USD is trading within a range, but the repeated failures at resistance suggest bearish momentum might take control in the short term. A move back toward the support zone is likely unless a breakout above resistance occurs.
📉 Resistance: 3,480–3,510
🟩 Support: 3,260–3,280
🔍 Bias: Short-term Bearish unless resistance breaks

Newmont Corp | NEM | Long at $48.00While gold prices have soared recently, gold mining stocks have lagged. Newmont Corp NYSE:NEM , the world's largest gold mining corporation, may be undervalued if the miners take off to catch up to the gold demand/price. Currently sitting near $48.00 and at a historical moving average that it will need to break to show a true trend reversal, NYSE:NEM is in a personal buy zone. Now, the price may break down at the simple moving average and test the patience of shareholders, but the long game may benefit those who can tolerate the volatility.
Target #1 = $57.00
Target #2 = $71.00

GOLD/USD – Bullish Reversal Pattern FormingGOLD/USD – Bullish Reversal Pattern Forming 🟢📈
📊 Chart Analysis:
The chart shows a strong Inverse Head and Shoulders pattern forming, which is a classic bullish reversal signal:
🔹 Left Shoulder and Right Shoulder – Marked with orange circles, both found support near the 3,263 level (purple line), suggesting strong buying interest at this zone.
🔹 Head – The lowest point in between the shoulders, also bouncing from support.
🔹 Resistance Zone – Marked with red arrows around 3,500–3,520. This zone has rejected price action multiple times in the past.
🔹 Support Zone – Marked below 3,200, where previous consolidation and buying took place.
📈 Projected Move:
The neckline breakout suggests a potential move toward the 3,520+ level. A minor pullback is expected before continuation. If price breaks above resistance, we could see a strong bullish rally.
📌 Key Levels:
Support: 3,263 🟩
Resistance: 3,500–3,520 🟥
Potential Target After Breakout: 3,550+ 🎯
✅ Bias: Bullish above 3,263 support
⚠️ Invalidation: A break below the neckline would cancel the bullish setup

XUA/USD) Bullish trand support level Read The captionSMC trading point update
Technical analysis of (XAU/USD) on the 30-minute timeframe, incorporating a support zone and trendline confluence strategy. Here's a breakdown
---
Analysis Summary
Key Technical Elements:
1. Uptrend Channel:
Price is trading within a rising channel.
Higher highs and higher lows indicate bullish momentum.
2. Support Zones:
Key Support Level (near 3,400): A horizontal support zone has been marked where price previously bounced (confirmed by green arrows).
Trendline Support: This upward sloping trendline adds confluence to the horizontal support zone.
3. EMA 200 (3,377.96):
Acts as a dynamic support level.
Price is well above the EMA, supporting bullish sentiment.
4. Projected Price Move:
The chart anticipates a dip back to the support area (~3,400), followed by a bullish bounce.
Target is clearly defined at 3,504.01, with a measured move of about +103.36 points from the support.
5. RSI Indicator:
RSI is around 57, which is neutral to slightly bullish.
No overbought/oversold signal yet – supporting potential for more upside.
---
Bullish Bias Reasoning:
Confluence Zone: Horizontal + trendline + EMA 200.
Healthy Price Structure: Higher lows being maintained.
Momentum Indicator (RSI) supports continuation.
---
Risks / Considerations:
If price breaks below the confluence support (~3,400), bullish invalidation may occur.
Monitor for false breakouts or heavy selling pressure near resistance.
Mr SMC Trading point
---
Trading Plan
Buy Zone: Around 3,400 (support confluence).
SL: Below the trendline/EMA – e.g., 3,370 or lower.
TP: Around 3,504 (target zone marked).
Please support boost this analysis)

GOLD PRICE ACTION ANALYSIS – June 11, 2025 GOLD PRICE ACTION ANALYSIS – June 11, 2025 🟡
Technical Breakdown & Bearish Scenario Ahead ⚠️📉
🔍 Overview:
The chart presents a clear range-bound structure with strong horizontal resistance around the $3,400–$3,420 zone and support around the $3,120–$3,160 level. Price is currently trading near the upper range of the consolidation.
📊 Key Technical Levels:
🔴 Resistance Zone: $3,400 – $3,420
➤ Price has been rejected here multiple times (highlighted by red arrows and orange circles), showing strong supply pressure.
🟣 Intermediate Support: $3,260.618
➤ This level acted as a minor support and could be tested again if the current pullback deepens.
🟤 Major Support Zone: $3,120 – $3,160
➤ A key demand area where price previously bounced significantly.
📉 Bearish Setup:
A potential lower high is forming just below the resistance zone.
The projected path suggests a minor pullback to form a bearish retest, followed by a potential breakdown below $3,260.
If the $3,260 support is broken decisively, further downside toward the $3,120–$3,160 support is likely (blue arrow projection).
🔄 Bullish Scenario (Invalidation):
A breakout and strong close above $3,420 could invalidate the bearish structure.
In that case, price might attempt to target higher resistance levels beyond $3,440.
📌 Conclusion:
Gold remains in a range with a bearish bias unless the $3,420 resistance is breached.
🔽 Watch for confirmation below $3,260 for bearish continuation.
✅ For bulls, wait for a strong breakout above resistance with volume.

Gold is under pressure and bearish outlook remains unchanged
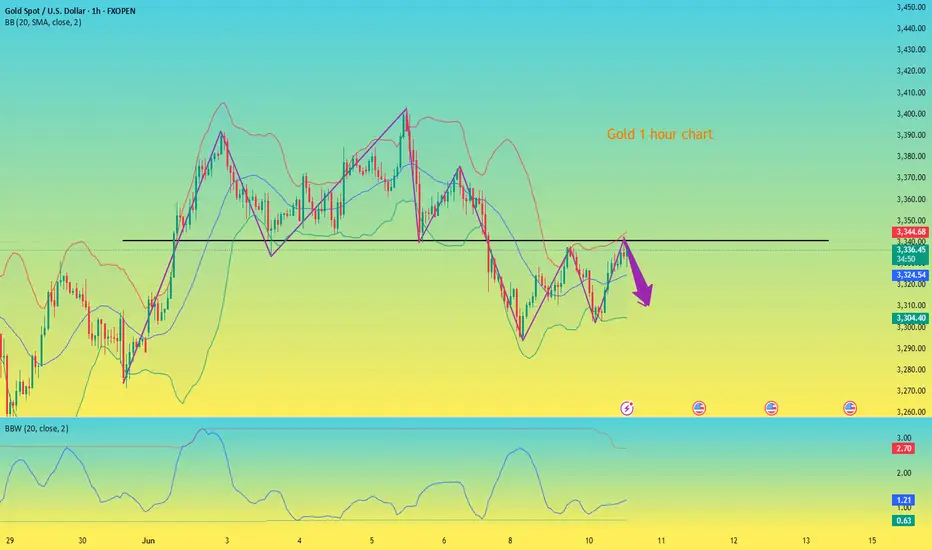
Gold has been rebounding during the day, but the strength of the rebound has weakened significantly. Although the one-hour trend broke through the upper pressure of 3340, it did not stand on 3340. The one-hour trend closed with a negative line, which means that the short-term rebound has come to an end. For this, we will continue to maintain a bearish view.
The pressure level of the one-hour market is at 3340. Before the gold price stands firm at 3340, it means that the rebound is an opportunity for us to short. The idea of our analysis just now is correct. Our internal strategy is also short at 3335. At present, the market has begun to fall back. Our positions are profitable. The target below will gradually look to around 3270, and our defense only needs to bring a little break loss.
Specific strategy
Gold 3335 short, stop loss 3345, target 3310
How will gold perform in the future?Market news:
In the early Asian session on Monday (June 9), spot gold opened high and fell, currently trading around $3,305/ounce. The large-scale riots in Los Angeles, the United States, attracted some safe-haven buying to support the London gold price. The stronger-than-expected US employment report hit the Federal Reserve's hopes of cutting interest rates this year, and silver once surged to its highest level since 2012. Data from the US Department of Labor showed that employers added 139,000 jobs in May, less than 147,000 in April, but more than the 130,000 increase predicted by a survey of economists. After the data was released, the financial market bet that the Federal Reserve would not cut interest rates until September, and the probability of a rate cut in September dropped from 88% to 60%. There will be two rate cuts in 2025, reducing bets on a possible third rate cut.In the next week, the market will usher in major trade negotiations and heavyweight US CPI data, which investors need to pay close attention to. In addition, US federal law enforcement officers continued to search for illegal immigrants in many places in Los Angeles County on the 7th, and had serious conflicts with local community residents for the second consecutive day. Investors also need to pay attention to the impact of market sentiment.
Technical Review:
Technically, gold plunged sharply after midnight on Friday, and the weekly line closed with a long upper shadow line and a small positive. The 3400 mark encountered resistance and fell sharply and fell into another adjustment cycle. The daily line closed with a continuous negative structure, and the New York closing price once again lost the MA10-day moving average of 3330. The price returned to the middle track of the Bollinger band at 3310, and the RSI indicator's central axis 50 value flattened! The short-term four-hour chart MA10/7-day moving average opened downward, the RSI indicator's central axis 50 value ran below, and the Bollinger band opened downward and the price ran along the middle and lower tracks. At the beginning of the week, trading focused on the rebound strength after the oversold. The main idea was to sell at a high price on the rebound, and to buy at a low price as an auxiliary.
Today's analysis:
At the daily level, the price of gold has maintained a volatile pattern in recent times. The Bollinger band opening narrowed, indicating that the buying and selling forces were stalemate. MACD fast and slow lines are above the zero axis, the spacing is narrowing and there is a golden cross trend, the red kinetic energy column is beginning to appear, the buying power is slowly gathering, the RSI indicator is around 55, and the buying and selling game is fierce! From the hourly line, the Bollinger Bands open downward, and selling is temporarily dominant.MACD dead cross operation, the green kinetic energy column continues to increase, the 5-day moving average crosses the 10-day moving average, and the short-term downward trend is obvious. However, the current support near 3300 is strong, and it rebounded after multiple dips. In the future, we need to pay attention to the breakthrough of key positions to grasp the trading opportunity.
Operation ideas:
Short-term gold 3283-3286 buy, stop loss 3275, target 3310-3330;
Short-term gold 3330-3333 sell, stop loss 3342, target 3290-3270;
Key points:
First support level: 3293, second support level: 3271, third support level: 3253
First resistance level: 3330, second resistance level: 3356, third resistance level: 3378

Ivanhoe Mines - a 50% discount opportunity !The share price of this mining monster has suffered a 50% price decline in the last 6 months.
One of the main reasons for the share price decline is the suspension of underground operations at the Kakula mine due to seismic activity. This suspension has led to a withdrawal of production and cost guidance for 2025, causing investor uncertainty and a subsequent drop in share price 1,2,3 Additionally, the company has faced challenges with its smelter, including a fire that damaged onsite generators and caused a three-month delay in commissioning. These issues, combined with power constraints and grid instability in the Democratic Republic of Congo (DRC), have contributed to a more conservative production outlook.
However there are lots of positive catalysts for Ivanhoe Mines: the upcoming rise in precious metal prices, especially the wake up of the severely undervalued PLATINUM prices.
Platreef PGM project in South Africa contains 7 million ounces of gold (0.25 gpt) and 50 million ounces of AuEq. About 90% of annual production (1 million ounces) will consist of PGMs (platinum group metals), making it the largest PGM mine in the world ! Platreef is expected to have low all-in production costs, though more precise figures will become available after the ramp-up phase, scheduled for the second half of 2025.
Platreef PGM, Kakula-Kamoa (massive copper mine, the largest high grade mine globally) and Kipushi (a high-grade zinc operation); With all three of their mines expected to be in production, 2025 could be a pivotal year for them.
Chart wise, the price is still rising in a long term rising wedge. Price just found support on the lower resistance and is bouncing strongly. OBV on balance volume is still on a steady rise. I own Ivanhoe Mines since I got in at sub 1$ (thanks to Rick Rule's reccomandation - God may bless him). and I am not willing to let go before we reach 50$, which is my long term target.

Gold is getting ready for another uptrend!Market news:
In the early Asian session on Friday (June 6), spot gold fluctuated slightly higher and is currently trading near the 3360 mark. London gold prices rose and fell on Thursday. Earlier in the session, silver broke through the $35 mark, hitting a 13-year high, driving the international gold price to break through the 3400 mark, hitting a nearly four-week high of around $3403/ounce, but then due to the signal of easing trade tensions released by the leaders of China and the United States!At the same time, data showed that the number of initial jobless claims in the United States increased for the second consecutive week. Now all eyes turn to Friday's non-farm payrolls report. Trump again called on Federal Reserve Chairman Jerome Powell to cut interest rates on Wednesday. And the easing of trade tensions directly affected the performance of safe-haven assets. The decline in gold prices reflects the market's optimistic expectations for the progress of Sino-US trade negotiations, weakening the attractiveness of gold as a safe-haven asset!The market is closely watching the upcoming non-farm payrolls data and the Fed's meeting resolution on June 17-18 to judge the short-term direction of gold prices. On the whole, international gold still has long-term investment value under the current global economic and geopolitical uncertainties. In the short term, it may fluctuate in a relatively high range, waiting for more guidance from economic data and policy signals.
Technical Review:
Gold closed alternately in the first four trading days of this week. Yesterday, gold rose sharply in the Asian and European sessions, and fell back in the US session. The roller coaster at the end of the session gave up all the gains during the day and fell below the 3350 mark to touch the 3339 line. The daily line pattern turned from a big positive to a big negative K and closed above 3350. Technically, the daily chart has alternated between positive and negative for four consecutive trading days. The US session fell sharply and tested the MA7-day moving average, but the price is still running above the MA10/7-day moving average. The Bollinger band of the short-term four-hour chart closed, the RSI indicator's middle axis flattened, and the hourly chart's four-hour moving average was glued. The technical side of gold intraday trading is arranged with a shock idea, and the intraday range refers to the 3328/3388 layout. Fundamentals today focus on the non-agricultural data released at 20:30 in the evening. The previous value was 177,000, and the market estimated value was only 130,000. According to the estimated value, it is bullish for gold and silver.
Today's analysis:
This year, it has been emphasized that 2025 is a strong year for gold. Gold may enter an accelerated buying structure this year. Tariff trade policies, geopolitical tensions, the Federal Reserve's interest rate decision, the decline in confidence in US bonds, and the increase in global central bank purchases have affected gold as a strong hedging tool. There will be room for growth. Therefore, as long as the overall environment remains unchanged, gold is still an absolute buying trend. Therefore, no matter how it is adjusted, it is an opportunity to buy into the warehouse. This week, gold remained in the range of 3332-3392 for the first three days. During this period, we sold at a high price and bought at a low price, which was also considered to have completed the expectations. Then, on Thursday and Friday, gold will remain in this range and look up. If the rise breaks through and stabilizes at 3400, the upper side will look at 3500. If it breaks through 3330, the lower side will look at 3280. Look for fluctuations before non-agricultural data, and then look at the impact of non-agricultural data.
Operation ideas:
Short-term gold 3340-3360 buy, stop loss 3330, target 3380-3400;
Short-term gold 3387-3390 short, stop loss 3400, target 3350-3330;
Key points:
First support level: 3342, second support level: 3328, third support level: 3303
First resistance level: 3376, second resistance level: 3388, third resistance level: 3410
