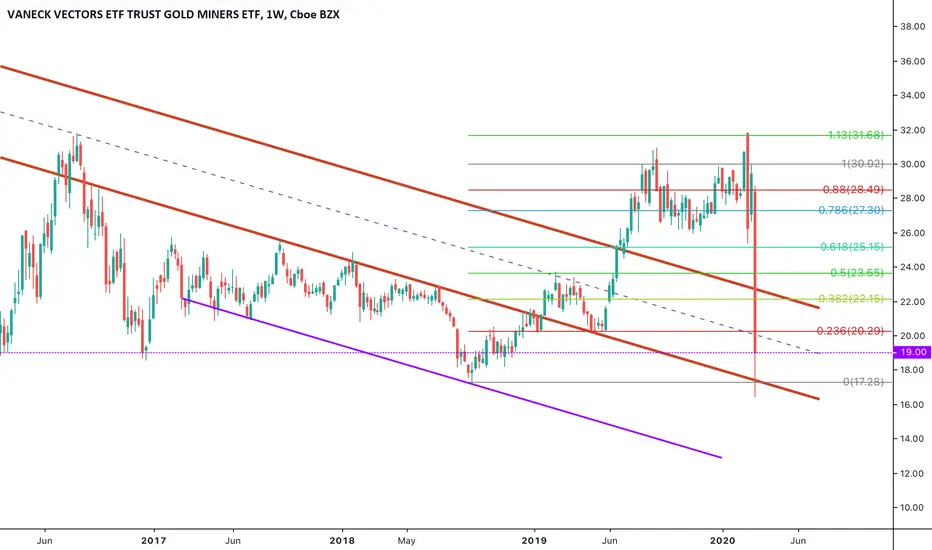
A little rebound for the Gold Miners perhaps?Long term I'm definitely a gold bug but I have warned repeatedly about near term risk (which I don't think has completely resolved if I'm honest). The market is euphoric but channels are now becoming apparent and lines are being drawn. It's very possible we have a small bounce in miners with the upper channel limits identified as well as some other possible diagonal resistances. Be careful, but a strong opening Monday could mean a quick trade for some easy money can be made.
Goldminers

SELL THE GOLD MINERSEXPECTING JUNIOR GOLD AND SILVER MINERS TO CONTINUE RETRACEMENT. I WILL REMAIN SHOR HERE. LOOKING FOR A NEAR TERM CONVERGENCE OF TREND LINES AND FIB RETRACEMENT LEVELS.
"PATIENCE COMES TO THOSE WHO WAIT"
-THE HAND OF GOLD


NEAR TERM HEAD SHOULDERS ON JUNIOR GOLD MINERSLooking for initial target of $46.66 on AMEX:GDXJ AMEX:JNUG AMEX:JDST

GDX/DUST: Gold miners still looking overboughtDon't get me wrong, I love gold/precious metals and the miners but sometimes a little perspective is needed. The miners index is in nosebleed territory with 92% bullish and negative divergence on the RSI(5) and MACD. Then I started looking at DUST, an inverse ETF and a large bullish wedge is appearing.

GDX - 7 Year BreakoutNew multi-month support at $32.
GDX needs to stay above $32 for the rally to resume.

SandStorm Gold - Shooting Star SignalThe combination of a shooting star (on an upward trend) combined with a red volume, signals a short-term reversal.

Agnico Eagle Mines - Key Level A strong breakout with high volumes, above the red resistance, would fuel up and resume the current rally.

PureGold - New Multi-Year HighPureGold's first production of its under-construction Red-Lake mine is expected for late 2020. Jeff Clark, a famous precious metals analyst, often quotes that empirical studies suggest that there is a 90% probability of a 90% stock-return during a mine's last year of construction.

Gold made new high, Indicies didn'tGold looks very bullish to me. Long, S/L 1666, target 1900 area
While i think US indicies will drop below their previous low ~2200 i don't think Gold will follow but
will make a new high instead. Should it be drawn down with the markets i buy on the way down.
Miners are still a good buy in my opinion.

Gold to Test ATH Soon?With the unemployment rate being announced later this week I have been keeping an eye on the gold markets for clues on a direction. Expectations are that unemployment will increase substantially from the last reported 4.4% to levels that haven't been seen since the 1930's. However, the price of gold hasn't really "outperformed" during the Covid-19 pandemic when compared next to other asset classes which begs the question, will the unemployment numbers really matter?
Looking at the charts gold has been in consolidation since breaking out of the inverse head and shoulders on April 6th. Price has retested and been trading flat since April 14th. The chart below is of the SPDR Gold Trust ETF (GLD). Current support is 156.95 and is a must hold if more upside is to follow.
On the 4-hour chart above, I've highlighted how volume increased on the break of the inverse head and shoulders, and as price returned to retest support volume has settled nicely. MACD confirms this and is beginning to show potential strength in bullish momentum. If GLD breakout, targets should be set towards 174, which conveniently is nearly all-time high resistance.
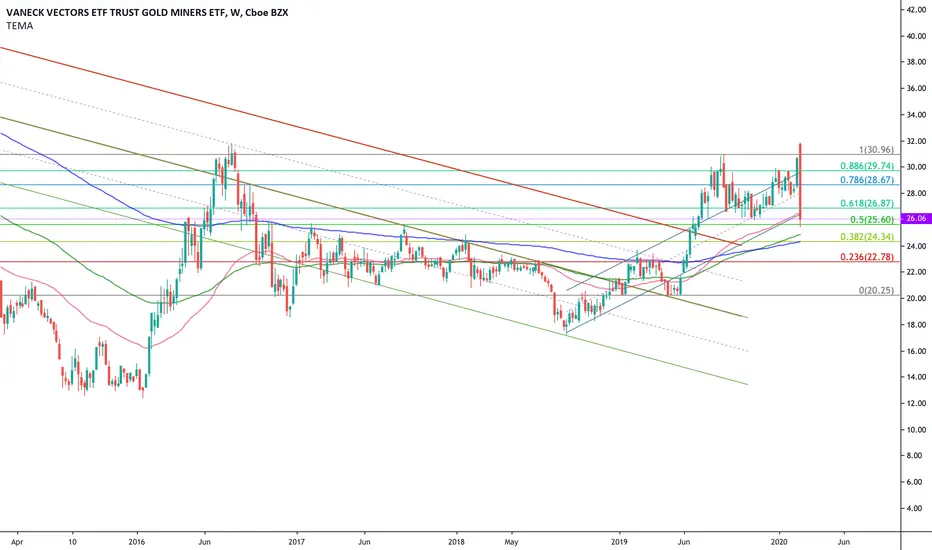
How confident can we be on this trade? Below is the weekly chart of GDX, a Gold Miners ETF. Here, note the weekly retest of previous resistance at 31. How strong the support remains to be seen, but the strength on the gold miners is undeniable and reaffirms the gold trade to the upside.
Heading into the potentially historic unemployment announcement this Friday, it may be a safe bet to look into gold if you believe in the safe haven narrative. If you are a trader like me, GLD and GDX present opportunities to make 10-20% returns in a short period. Bias: Bullish .

GDX Confirmed Breakout => $50 ObjectiveGDX looks good : we have certainly seen the bottom here.
Breakout was validated by the pullback confirmation.
There is a huge potential here, based on the previous lows of march : Target Price of $50.
Volumes are not very high, but they should pick up quickly, as investors have being buying the dips during the past weeks.


Looking to Short - Technical Analysis of JNUG - Gold MiningIt looks like the tons of volume that entered the market on JNUG last week is the only thing keeping the price afloat. Overall the stock is bearish, dropping from over $100 to single digits.
Short-term, it's getting ready to test the resistance (shown by the horizontal green line. We can see a bullish trend over the last few days, steadily making higher lows. I'm expecting it to continue the downward trend because it's getting close to testing it's previous top, but those who are taking a more optimistic position should at least wait until it closes above the resistance before taking a long position.
Holding my short positions unless the resistance is broken

Long $GDX BreakoutWith gold breaking out a bunch lately this will surely follow it , especialy with a clean breakout of this 30-31 doller level .. easy breakout trade imo.

Gold-Gold Miners-DXY-Fed Funds-Monetary Base All CorrelatingThis is the Gold Miners Index to DXY ratio. This feels likes 2001 or 2009. Gold is correlating with Fed Funds, the monetary base, and the DXY like its 2009 and 2001. Gold stocks are priced like its 2009.
Since 2019 we have seen the Fed Funds Rate free fall, since September 2019 we have seen the monetary base expand past the low set in December 2016, same with the Fed's balance sheet. We have seen the Fed Rate continue to fall now down to 1.00-1.25. And since September we've seen gold continue to make new highs, the US dollar / DXY break through critical support. We've also seen gold and gold stocks breakout against US indices.
Could this be the beginning of the next bull run? Could this be the run we started in 2009 and prematurely ended in 2011?
If so, hold on to your seat because we're just getting started here. Look for Gold Miners (XAU) to DXY ratio to start surging as the mining sector plays catch up to gold and as the Fed Funds rate continues to plummet and the balance sheet / monetary base continue to grow.
What's interesting is the gold tends to fall when the monetary base falls. But gold has tended to rise when the monetary base moves sideways. It seems like without Fed intervention the monetary base is shrinking and the only way to keep asset prices propped up is to keep expanding the base. This means gold could be on the cusp of an incredible move without much downside even with the prospects of a broad market crash remaining fairly high.

Time for Centamin to reverse?Inverse H&S pattern formed on CEY which started in May 2018.
Reasonable results today and gold in a strong position. Will it go further?


$GDX #Gold miners lagging $XAUUSD by 20% $NUGT $DUST $GLD $JNUGToday's GDX selloff is likely due to an antecipation of a V shaped recovery in the markets.

CDE - attractive entryNYSE:CDE is one of the most volatile ideas in the gold mining space. So if enetered correctly it offers relatively quick and attractive rewards.
Currently idea is retesting major support level, through which it broken up in early November. And if uptrend is to continue in this miner, should not go much lower than current spot.
I am entering with idea to hold it as potential long term holding.

IAG - excellent follow throughDiscussed that NYSE:IAG may have bottomed two weeks ago. And price action in last two days on very heavy volume supports the fact that it really did.
Now it is approaching resistance zone and neckline of inverse H&S. Might rest for a while, but when resistance is cleared, nothing should stop the rally later on.
