Circular short selling is still the main themeGold has no power to rebound in the Asian session, and it keeps fluctuating and falling. The highest rebound was 3292, but it fell back under pressure, and the lowest touched 3217. The fluctuation and decline are still dominant, so we only need to short on the rebound. It is still difficult to fill the gap at the opening today, so don't have hope. Just keep shorting on the rebound. The weekend article also analyzes the bearish opening this week. After all, the international situation of India and Pakistan's comprehensive ceasefire and Russia-Ukraine ceasefire negotiations are mainly bearish for gold. Coupled with the technical shorts, it is reasonable for gold to jump short. Today, we will treat gold as rebound shorting. In terms of operation, we will mainly short on rebound and be a steady trader. Judging from the current trend of gold, the main short rhythm of the pullback will continue to remain unchanged before the daily level breaks through and stands at this position.
Goldminers

Wallbridge Squeeze Continues After almost five years of falling, a decision is nearing for Wallbridge! I would be surprised if this continues within this channel into 2026.
I would also not count out a reverse split if this does not go higher soon.

Gold 3386 is under pressure, don't worry
Gold rose rapidly today. At present, the price of gold has reached the 3386 line. There will be pressure to fill the gap and choose to bear the pressure.
Now that gold is adjusting and falling at 3386, don't rush to gamble and enter the market. Wait for time + point + harmonious position. The market will find support in an effective time. Now the effective support point of gold is about 3346/36. The price fluctuates violently. It is recommended to take a stop loss in time after entering the market to avoid a sudden accident in the market and cause unnecessary losses. Today's rising cycle can be seen in the 3400/3420 range. On the downside today, if the market changes and recovers the opening price, just wait and see. This kind of market is unlikely to occur, but if it occurs, you have to wait and see and don't be stubborn in your thoughts.
Market contradictions and potential risks:
Fed policy expectations: The market's probability of a rate cut in June has dropped to 37%. If the Fed releases hawkish signals this week, it may suppress gold prices.
ETF holdings diverge: Despite the rise in gold prices, the world's largest gold ETF (SPDR) holdings decreased by 4.87 tons, reflecting that some institutions sold off their holdings at high prices.
Geopolitical variables:
Middle East conflict escalates: If the friction between Iran and Israel intensifies, gold may hit $3,450; on the contrary, if the situation eases, the gold price may fall back to $3,300

Gold breaks through 3350. Can the bullish pattern continue?In the early Asian session, gold rose rapidly and broke through the 3350 resistance level predicted by Quaid.
Fundamental analysis:
US political developments also add uncertainty to the market. The Trump administration's decision to impose a 100% tariff on imported films shocked the market, and this unpredictable trade policy weakened market confidence. Although the dollar was supported by strong employment data, it still struggled to gain substantial upward momentum, which further supported gold prices.
Economic uncertainty also boosted gold prices. The market generally expects the Federal Reserve to start a rate cut cycle in the near future, which weakens the attractiveness of interest-bearing assets and increases the relative value of non-yielding gold. However, many traders remain cautious and avoid building large positions, waiting for clearer policy signals.
Technical analysis interpretation:
From the monthly chart analysis, gold breaking through the neckline becomes a key trigger point. The pattern measures the depth from the neckline to the bottom of the head and projects it upward, giving a target price range of $3200-3300, which has now been achieved.
In addition, the pattern is not only technically strong, but also psychologically significant. A breakout after a long period of consolidation often attracts new long-term market participants and speculators.
Market Observation:
Current market sentiment is cautiously optimistic. On the one hand, macro uncertainty and risk aversion demand drive funds to the gold market; on the other hand, concerns about the timing and magnitude of the Fed's policy adjustments restrict the willingness of some bulls to take risks.
Quaid Analysis:
Bull Outlook
After the gold price breaks through the 3350 resistance level I predicted, the next target range may point to 3380-3400.
Short Outlook
In the short term, gold may face technical pullback pressure. The main support levels are at 3330 and 3300. If it falls below 3300, it may trigger a deeper pullback to around 3240.
Quaid believes that the market's expectations for the Fed's shift may be too optimistic. If future data show that inflationary pressure remains stubborn or economic resilience exceeds expectations, it may lead to a delay in expectations for rate cuts, thereby putting pressure on gold prices.

Let's wait for gold to break new highs
Today, the price of gold bottomed out and rebounded, breaking through the expected dividing point of 3260.
At this time, many traders need to learn to adjust their thinking.
If it is a retracement, on the one hand, the price will not break through and open a decline, and on the other hand, after the force is too strong, it must be a position adjustment and a reverse long.
Even if you don’t go long, you can’t go short easily. In many cases, the rules of trading must be followed.
The second rise from the low point to the high point just corrected the 382 support 3252 and continued to rise and break the high. It depends on whether you have the courage to enter the market.
The intraday increase of 80 US dollars +, today there is only one idea, continue to go long;
The support level refers to 3210 and 3215, you can go long in batches, with 3290 as defense, and continue to watch the gold price break high!
After the strength, there will be a second high point!
Thank you dear traders for reading, if you like it, please tell me

GOLD SWING XAUUSD took support form bottom - up Line.
All long targets are achieved
This month taking rejection from major resistence,
Let's track the moves from Top down line.
Follow for more swing analysis for INDICES - CURRENCY - COMMODITIES

XAUUSD swing Analysis XAUUSD took support from support line,
All long targets are achieved.
this month taking rejection from major resistence,
Let's track the moves to down.
follow for more swing analysis on INDICES - CURRENCY - COMMODITIES

Gold shocks pull the trend towards the bearish side!Gold market trend analysis:
Gold technical analysis: You should have seen the exaggeration of gold, right? Gold has also experienced several major ups and downs in history, but this time is definitely one that can be recorded in the history books. The daily lines in the past few months are very exaggerated, and the rise and fall range is unprecedented. Just today's Asian market, a simple dive is dozens of points. This is the market. The market is always right. We need to respect it the most, rather than blindly look at it subjectively. Surviving in such a big market is the most important thing. Many times, the fluctuation of gold is basically not related to technicality. We try to follow the direct pursuit mode in operation, and we can catch big profits in such a big market. Last week, the weekly line closed with a big tombstone, the weekly line top appeared, and the air force appeared. In May, gold will at least adjust to around 3,000.
The above is the 4-hour pattern, which is repairing below the moving average. If the bulls break 3370 again, there is a possibility of rising again. Otherwise, gold will adjust deeply again. This wave of adjustment is at the weekly level. The daily pattern is also turning into a peaking mode. Note that the rise and fall of gold is not based on technical aspects, but more on fundamentals and big data, as well as the impact of tariffs. Without these influences, we will be bearish this week. If the decline of the big C wave continues, the target will be 3230 (the half point of the entire April rebound) in turn. 3165 is the Fibonacci 61.8 position of the callback and also the previous high point, which is easy to form a rebound. Today's gold focuses on two major suppressions, one is the hourly suppression around 3300, and the other is 3315 and 3328, both of which are opportunities for air forces. On the whole, today's short-term operation strategy for gold is to short on rebounds and to buy on pullbacks. The upper short-term focus is on the 3298-3300 resistance line, and the lower short-term focus is on the 3265-3260 support line. Friends must keep up with the rhythm. It is necessary to control the position and stop loss, set stop loss strictly, and do not resist single operation. The specific points are mainly based on real-time intraday trading. Welcome to experience, exchange real-time market conditions, and follow real-time orders.

Gold price remains volatile at 3,300, short-term operation
💹Fundamental analysis
Fed officials have hinted at an openness to possible rate cuts, a stance that could limit further gains in the U.S. dollar (USD) and provide support for non-yielding gold prices. In addition, growing concerns about the economic impact of President Donald Trump's aggressive tariff measures, coupled with ongoing geopolitical instability, continue to enhance the appeal of safe-haven assets. In this environment, the overall trend of gold remains biased to the upside, prompting traders to remain cautious when considering bold shorts.
📊Comment Analysis
Continue to consolidate, the price range fluctuates around 3300
💰Strategy Package
Long position:
Actively participate at 3282 points, profit target around 3320 points
Short position:
Actively participate around 3320 points, profit target around 3300 points
⭐️ Note: Labaron hopes that traders can properly manage their funds
- Choose the number of lots that matches your funds
- Profit is 5-10% of the fund account
- Stop loss is 1-3% of the fund account

SHORT GDX or LONG DUST // Swing TradingAfter correction of Gold (GLD) day before yesterday.
A equity market open for a risk-on scenario, maybe cooldown the gold rally for a while.
Today GDX filled the gap of the yesterday decline stopin at $50 (yellow mark).
Target $44-$45. First level of Fibonacci.

Is the gold price rally over?Market news:
In early Asian trading on Thursday (April 24), spot gold rebounded sharply and is currently trading around $3,355/ounce, supported by bargain hunting. London gold prices continued to fall from record highs on Wednesday, falling nearly 3% to a low of $3,260/ounce, a stunning plunge. U.S. President Trump's remarks not only appeased investors and encouraged risky assets, but also hit international gold. Due to the possible easing of tensions between China and the United States, and U.S. President Trump's statement that he does not intend to fire Federal Reserve Chairman Powell, risk appetite has improved, the overall financial market atmosphere has improved, and the U.S. dollar has also rebounded from Trump's criticism of Powell for not cutting interest rates for several consecutive days. This has suppressed gold prices. After gold prices were blocked and fell back at the 3,500 mark, more short-term long profit-taking also dragged down international gold prices. This trading day will release the initial monthly rate of durable goods orders in the United States in March and the number of initial jobless claims in the United States as of the week ending April 19. Investors need to pay attention to them. In addition, they need to continue to pay attention to relevant news about the international trade situation and geopolitical situation.
Technical Review:
Gold Since 2025, the bull market of gold has been obvious. In just one quarter, it has reached the 3500 mark, and the increase has jumped by about 30%, which further illustrates the severe global economic situation and the risks brought by regional political turmoil, thus prompting investors to choose to buy gold to avoid inflation! After the gold white plate fell yesterday, the European plate continued to adjust widely, and the long and short battles were obvious. Subsequently, the short-term correction continued to intensify. The United States was afraid of breaking down again to 3260, the largest correction from the recent high! As time goes by, Huang is facing the closing of the monthly and weekly lines today. In the short term, we believe that the correction is likely to end soon, and there will be another pullback at any time. Pay attention to the 3380 inflection point for the pullback, and the inflection point breakthrough will be tested again at any time! At present, from the market, we can clearly see that the long-term gold bull market is not reduced. The short-term correction may be for better stretching later. Therefore, we should pay attention to the correction strength in the short term. From the 4-hour chart, the current long MACD of Huang Jin is gradually decreasing, and it is about to switch to short position. However, the KDJ indicator signal bottom divergence, and the big golden cross is expected. Obviously, the most important thing is to look at the Asian market trend and the closing of the next white market of gold!
Today fenxi:
The gold daily line fell by 240 US dollars in a row. At present, 3500 is temporarily under short-term pressure. Whether the adjustment is over or not is still uncertain. The short-term 4-hour middle track 3380 has been lost and has become a key counter-pressure point. As long as it does not stand on it again, it will maintain a downward correction. After breaking 3292 below, it is the 66-day moving average of 3260 to see the loss! The 1-hour K-line was under pressure from ma10 and ma5, and continued to fall. After last night’s consolidation and pull-up, the K-line is now running above ma10 again, and the macd is under the zero axis. This wave of 200 US dollars’ rapid decline has almost corrected most of it. If it continues to fall, or with the help of bottom divergence, it will slowly brew a short-term bottom! Today is also a critical day for gold. After the bottom of 3260, will the adjustment end and continue to rise, or will it just rebound? Then today’s strength is very important. If gold continues to rise directly today without a major correction, it means that gold may start to fluctuate and rise again.
Operation ideas:
Short-term gold 3315-3318 buy, stop loss 3306, target 3360-3380;
Short-term gold 3387-3390 sell, stop loss 3400, target 3320-3330;
Key points:
First support level: 3326, second support level: 3300, third support level: 3288
First resistance level: 3350, second resistance level: 3376, third resistance level: 3400

GOLD: What happened?Hello friends
The trend is very bullish and given the recent events in the world, the possibility of a decline is decreasing, so we can buy in pullbacks that the price is making in steps and with capital management and risk, price targets have also been specified.
*Trade safely with us*

GoldXAUUSD
- Completed " 12345 " Impulsive Waves
- Break of Structure
- RSI - Divergence
- Bullish Channel as an corrective pattern in Short Time Frame
- Change of Characteristics

Gold now Resistance Zone After many Year Gold outperform to Equity, but they face some resistance in near term.
Geo political and Tarrif support gold price upper level, but now We not seen risk to reward favour in gold. So be cautious
3337/3377$ major resistance

Gold prices soared again!Market news:
In the early Asian session on Wednesday, spot gold suddenly surged in the short term, breaking through the $3,275/ounce mark, with an intraday increase of more than $45. The latest report from Bloomberg News in the United States said that as the Trump administration pushed forward investigations that could expand the trade war, it stimulated demand for safe-haven assets, and the London gold price hit a record high again. As the escalating trade war has raised concerns about the prospect of a global recession, as a traditional safe-haven asset, gold has accumulated a gain of more than 23% in 2025, continuing to set a record. As investors increase their holdings of international gold-backed exchange-traded funds (ETFs) and central banks continue to increase their holdings of gold, major banks remain optimistic about the outlook for gold in the coming quarters. Investors are waiting for a speech by Federal Reserve Chairman Powell, scheduled for Wednesday, to look for clues related to interest rates. It is also necessary to pay attention to the US retail sales data at 20:30 on Wednesday and the specific implementation details of Trump's tariff policy. The analyst specifically reminded that market liquidity may decline before the Good Friday holiday, and any sudden policy changes may trigger sharp fluctuations.
Technical Review:
Gold opened sharply higher in the early trading and hit a new record high. It broke through the 3230 mark in the late trading and stabilized. The price continued to break the adjustment range of yesterday and rose in large volume. There was no technical movement during the day. The super-gain appeared in the early trading, and the price continued to hit a new record high. As investors turned to safe-haven assets amid the uncertainty brought by the continued tariff plan of US President Trump, additional tariffs could exacerbate the ongoing trade war and slow global economic growth. As global stock markets bottomed, the pressure on gold finally eased, and the precious metal rose sharply to a record high. The rise was very fierce because everyone rushed into the gold market, hoping to use it as a safe haven against the stagflation caused by the trade war. From a more macro perspective, gold is still in an upward trend because real yields may continue to fall because the threshold for rate hikes remains very high. Potential risks include another sharp sell-off in the stock market or a hawkish stance from the Federal Reserve. In the short term, given that gold's buying positions are too concentrated, if the trade war eases, gold prices are likely to experience a deeper correction, so it is necessary to pay close attention to developments in this regard. The current environment still supports the rise of gold, but the road to gold price rise will not be smooth, and there may be a temporary correction in the middle.
Today's analysis:
Gold directly broke through the new high in the early trading to avoid risks. The short-term adjustment of gold ended and finally completed the adjustment in a volatile manner. This kind of strong buying market of the breakthrough will basically not fall back too much. Since gold has chosen to break upward, since it has broken through, then it is to buy in the trend. The decline of gold is an opportunity to buy.The 1-hour moving average of gold began to turn upward. If the 1-hour moving average of gold continues to diverge upward, then the buying of gold will continue to exert its strength. After gold breaks through 3245, then gold 3245 has formed support in the short term. Buy on dips when gold falls back to 3245. The strength of the wave of gold in the morning was still there at that time, so after the high, you must wait patiently for adjustments and continue to go long. Gold can continue to buy when it falls back to around 3245.
Operation ideas:
Buy short-term gold at 3245-3248, stop loss at 3236, target at 3280-3290;
Sell short-term gold at 3293-3295, stop loss at 3304, target at 3250-3240;
Key points:
First support level: 3253, second support level: 3240, third support level: 3225
First resistance level: 3280, second resistance level: 3300, third resistance level: 3315

Bullish momentum is strong, keep an eye on key positions
📌 Driving events
On Monday (April 14), spot gold fell slightly during the day, hitting a record high of $3,245.42/ounce earlier before falling back. Despite a small adjustment during the day, the price of gold remained above the key mark of $3,200/ounce, indicating that the overall market sentiment is still cautiously optimistic. The main factors driving this round of market conditions include uncertainty in the global trade environment, a weaker dollar, and continued warming of safe-haven demand. During the session, investors' reactions to the latest tariff remarks increased gold price volatility, but fundamental and technical support remained solid, and the strong pattern of gold did not show any significant shakes.
📊 Commentary and analysis
From a technical perspective, the trend of spot gold continued its recent strong pattern. On the daily level, gold prices have continued to run along the rising channel since breaking through $3,000/ounce. Although there was a small correction during the day, the overall bullish trend was not damaged. The current price is firmly above $3,200/ounce, which has become a key psychological and support level in the short term. If the gold price can continue to hold this area, bulls may further challenge $3,250/ounce or even higher.
On the hourly chart, after the gold price surged to $3,245.42/ounce in the morning, it was suppressed by short-term profit-taking and showed signs of decline.
However, from a longer-term perspective, the upward slope of gold prices since the end of last year has remained stable, and there has been no significant retracement after breaking through key resistance levels many times, reflecting the resilience of the bulls. Analysts pointed out that the support of $3,200/ounce is strong. If the subsequent price can hold this level, the bulls may exert their strength again in the next few days.
💰Strategy package
Upper pressure - 3260-3280
Lower support - 3210-3200
Start time 3220-30 Continue to go long
Take profit 3240
Stop loss 3210
⭐️Note: Labaron hopes that traders can properly manage their capital
- Choose the number of lots that matches your capital
- Take profit equals 4-7% of the capital account
- Stop loss equals 1-3% of the capital account
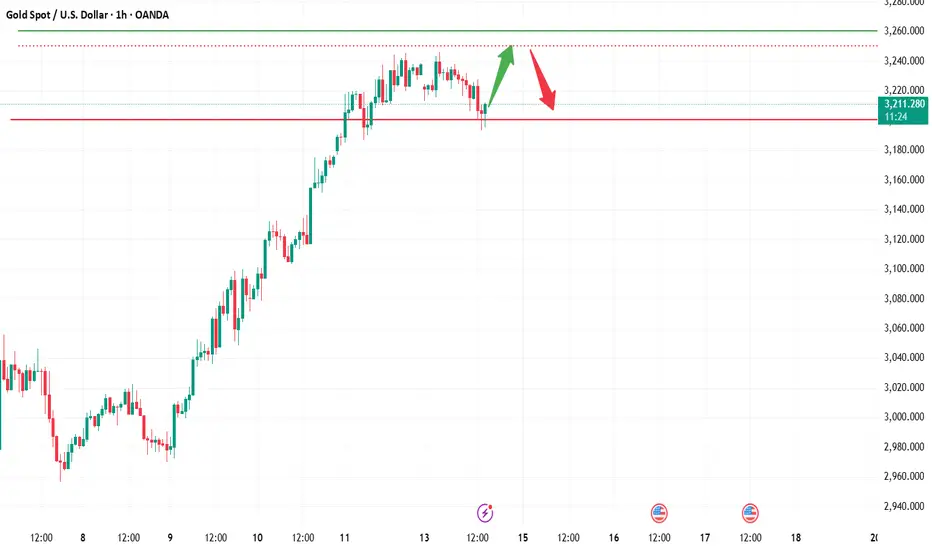
Gold price hits new high, 3216 as the dividing lineGold prices rose strongly by nearly $276 in three trading days, and broke through historical highs one after another. There is no highest, only higher.
There are many similar points in the rise, which can be summarized into five points. The first is the continued rise in the early trading and breaking through the new high. The second is the 0.382 position of the space adjustment and the same amplitude switching of the space. The third is the wandering back and forth sweep of the European session. The fourth is the flash of good points. The fifth is to learn to stop when you are ahead.
Combining these five points to look at the market situation, the gold price continues to rise. Last Friday, it closed directly at the high of 3237-3238 area.
Today The price opened lower in the morning and touched 3210, and hit a new high of 3245.6. But this time it was different. After the high, it fell back. The rise was 30 US dollars, and the high fell back 25 US dollars. Basically, the rise was as much as the fall. In the afternoon, the resistance of 3238 was confirmed for the second time, and it fell 22 US dollars again to find 3216, which was basically recovered.
The overall trend will be more adjusted. The cooperation between the high fall and the bottom recovery will provide momentum for the start of a new round of market.
Specifically, the key points to note are:
1. The correction range of the market space is at least 30 US dollars, and the start is at least 60 US dollars. Instead of focusing on the high and low issues, we should grasp the present.
2. The daily and weekly lines are rising strongly, and the indicators and patterns are overloaded. At present, only the direction is referenced; the four-hour pattern opening situation, the lifeline position is slightly far away, 3154 is close to the support point 3151 area that was stepped back late at night, and together they become the spatial dividing line. The resistance above is 3270-3275 and 3299.
3. The hourly chart pattern closed and flattened. Today's white market has been running back and forth around the upper and lower rails. The current pattern further closed the range of 3242-3216. Break through this space and then look at the space switch, and then cooperate with the small cycle double-line upper rail position 3194 area. If the price breaks the early low of 3210, it will switch space downward.
4. As shown in the figure, the price last week accelerated the rise and broke through 3190, and last Friday, it repeatedly broke through the new high around 3210, first the new high of 3238 (looking for 3210), then the new high of 3245 (looking for 3210), and then the new high of 3245.6
Now the price is down to 3216, which is also the starting point of the Asian session
Using 3216 as the switching point, the current sweeping space is about 30 US dollars, and the subsequent price breakthrough will switch the space of 30 US dollars
Focus on 3276-3278 upwards and 3186-3188 downwards
And it is very interesting that the 0.382 position of the latest wave of rise is also at 3187-3188
So, here we need to focus on the key points , with 3246-3216 as the range sweep, breaking through and switching to 30 US dollars, focusing on the support of the 3186-3188 area, and then looking at the upward switching space
In addition, it is necessary to remember that the online position is the 3131-3129 area, the top and bottom conversion position, and it is also a strong resistance level that turns into a strong support level after breaking through. After breaking through, it directly rises unilaterally
In summary, for gold at the beginning of the week, we treat it with a biased adjustment and sweeping idea. Referring to this idea, we have deployed high altitude twice in the 3236-3238 area. As of press time, the price fell to 3216, and all short orders were closed at 3217, waiting for the next plan. Now the price has risen again to 3230, and it continues to sweep, rushing high and falling, bottoming out and rising, which is in line with the above-mentioned biased sweeping and adjustment method.

Gold buying momentum is off the charts!Market news:
In the early Asian session on Friday (April 11), spot gold continued to rise, reaching a high of $3,220/ounce, setting a new record high. The unexpected slowdown in US inflation dragged down the US dollar, and the international trade war continued to push investors to safe-haven gold. As trade tensions intensified, market risk aversion suddenly heated up, and the price of gold in London soared by more than $200!The first monthly price decline in nearly five years released by the U.S. Department of Labor on Thursday also showed that demand was weak amid growing concerns about a recession caused by tariffs, which also led financial markets to expect that the Federal Reserve may cut interest rates by 100 basis points this year. After the release of the U.S. CPI data, traders bet that the Federal Reserve will resume rate cuts in June, and may accumulate a 1 percentage point cut by the end of this year. Low interest rates are usually good for international gold because gold does not pay interest. As the situation of declining confidence has already formed, Federal Reserve officials are worried that this will further suppress consumption and investment. This week, Fed policymakers said they still believe that tariffs are a blow to economic growth and increase the risk of rising inflation, putting monetary policy at a difficult crossroads. Several Fed officials will still speak on Friday, and investors need to pay attention to them. In addition, they need to pay attention to the performance of the March PPI data, the international trade situation and the changes in market risk aversion.
Technical review:
The gold daily line closed with a big positive line with a gain of more than $100 yesterday. This single-day gain is extremely rare in more than 10 years. The market has been extremely crazy with a rise of $200 in two trading days. On Thursday, gold hit a new high in the US market. Market sentiment completely followed the tariff war. Technical analysis is pale and powerless to grasp it. We can only control risks and reduce positions to operate. The gold price stood on the middle track and the short-term moving average 5MA, that is, the 3030-3040 line, and the closing price was just above the MA10 daily line. This morning, gold continued to rise strongly relying on the MA10 daily line, and the current highest has reached the 3220 line. With such a strong impact, the rapid decline in the three trading days on the daily line has turned into a bottoming out and rebound. Whether it continues to break high or buy correction, it is just that the impact of the tariff war has accelerated the amplitude and time. According to the previous large rise, if the buying sentiment continues to be high, the next position is 3300.
Today's analysis
Gold has risen strongly, continuously setting new historical highs, and the buying momentum is strong! At the 4-hour level, the support level has moved up. The 1-hour moving average of gold has formed a golden cross upward buying arrangement, indicating that gold buying still has the power to rise further. At present, the gold price has set a new historical high, and it is not advisable to rush to chase the rise at this time. The short-term operation strategy can wait for the price to step back, and after stabilizing below, buy in combination with the support level. Today, the highest gold in the Asian session has risen to 3220, and the demand for risk aversion has increased. Most people have a high degree of attention and willingness to buy gold. Judging from the market trend, gold has already stood firm at the previous high of 3167, and the buying trend has continued. In the past few days, the daily increase in gold has exceeded 100 US dollars. I believe that the increase in gold prices today will not be too small, and today's gold is expected to further move towards the 3300 mark. Wait for a correction during the session and buy on the trend!
Operation ideas:
Buy short-term gold at 3177-3180, stop loss at 3168, target at 3220-3230;
Sell short-term gold at 3233-3236, stop loss at 3245, target at 3200-3190;
Key points:
First support level: 3200, second support level: 3185, third support level: 3170
First resistance level: 3223, second resistance level: 3236, third resistance level: 3250

GOLD WEEKLY CHART MID/LONG RANGE ROUTE MAP UPDATEDWeekly GOLD Analysis: February 2024
Hello Traders,
Here’s a weekly chart analysis of the GOLD, offering a comprehensive view of recent market trends and future predictions. Our diligent tracking since October 2023 has consistently delivered 100% target accuracy, as evidenced by the marked Golden Circle areas on the charts. Let’s dive into the highlights and what lies ahead.
Recap of Recent Successes
Weekly Chart Highlights:
Last week, the market flawlessly followed our predictions:
* Key Level 2735 ✅ DONE
* Entry Level 2735.88 ✅ DONE
* EMA5: Crossed and locked above Entry ✅ 2735 DONE
* Bullish Target TP1: 2877 ✅ DONE
* The FVG zone around 2735 sustained bullish momentum, while resistance was broken, leading to a new all-time high of 2886.
What’s Next for GOLD? Bullish or Bearish?
We anticipate continued bullish momentum with updated GOLDTURN levels and refined targets.
Key Level: 2735 remains critical.
EMA5 Behavior:
* If EMA5 holds above 2735 and crosses/locks above TP1 (2877), the next target is TP2 (3018), followed by TP3 (3160).
* A failure to hold above 2735 could indicate bearish momentum, prices will be retesting support at 2595 in the demand zone.
Recommendations & Strategy:
* Focus on EMA5: Its behavior near 2735 and TP1 will provide clear direction for short- and long-term trades.
* Support Levels: GOLDTURN levels at 2735 and 2595 are critical for identifying reversal zones and optimal dip-buying opportunities.
* For precise entry and exit points, review our daily, 12H, 4H, and 1H analyses to navigate the market confidently.
* Slight pullbacks may occur, with potential reversals near GOLDTURN levels.
* Long-Term Outlook: The monthly chart suggests sustained bullish momentum, offering excellent opportunities for dip-buying near key support zones.
Stay Updated:
We’ll continue to share daily updates, insights, and strategies on our TradingView channel and YouTube channel every Sunday. Don’t forget to like, comment, and share to support our work and help others benefit!
The Quantum Trading Mastery

Gold price rally resumes?Market news:
In the early Asian session on Thursday (April 10), spot gold fluctuated in a narrow range and is currently trading at $3,085/ounce. International gold staged a "violent rise" on Wednesday, soaring more than 3% in a single day, the largest increase since March 2020, and approaching the $3,100 mark during the session. Behind this epic market is the Trump administration's decision to raise tariffs on Asian giants to 125% - the market panic index instantly exploded, and investors once frantically sold stocks and industrial commodities, pushing gold to the safe haven throne.The capriciousness of the US government's tariff plan has shaken the world, and investors are looking for direction and certainty. This generally supports gold. Although the 90-day tariff suspension order has caused the London gold price to fall slightly to $3,082, traders' fingers are still hanging on the buy button: the current gold price has soared by $400 from the beginning of the year, and is only one step away from the historical peak of $3,167 on April 3! All eyes are on Thursday's US CPI data - if inflation exceeds expectations again, the market's fear of the Fed's "longer and higher" interest rate will send gold prices to $3,200; if the data is weak, the expectation of an early rate cut will trigger more crazy safe-haven buying. In addition, it is necessary to pay attention to the changes in the number of initial jobless claims in the United States. Several Fed officials will speak on this trading day, and investors also need to pay attention.
Technical Review:
Market news influences everything, tariffs are escalated again, and gold rose sharply to 3099.4 in the late trading, close to the 3100 mark, and retreated sharply by more than $50 to 3048 before closing. The daily line turned from negative to strong positive and closed. The New York closing price on the daily chart once again stood on the MA10-day moving average, and the one-day trend was broken and the volatility was quite large. Be alert to the market's extreme volatility again, closing strong at a high level in the early morning. From the short-term trend, the bulls have the upper hand, showing an extremely obvious strong pattern. Therefore, the focus of the day needs to be on whether this rising trend can continue. After the correction during the day, participate in the low-price buying layout. If there is no correction during the day and the 3100 mark is broken first, pay attention to the opportunity to buy at a low price after the 3100 mark is broken.
Today's analysis:
At present, gold continues to rebound, and the previous view remains unchanged. The general trend is buying, but it is currently in the mid-term adjustment period. As emphasized earlier, after the previous sharp drop in gold, it is still necessary to continue to be bullish without directly changing the current strength. This is why I have been suggesting buying in the past two days. From a technical point of view, the rebound to 2956 at the beginning of the week ushered in a rebound, and the lows gradually moved up. On Wednesday, the daily line closed with a big positive line, so the previous 2956 position formed a bottoming performance, and the Bollinger closing became more and more obvious. The technical conditions for this wave of bottoming have been met, so there was a bullish outbreak in the US market on Wednesday. As long as the current gold market stands firmly at 3100, it can continue to look up to 3136 or even 3167 or higher. In the 4-hour chart of gold, we can see that the market has been advancing all the way, forming a head and shoulders bottom pattern at 2955 and 2970. In the short term, we will first see whether it can stand above 3100, and then see whether it can form a unilateral surge and reach a new high. Therefore, trading should still be mainly based on buying, waiting for the trend to rise. The support below can refer to the 3062 and 3035 positions of the US market retracement on Wednesday to continue to be bullish, and make effective buy orders above these positions respectively. If it breaks, wait for the next support position to continue buying. As long as these two positions are maintained, the short-term bullish trend will remain unchanged.
Operation ideas:
Buy short-term gold at 3062-3065, stop loss at 3053, target at 3090-3100;
Sell short-term gold at 3133-3136, stop loss at 3145, target at 3100-3080;
Key points:
First support level: 3073, second support level: 3062, third support level: 3050
First resistance level: 3100, second resistance level: 3116, third resistance level: 3136

XAU/USD 08 April 2025 Intraday AnalysisH4 Analysis:
-> Swing: Bullish.
-> Internal: Bullish.
Analysis and bias remains the same as analysis dated 04 April 2025.
Since last analysis price has printed a bearish CHoCH which is the first indication, but not confirmation of bearish pullback phase initiation.
Price is now trading within an established internal range.
Intraday Expectation:
Price to trade down to either discount of internal 50% EQ, or H4 demand zone before targeting weak internal high priced at 3,187,835
Note:
With the Federal Reserve's dovish stance and persisting geopolitical uncertainties, heightened volatility in Gold is expected to continue. Traders should proceed with caution and adjust risk management strategies in this high-volatility environment.
Price could also be driven by President Trump's policies, geopolitical moves and economic decisions which are sparking uncertainty.
H4 Chart:
M15 Analysis:
-> Swing: Bullish.
-> Internal: Bearish.
Price has printed as per yesterday's analysis by targeting weak internal low and printing a bearish iBOS.
Price has subsequently printed a bullish CHoCH (I mentioned in yesterday's analysis bullish iBOS in error) indicating bullish phase initiation.
Price is now trading within an established internal range and appears to be stuck in between close supply and demand zones where we could see extended rangebound conditions.
Intraday Expectation:
Price to continue bullish, react at either premium of internal 50% EQ, or M15 supply zone before targeting weak internal low priced at 2,956.565
Note:
With the Federal Reserve maintaining a dovish stance and ongoing geopolitical tensions, volatility in Gold prices is expected to remain elevated. Traders should exercise caution, adjust risk management strategies, and stay prepared for potential price whipsaws in this high-volatility environment.
Trump's tariff announcement will most likely cause considerably increased volatility and whipsaws.
M15 Chart:

XAU/USD(20250404) Today's AnalysisMarket news:
Countermeasures from many countries against the United States - ① It is reported that Europe will slow down the pace of tariff retaliation; EU member states will vote on countermeasures against US steel and aluminum tariffs on April 9; ② Macron said that the response to US tariffs will be larger than before, and called on French companies to suspend investment in the United States. France may plan to impose retaliatory tariffs on large US technology companies. ③ Canadian Prime Minister Carney: Canada will impose a 25% tariff on all cars imported from the United States that do not comply with the US-Mexico-Canada Agreement.
Today's buying and selling boundaries:
3111
Support and resistance levels
3224
3182
3155
3068
3044
2999
Trading strategy:
If the price breaks through 3155, consider buying, the first target price is 3182
If the price breaks through 3111, consider selling, the first target price is 3068

How will gold perform after the super rollercoaster market?Gold's 1-hour moving average still shows signs of turning downwards. Although gold bulls have made a strong counterattack, it is also because of the risk-aversion news that stimulated a retaliatory rebound. However, gold continued to fall after rising, and gold began to return to volatility. In the short term, gold is supported near 3100. If gold falls below the support near 3100 again, then gold shorts will still have an advantage in this war. Overall, the impact of today’s non-agricultural data is expected to be dim. What is more important is the stimulation of the news. However, it may be noted that if gold holds the 3100 mark for a long time, then gold is expected to fluctuate upward above 3100.
Trading idea: short gold near 3115, stop loss 3125, target 3100
The above is purely a sharing of personal views and does not constitute trading advice. Investments are risky and you are responsible for your profits and losses.
