Gold-----sell near 3350, target 3320-3300Gold market analysis:
The gold weekly candlestick pattern is a tombstone. The previous strong trend has turned into a weak trend after the high and low. Has the weekly selling come out? In fact, the historical weekly line has hit the top and fallen back three times, and there has been no big drop or deep drop. The long-term trend is still buying. The short-term adjustment has not changed the long-term buying trend. The international situation is not very clear, and it is difficult for gold to fall deeply. We are just a short-term trader. We need to follow. This week's operation idea is to follow the selling, or rebound selling. In addition, this week is a super data week, and buying and selling games will be inevitable. This week there are non-agricultural employment data and the Federal Reserve's interest rate meeting resolution, each of which can make the market magnificent. The daily K has entered its bottom support. Selling near 3300 needs to be avoided. These positions are all buying counterattack positions. In the rebound of the Asian session, we first focus on the suppression near 3350. This position is the K-intensive area of the bears, the K-line pattern suppression, and the daily moving average suppression position. Consider selling when the multi-layer suppression is close. I estimate that it will enter the repair at the beginning of this week, and wait for the data to bring direction later. Those who like to swipe back and forth can also find a good rhythm to sell long-term and buy short-term.
Support 3320, strong support 3306-3300, pressure 3350 and 3357, the watershed of strength and weakness of the market is 3350.
Fundamental analysis:
The latest news is that the United States and the European Union have reached a 15% tariff agreement, which overall supports the US dollar and suppresses gold. In addition, this week, pay attention to ADP employment data, non-agricultural employment data, and the Federal Reserve's interest rate decision and speech.
Operational suggestions:
Gold-----sell near 3350, target 3320-3300
Goldmining

XAU/EUR Bear Raid – High-Risk, High-Reward Short!🔥 XAU/EUR GOLD HEIST – BEARISH BREAKOUT ALERT! 🚨💰
🌟 Greetings, Market Pirates & Profit Raiders! 🌟
(Hola! Oi! Bonjour! Hallo! Marhaba!)
🤑 TRADE IDEA: XAU/EUR (Gold vs. Euro) – BEARISH SWING PLAY
Based on the 🔥Thief Trading Style🔥, we’re plotting a strategic heist on Gold! Our analysis signals a short entry with high-risk, high-reward potential. The market is oversold, consolidating, and primed for a reversal trap—bullish traders are about to get ambushed!
🎯 TRADE SETUP (SWING/DAY TRADE)
📉 ENTRY:
"The Heist Begins!" Wait for Neutral Zone breakout near 2800.00 (Bearish confirmation).
Pro Tip: Place sell-stop orders above neutral OR sell-limit near swing highs/lows (15-30 min timeframe).
📌 Set an ALERT! Don’t miss the breakout moment.
🛑 STOP LOSS:
"Stop right there, cowboy! 🤠"
If using a sell-stop, set SL only after breakout (don’t get faked out!).
Thief SL Zone: 2870.00 (4H swing high).
⚠️ Adjust based on your risk & lot size! (Your money, your rules—but trade smart!).
🎯 TARGET:
2720.00 (or escape early if momentum fades).
🚨 CRITICAL ALERTS:
📰 News = Volatility! Avoid new trades during major releases.
🔒 Lock profits with trailing stops—don’t let winners turn to losers!
📉 Market Context: Bearish trend fueled by .
💥 BOOST THIS HEIST! 👊
🔥 Like & Boost to fuel our next Thief Trading raid!
🚀 More profitable setups coming—stay tuned!
(Disclaimer: Trade at your own risk. This is not financial advice.)

Gold accumulates and breaks through 3350 points
⭐️Personal comments:
Gold price rebounded around 3350. There was no important news and bank holidays in the US session on Friday, so it rebounded in the short term
⭐️Set gold price:
🔥Sell gold area: 3365-3367 SL 3372
TP1: $3355
TP2: $3342
TP3: $3330
🔥Buy gold area: $3311-$3313 SL $3306
TP1: $3325
TP2: $3338
TP3: $3350

Gold Miners Stocks Go 'The Rife Game' in Town. Here's WhyGold mining stocks have emerged as one of the top-performing asset classes in 2025, driven by a combination of surging gold prices, improved profitability, and shifting investor sentiment.
Here’s fundamental and technical analysis of the key factors behind this outperformance, by our @PandorraResearch Super-Duper Beloved Team :
Record-High Gold Prices Fuel Margins
Gold prices surpassed $3,000 per ounce in March 2025 for the first time in history, marking a 14% year-to-date increase. This rally stems from:
Safe-haven demand amid geopolitical tensions, economic and political uncertainty including U.S. trade policy volatility.
Central bank buying , particularly by China, India, Turkey, and Poland, to diversify away from the U.S. dollar.
Anticipated interest rate cuts , which reduce the opportunity cost of holding non-yielding assets like gold.
Higher gold prices directly boost miners’ revenues.
For example, the NYSE Arca Gold Miners Index NYSE:GDM returned nearly 30% YTD by early March, outpacing both physical gold OANDA:XAUUSD (+14.5%) and the S&P 500 SP:SPX (-3.8%). Companies like Agnico Eagle Mines NYSE:AEM and Wheaton Precious Metals NYSE:WPM reached all-time highs, while ASX-listed miners such as Evolution Mining ASX:EVN (+39.5% YTD) and West African Resources ASX:WAF (+56.6% YTD) outperformed Australia’s broader market.
Margin Expansion and Shareholder Returns
Gold miners are leveraging rising prices to improve profitability:
Stabilized costs for labor, energy, and equipment have widened profit margins.
Free cash flow growth enabled dividend hikes and share buybacks. U.S. Global Investors, for instance, offers a 3.91% annualized dividend yield.
Undervalued stocks: Many miners traded at historically low valuations relative to gold prices, creating buying opportunities. Barrick Gold NYSE:GOLD (P/E 15.6) and Newmont Corp NYSE:NEM (P/E 15.5) remained attractively priced despite gains.
Royal Gold NASDAQ:RGLD , a streaming company with a 60.3% operating margin, exemplifies how non-traditional miners capitalize on gold’s rally without direct operational risks.
Sector-Specific Catalysts
Mergers and acquisitions. Consolidation activity has increased, with larger firms acquiring high-potential projects.
Copper exposure. Miners like Evolution Mining benefit from rising copper demand, diversifying revenue streams.
Institutional upgrades. Analysts at Macquarie and Morgan Stanley endorsed Newmont and Evolution Mining, citing currency tailwinds and free cash flow potential.
Macroeconomic and Market Dynamics
Dollar weakness. A declining U.S. dollar enhances gold’s appeal as a hedge.
Equity market volatility. With the S&P 500 struggling, investors rotated into gold equities for diversification (0.3 correlation to broader markets).
Fiscal deficits. U.S. budget imbalances and inflationary pressures reinforced gold’s role as a store of value.
Outlook for 2025
Analysts project further gains, with gold potentially reaching $3,300 per ounce. Miners are expected to sustain momentum through:
Operational efficiency improvements to align with higher gold prices.
Continued capital discipline , avoiding overinvestment in new projects.
Dividend growth , as seen with U.S. Global Investors’ monthly payouts.
Technical Outlook
The main technical graph for Gold Miners ETF AMEX:GDX indicates on further Long-Term Bullish opportunity, to double the price over next several years, in a case of the epic $45 mark breakthrough.
Conclusion
In summary, gold miners’ 2025 rally reflects a confluence of macroeconomic uncertainty, disciplined capital management, and gold’s structural demand drivers. While risks like cost inflation persist, the sector’s fundamentals and valuation upside position it as a compelling component of diversified portfolios.
--
Best 'Golden Rife' wishes,
@PandorraResearch Team 😎

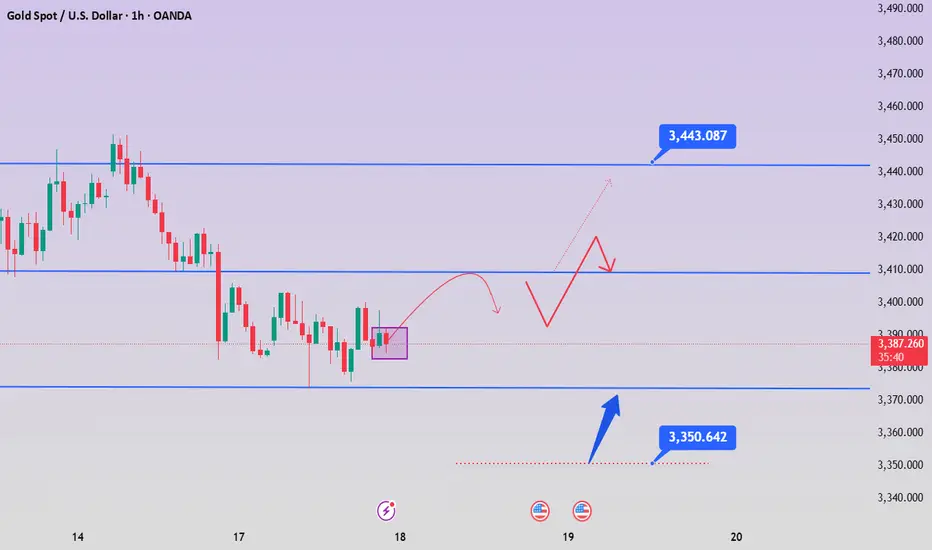
Continue the rally, get ready for gold to return to 3443
⭐️Gold News:
Gold prices (XAU/USD) fell for the second consecutive trading day on Tuesday, retreating from the gains in the early Asian trading hours, which had briefly pushed above $3,400. A slight rebound in the US dollar (USD) continued to put pressure on the precious metal, acting as a major resistance. However, the downside for gold seems limited due to escalating geopolitical tensions in the Middle East and growing market expectations that the Federal Reserve (Fed) will further cut interest rates in 2025.
Meanwhile, the ongoing air conflict between Israel and Iran has entered its fifth day, exacerbating concerns about further escalation in the region. This ongoing geopolitical uncertainty supports demand for safe-haven assets such as gold. Investors also remained cautious ahead of the Federal Open Market Committee (FOMC)'s two-day policy meeting, the outcome of which could affect the next move of non-yielding gold.
⭐️Technical analysis:
Gold price gets liquidity from the support level below: 3385, 3373 completed, short-term downward trend breaks, gold price will soon return to above 3400.
Set gold price:
🔥Sell gold area: 3443-3453 SL 3458
TP1: $3435
TP2: $3422
TP3: $3407
🔥Buy gold area: $3358-$3350 SL $3345
TP1: $3368
TP2: $3376
TP3: $3390
Newmont Corp | NEM | Long at $48.00While gold prices have soared recently, gold mining stocks have lagged. Newmont Corp NYSE:NEM , the world's largest gold mining corporation, may be undervalued if the miners take off to catch up to the gold demand/price. Currently sitting near $48.00 and at a historical moving average that it will need to break to show a true trend reversal, NYSE:NEM is in a personal buy zone. Now, the price may break down at the simple moving average and test the patience of shareholders, but the long game may benefit those who can tolerate the volatility.
Target #1 = $57.00
Target #2 = $71.00

Is this week a chance for gold to break through 3,500?
⭐️Gold Information:
Gold prices surged for the third consecutive trading day on Friday as geopolitical tensions intensified after Israel launched a military strike on Iranian targets, including nuclear facilities and key leaders. The escalation of the situation triggered widespread risk aversion in global markets, stimulating demand for safe-haven assets. As of the time of writing, XAU/USD was trading at $3,431.
Gold surged to a five-week high of $3,446 before giving up gains as traders took profits before the weekend. Geopolitical turmoil, coupled with dovish signals released by recent US inflation data, reinforced expectations that the Federal Reserve may begin to cut interest rates later this year - despite improved consumer confidence. These factors together support the bullish momentum of gold.
⭐️Personal Comment:
Continued military tensions next week are a big driving force for gold prices to continue to break through 3,500
. 🔥 Technical aspects:
Based on the resistance and support levels of gold prices in the H4 framework, the following important key areas can be identified:
Resistance: $3488, $3502, $3562
Support: $3382, $3342

Iran hardens steel, gold rises!
📣Gold news
On Thursday (June 12, 00:00 in the Asian morning, spot gold continued to rise, reaching a high of $3,377 so far, a new high this week. The lower-than-expected US CPI data in May increased the possibility of the Federal Reserve's interest rate cut in September, and the trend of the US dollar and the decline in US bond yields provided a favorable environment for gold prices. At the same time, tensions in the Middle East escalated on Wednesday, and Iran said it would attack US military bases in the Middle East if negotiations broke down. The sharp rise in geopolitical tensions in the Middle East has significantly increased the safe-haven demand for gold. Although the conclusion of the US-China trade agreement has eased some market pressure, the potential impact of tariff policies on inflation still needs to be vigilant. Looking ahead, investors need to pay close attention to Thursday's PPI data and the Fed's policy trends, while keeping an eye on the situation in the Middle East. Driven by risk aversion and expectations of loose monetary policy, the gold market still has room for upside in the short term.
📣Technical side:
Yesterday's CPI data was bullish. After a brief surge, it fell back to below 3330, and then fluctuated. The rise was not strong. Late at night, Trump again called on the Federal Reserve to cut interest rates by 100 basis points. Confidence in the Iran nuclear negotiations decreased. In the next one to two weeks, he will send a letter to trading partners to set unilateral tariffs. Uncertain risks increased. Gold rose in contact with the CPI data. In the short term, the price broke through the 3348-3353 suppression. Consider going low around this position during the day, looking at the 3383-89 suppression, stop loss 3337, pay attention to risks.
💰Strategy Package
Today's trading strategy: long around 3349. Stop loss 3337, take profit 3383
Short around 3370, stop loss 3374, take profit 3350
Trend value trading is the only way for all investors to make profits. There is no shortcut, and don't be lucky. Any investor needs to go through the process of loss, capital preservation, and profit from the beginning of entering the market. The market is definitely not a long-term paradise for speculators. A successful speculation does not mean that it can be successful from beginning to end. Only stable and continuous profits can make a person successful. There must be rules here. If you don't break the rules, you won't be eliminated.

Affected by tariffs, gold prices rebounded to above 3,300
Gold finally broke the calm of the past and resumed its upward trend. What happened? This is also thanks to President Trump, who imposed tariffs again over the weekend, and there was also news of air strikes. The combination of the two directly broke the calm of gold prices in the past.
So where can this wave of gold go? Technically, gold 1-hour cycle, maintained fluctuations around 3,348, and the support line is expected to be around 3,330.
Our strategy today is also very simple. As long as the gold price retests around 3,360-3,350, I will go short. Which specific position can stop profit? I will tell my VIP.

Gold rebounds in the US market and continues to be short!
📊Comment analysis
Gold rose yesterday under the stimulus of risk aversion, so gold did not continue to rise today, which means that the risk aversion sentiment of gold has been digested, and the 1-hour moving average of gold has also begun to turn downward and has not crossed upward, so the momentum of gold shorts has begun to increase, and gold rebounds and continues to be short. After gold surged, it has been under pressure at the 3310 line and cannot break through. Therefore, gold rebounds in the US market and continues to be short at highs under pressure at 3310.
💰Strategy Package
US trading operation ideas:
Gold 3304-3310 short, stop loss 3315, target 3280-3270-3260;
⭐️ Note: Labaron hopes that traders can properly manage their funds
- Choose the number of lots that matches your funds
- Profit is 4-7% of the capital account
- Stop loss is 1-3% of the capital account

Gold is about to reach the shorting zone
The tariff policy against Europe and Apple was temporarily shelved last Friday due to the decline in the credibility of the Trump administration, which failed to push gold prices up this week. Instead, gold prices continue to fluctuate within the downward channel. Currently, the focus is on the resistance level of $3,325-3,335, and shorting can be attempted near this level.
Pay close attention to whether the support level of $3,280 and the resistance level of $3,365 are broken.

Gold hits around 3280, please go long in the short term
📌 Driving Events
Gold prices fell more than 0.50% on Monday as demand for safe-haven assets decreased after U.S. President Donald Trump announced a postponement of tariffs on the European Union. Trading activity remained subdued as the U.S. and UK markets were closed for public holidays. As of this writing, the gold/dollar exchange rate was around $3,294. Trump issued a statement on Sunday, postponing the date of the 50% tariff on EU goods to July 9, and market sentiment improved. As a result, gold prices came under pressure and fell after a sharp rise of 4.86% last week (the strongest weekly performance since early April)
📊Commentary Analysis
Focus on the support level of 3285/80. If this area is touched for the first time, go long
💰Strategy Package
🔥Selling area: 3345-3350 SL 3355
TP1: $3333
TP2: $3325
TP3: $3308
🔥Buying area: $3280-$3285 SL $3275
TP1: $3312
TP2: $3330
TP3: $3345
⭐️ Note: Labaron hopes that traders can properly manage their funds
- Choose a lot size that matches your funds
- Profit is 4-7% of the fund account
- Stop loss is 1-3% of the fund account
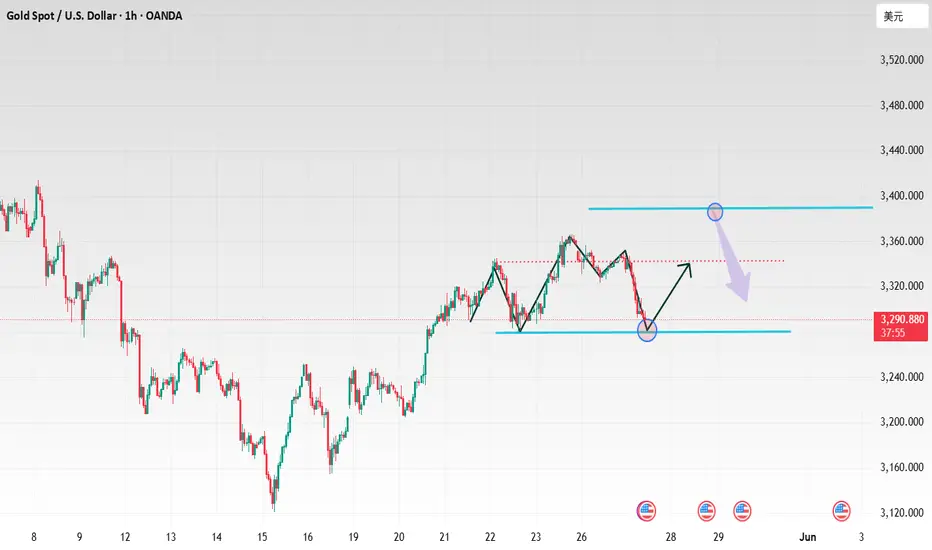
Gold fluctuates at high levels, long and short profit ideas
📌 Driving events
On Sunday, U.S. President Donald Trump announced that plans to impose 50% tariffs on the European Union would be postponed until July 9, easing concerns about an imminent escalation in trade hostilities. This development reduced immediate risk aversion in the market, putting pressure on gold prices.
Nevertheless, investors' attention now turns to the FOMC minutes released on Wednesday, which may further clarify the Fed's monetary policy outlook. At the same time, market participants will continue to pay attention to trade negotiations between the United States and Japan and other major economies. Any new tensions or setbacks in these negotiations could quickly restore demand for gold as a protective hedge.
📊Comment Analysis
Gold prices fell slightly after the official announcement of the tariff extension and continued to climb
💰Strategy Package
🔥Selling area: 3388-3390 SL 3395
TP1: $3376
TP2: $3363
TP3: $3350
🔥Buying area: $3301-$3299 SL $3294
TP1: $3312
TP2: $3325
TP3: $3338
⭐️ Note: Labaron hopes that traders can properly manage their funds
- Choose the number of lots that matches your funds
- Profit is 4-7% of the capital account
- Stop loss is 1-3% of the capital account

Trump's tariff measures trigger market shocks
📌 Driving events
Last Friday, as Trump threatened to raise tariffs on the European Union to 50%, and also pointed the finger at smartphone manufacturers such as Apple and Samsung, the market's risk aversion sentiment suddenly heated up, and spot gold closed up nearly 2% on the day.
On Sunday local time, US President Trump announced after a call with European Commission President von der Leyen that he would extend the deadline for the European Union to face 50% tariffs to July 9. Trump told reporters on his way back to Washington on Sunday: "We had a very pleasant call, and I agree to postpone the deadline."
Bloomberg analysis said that there are signs that US President Trump may relax his radical stance on EU trade, which will affect gold's safe-haven status.
At the geopolitical level, the conflict between Israel and Iran is imminent. The Israeli army's shooting of a diplomatic delegation has triggered international condemnation. Netanyahu has maintained a tough stance in the Israeli-Kazakh conflict; Trump's mediation of a ceasefire between Russia and Ukraine has been frustrated. The Wall Street Journal revealed that when he spoke with the European side, he said that Putin believed that the Russian army was "winning", which contradicted his public statement. This week, the market focus shifted to the Fed's policy minutes, the Bank of Japan's rate hike expectations, European and American economic data, and OPEC+'s production increase plan. The interweaving of trade frictions, debt risks and geopolitical conflicts has kept the uncertainty of the global pattern high.
📊Comment Analysis
The first support level for gold prices may be in the range of $3290-3300/ounce. If it falls below the above support, the next support for gold prices will be $3250/ounce and $3200/ounce (50-day moving average). On the upside, the first resistance for gold prices is $3370/ounce. If this obstacle is overcome, the next resistance for gold prices will be $3430/ounce and $3500/ounce (historical high).
Labaron will digest a series of economic data to be released by the United States this week, such as durable goods and home sales, as well as the consumer confidence index. The U.S. stock market will be closed on Monday due to the Memorial Day holiday.
💰Strategy Package
⭐️SET UP GOLD PRICE:
🔥SELL GOLD zone : 3388- 3390 SL 3395
TP1: $3376
TP2: $3363
TP3: $3350
🔥BUY GOLD zone: $3301- $3299 SL $3294
TP1: $3312
TP2: $3325
TP3: $3338
⭐️ Note: Labaron hopes that traders can properly manage their funds
- Choose the number of lots that matches your funds
- Profit is 4-7% of the capital account
- Stop loss is 1-3% of the capital account

Ready to Rob the Gold Market? XAU/USD Heist Plan Revealed!🌟 Gold Heist Masterplan: XAU/USD Profit Raid 🚀💰
Thieves and profit hunters! 🤑 Ready to raid the XAU/USD gold market? This *Thief Trading Style* fuses sharp technicals with key fundamentals for a slick long-entry plan targeting the high-stakes Red Zone. Let’s grab those gains! 📈🎯
**Entry Plan 📈**
Strike when the breakout hits! Watch for a Moving Average crossover at 3380.00 to jump in for bullish profits. 🔔
- Set *buy stop orders* above the MA for breakout trades.
- Prefer pullbacks? Place *buy limit orders* at recent swing low/high on 15M or 30M timeframes.
📌 *Tip*: Set a chart alert to catch the breakout candle in action! 🚨
**Stop Loss 🛑**
Guard your stash with a *Thief SL* at the recent 4H swing low/high (3200.00).
Tweak your SL based on risk tolerance, lot size, and open orders. Stay alert! 🔍
**Profit Target 🎯**
Aim high for 3680.00, or lock in gains early to avoid overplaying your hand. Stay disciplined! 💪
**Scalper’s Edge 👀**
Scalpers, stick to quick long-side trades. Big players can dive in now; smaller traders, ride the swing with a trailing SL to secure profits. 💰
**Market Pulse 💵**
XAU/USD is charging bullish, driven by macro trends, COT data, sentiment, quantitative signals, and intermarket flows. Keep your eyes on fast-moving fundamentals! 🌎📊
**Latest Market Snapshot (UTC+1, May 21, 2025)**
- *Forex (XAU/USD)*: Hovering around 3155.00, testing key 200-day SMA support after a 2%+ sell-off.
- *COT Report (May 16, 2025)*: Non-commercial net long positions up by 5,200 contracts, reflecting strong bullish sentiment among speculators.
- *Commodities & Metals*: Gold stabilizing near monthly lows; oil prices steady, supporting commodity-linked currencies.
- *Indices & Crypto*: Risk-on sentiment in global indices aligns with bullish XAU/USD bias; crypto inflows up $785M last week.
**Trading Caution 📰**
Steer clear of new trades during major news to avoid volatility spikes.
Use trailing stops to protect open positions and lock in profits. 🚫
**Power Up the Heist! 💥**
Smash that Boost Button to fuel our trading crew! 🤝 With the *Thief Trading Style*, we’re snatching profits daily. Watch for the next plan! 🐱👤🚀
Happy trading, and let’s stack that cash! 💸🎉

Barrick Gold Corporation ($ABX): Golden Opportunity or Risky
Barrick Gold Corporation (ABX): Golden Opportunity or Risky Prospect? 🏆💰
1/10
Barrick Gold TSX:ABX has seen a solid financial performance recently. EPS for the last quarter hit C$0.42, with next quarter estimates at C$0.63. They beat estimates 75% of the time in the past year. 📈
2/10
Analysts are bullish! The average price target is C$33.57, implying a potential upside of 50.13% from the current C$22.36 price. Strong Buy ratings dominate: 10 Buy, 2 Hold. 🔍 What do analysts know that the market doesn’t?
3/10
However, ABX is facing operational challenges. A suspension in Mali due to government intervention highlights geopolitical risks in mining. 🛑 Regulatory challenges are part of the gold mining game.
4/10
Stock price check: ABX currently trades at C$23.15. That’s 20.94% below its 52-week high of C$29.28 but 21.59% above its low. What does this tell us? Room for recovery, but risks loom. 📊
5/10
Valuation time! Compared to sector peers, Barrick offers an attractive price level, especially given the 50% upside target. Analysts love undervalued plays like this, but what about the risks? 🤔
6/10
Strengths: Barrick operates across multiple countries, ensuring diversified production. That’s crucial in a volatile gold market. 🌍 Diversification is a key defensive strategy here.
7/10
Challenges: High operational costs are always a concern. Pair that with political instability, like the Mali suspension, and ABX faces a steep uphill climb. 🏔️ How much risk are you willing to take on?
8/10
Opportunities: Expansion is always on the table. With gold prices looking stable, Barrick could capitalize on new projects or mines. But timing matters in this market. ⛏️
9/10
Threats: Regulatory and political risks never sleep. Changes in mining laws or political unrest can hit Barrick hard—Mali’s situation is a prime example. Always know your risks. ⚠️
10/10
What’s your take on Barrick Gold TSX:ABX ? Will it strike gold again? Vote here! 🗳️
Buy for the long term 📈
Hold and watch growth 🔄
Too risky, avoid 🚫

CPI-Inflation Assessment, Gold Accumulation
📌 Drivers
In geopolitics, Indian Prime Minister Narendra Modi said on Monday that military action against Pakistan was only paused, warning that future actions would depend on Islamabad's position. Meanwhile, Ukrainian President Volodymyr Zelensky expressed his willingness to meet with Russian President Vladimir Putin later this week after U.S. President Donald Trump called on Zelensky to "immediately" accept an invitation to a peace summit in Turkey. These developments have heightened geopolitical risks, which could boost demand for safe-haven assets such as gold, thereby enhancing the appeal of gold amid continued global uncertainty.
📊Comment Analysis
CPI evaluates the inflation level of the US economy, and the price of gold continues to strive to maintain a price range of around 3200
💰Strategy Package
🔥Selling gold area: 3281-3283 SL 3288
TP1: $3270
TP2: $3260
TP3: $3250🔥
Buying gold area: $3176 - $3174 SL $3169
TP1: $3185
TP2: $3198
TP3: $3210⭐️
Labaron believes
Guaranteeing the principal is the bottom line for survival, controlling risks is the armor for survival, earning profits is a stage medal, and long-term stable and continuous profits are the only proof that can finally stand up from the sea of corpses and blood.

Gold prices bottomed out and rebounded, market trend analysis.Analysis of gold trend: From the perspective of market sentiment, interest-free gold as a safe-haven asset has performed strongly this year, with prices soaring by nearly $700 and hitting record highs several times. However, the recent optimistic expectations of easing global economic and trade relations have boosted market risk appetite, and the equity market has generally performed positively. Some funds have flowed out of safe-haven assets such as gold and turned to risky assets, which is also the main psychological factor under pressure on gold prices. If market risk appetite continues to improve, global economic and trade relations further ease, and the US dollar strengthens, gold prices may face greater downward pressure. From a technical point of view, the gold price needs to effectively fall below the $3,265-3,260 range in the short term before a larger correction downward may be confirmed. Once confirmed to fall below, the gold price may quickly fall to the 50% retracement level near $3,225, further pointing to the $3,200 mark. If $3,200 is lost, it will suggest that gold may have peaked in the short term.
Gold opened higher in the Asian session on Monday and continued to fall last week after hitting 3336. The idea of the Asian session was to directly bearish at the analysis point of 3277. After hitting the lowest point of 3268, it fluctuated upward. The European session also fell to 3273 and then rebounded. The highest point in the US session just reached 3336 again, a standard bottoming and rebounding trend. Since it is an adjustment structure, let's re-analyze the idea. The gold price fell at 3500 and rebounded at 3260 last Wednesday. The rhythm was volatile. It rebounded above 3260 many times below and did not cross the first rebound high of 3367 above.
Today, we mainly focus on the closing price. If it stands firmly at the 3313 line, we will adjust our thinking on Tuesday. On the contrary, it will fall back after encountering resistance at 3336, today's opening high, and go to 3278. On Tuesday, we will continue to look at the idea of swinging and falling. Now it is the end of the market, and the market is also falling from a high.

Gold shocks pull the trend towards the bearish side!Gold market trend analysis:
Gold technical analysis: You should have seen the exaggeration of gold, right? Gold has also experienced several major ups and downs in history, but this time is definitely one that can be recorded in the history books. The daily lines in the past few months are very exaggerated, and the rise and fall range is unprecedented. Just today's Asian market, a simple dive is dozens of points. This is the market. The market is always right. We need to respect it the most, rather than blindly look at it subjectively. Surviving in such a big market is the most important thing. Many times, the fluctuation of gold is basically not related to technicality. We try to follow the direct pursuit mode in operation, and we can catch big profits in such a big market. Last week, the weekly line closed with a big tombstone, the weekly line top appeared, and the air force appeared. In May, gold will at least adjust to around 3,000.
The above is the 4-hour pattern, which is repairing below the moving average. If the bulls break 3370 again, there is a possibility of rising again. Otherwise, gold will adjust deeply again. This wave of adjustment is at the weekly level. The daily pattern is also turning into a peaking mode. Note that the rise and fall of gold is not based on technical aspects, but more on fundamentals and big data, as well as the impact of tariffs. Without these influences, we will be bearish this week. If the decline of the big C wave continues, the target will be 3230 (the half point of the entire April rebound) in turn. 3165 is the Fibonacci 61.8 position of the callback and also the previous high point, which is easy to form a rebound. Today's gold focuses on two major suppressions, one is the hourly suppression around 3300, and the other is 3315 and 3328, both of which are opportunities for air forces. On the whole, today's short-term operation strategy for gold is to short on rebounds and to buy on pullbacks. The upper short-term focus is on the 3298-3300 resistance line, and the lower short-term focus is on the 3265-3260 support line. Friends must keep up with the rhythm. It is necessary to control the position and stop loss, set stop loss strictly, and do not resist single operation. The specific points are mainly based on real-time intraday trading. Welcome to experience, exchange real-time market conditions, and follow real-time orders.

Gold short position wins streak, waiting to continue shortingThe 1-hour moving average of gold continues to turn downward. If a downward dead cross pattern is formed, then there is still room for gold bears to fall. Gold is under pressure to fall near the resistance line of 3340.
Gold's current rebound is not very strong. Although it seems to rebound a lot every time, that is because the market volatility has increased. Gold is still a bearish trend in the short term, and the rebound continues to be bearish.
Trading ideas: short gold near 3338, stop loss 3350, target 3318

Gold adjusts at a high level, continues to be short on rebound
Gold risk aversion eased, and gold fell directly. After gold fills the gap, if gold cannot continue to rise, then the gold shorts will continue to exert their strength. The current gap resistance of gold is at 3382, but the market is volatile now. If the gap is filled, gold may have momentum to repair in the short term, so you can pay attention to the suppression of 3400.
Trading ideas: Short gold near 3400, stop loss 3410, target 3370

Gold breaks out strongly and rises, is it an opportunity?The 1-hour moving average of gold continues to form a golden cross and is in a bullish arrangement. Gold rose directly at the opening, breaking through the short-term downward trend and directly breaking through the previous high of 3357. Therefore, the short-term 3357 of gold has formed support. If gold falls back to 3357, continue to buy on dips. However, it should be noted that if gold falls below 3357 again, the adjustment range of gold may increase.
Gold has been rising wildly under the stimulation of recent risk aversion. In this kind of emotional market, we can only follow the trend, because gold continues to hit new highs and no one knows where it will rise. However, don’t easily chase the highs. After the fluctuations increase, the magnitude of each correction will not be small.
Trading idea: Go long near gold 3357, stop loss 3347, target 3380

GOLD WEEKLY CHART MID/LONG RANGE ROUTE MAP UPDATEDWeekly GOLD Analysis: 17th February 2025
Hello Traders,
Here’s a weekly chart analysis of GOLD, offering an in-depth look at recent market trends and future outlook. Since October 2023, our consistent tracking has achieved 100% target accuracy, as shown by the Golden Circle markers on the charts. Let’s break down the highlights and what’s next.
Recap of Last Week’s Successes
Weekly Chart Highlights:
* EMA5 crossed and settled above Entry ✅ 2735 reached
* Bullish Target TP1: 2877 ✅ Achieved
* GoldTurn Levels at 2875 activated twice ✅ Reached
What’s Next for GOLD? Bullish or Bearish?
After hitting ENTRY LEVELS at 2735 and TP1 2877, we saw a small close above 2877 last week, leaving 3018 open as a potential target. We mentioned that an EMA5 lock would confirm this movement.
While EMA5 hasn’t locked yet, the close from last week provided a solid push upward, gaining over 500 pips. The long-term gap remains open, with more movement likely after last week’s candle body close.
Key Level: 2735 remains a critical zone.
GoldTurn Levels at 2875 and 2735 are active, and the price may revisit these levels before bouncing back to reach TP1 and beyond.
Recommendations & Strategy:
* Focus on EMA5: Watch its behavior around 2877 for key signals on short- and long-term trades.
* Support Levels: GoldTurn levels at 2875 and 2735 are vital for identifying reversal points and prime dip-buying opportunities.
* FVG Support: A range between 2835 and 2850 is also supportive.
For precise entry and exit points, check our daily, 12H, 4H, and 1H analyses for clearer market guidance.
We’ll continue to provide daily updates, insights, and strategies on our TradingView and YouTube channels every Sunday. Don’t forget to like, comment, and share to support our work and help others benefit!
The Quantum Trading Mastery
