Gold prices will return to highs again. Buy gold nowLast night, the price of gold broke through a new high again, reaching the 2287 line. As expected last night. Then it continued to fluctuate until the European market opened because prices were on the higher side. Gold made a technical repair after the start of the European session. The price of gold plummeted by about $20 from 2287. The current price is 2268.
News: Risk aversion caused by the war in Gaza continues to ferment. Short-term bulls are still strong. gold. Dollar. as a hedging product. They all continue to attack.
Trend: Overall, buying at low prices is still the main trend. It is not difficult to see from the above picture that the short-term repair is only for a day. The general cyclical trend is still upward. From an hourly perspective, the current support position for technical repair is located at the 2259-2264 line. Combined with MA technical indicators, there is a certain pressure for long-short conversion at 2270. Once the 2270 position is established, it will inevitably rebound within the day.
During the day, buying is still the main focus. Today we focus on the impact of the announcement of ADP news. On Friday, we need to focus on the release of (U.S. non-farm payrolls after seasonally adjusted March).
trade:
Gold price is at 2263-2268 to buy
tp2283-2287
SL2254
Pay attention to controlling risks and positions during operation. Stay concerned.
Goldmining

Sell gold and wait for a sharp decline.
The price of gold is too high for the market price. A pullback is needed to get the market moving higher again. And I was the one who sold gold at high levels.
2158-2163 sell gold
tp2243-2248
sl2270
I will continue to update if there are opportunities to continue buying in the future. Stay concerned.

XAUUSD: 28/3 Today’s Analysis and StrategyGold suddenly fell rapidly in the short term on Thursday, with the London gold price just falling below $2,190. Governor Waller, who has been the recent benchmark for Fed policy, said late Wednesday local time that he believed there should be no rush to cut interest rates after inflation data strengthened in the first two months of this year. Stimulated by Waller's latest remarks, the U.S. dollar index continued to rise in the short term, which put pressure on spot gold to decline.
The yen fell sharply to its lowest level since 1990, before rebounding sharply after Japanese officials met to discuss market conditions and signaled preparations for intervention. Spot gold prices climbed sharply by $16 on Wednesday as investors awaited key U.S. inflation data later this week, which could provide more clues on the Federal Reserve's policy path.
Investors are now awaiting key U.S. inflation data later this week, which could provide more clues on the Fed's policy path. This trading day will also see changes in the number of initial jobless claims in the United States, the final value of the fourth quarter GDP of the United States, and the final value of the University of Michigan Consumer Confidence Index in March.
Gold technical analysis
Daily resistance is 2250, support below is 2177-2145
Four-hour resistance is 2200, support below is 2150
Gold operation suggestions:
Judging from the daily analysis, today's support at the bottom will focus on 2178, and the pressure at the top will be 2200-2210. Today, we will rely on this range to sell high and buy low. The watershed between short-term long and short strength is 2170. Only if the daily level closes below this level will the downward adjustment space be opened. Otherwise, time will continue to be exchanged for space and the oscillations in the long and short range will continue.
SELL:near 2210
SELL:near 2178
Technical analysis only provides trading direction!

Gold price will continue to climb to 2202-2207
Long trading range
Gold remains strong.
28/3 is mainly buying.
2192-2190buy
Tp2202-2207
Sl2183-2186
Related Products: MCX:GOLD1! FXOPEN:XAUUSD VELOCITY:GOLD OANDA:XAUUSD ACTIVTRADES:GOLD TVC:GOLD CAPITALCOM:GOLD NCDEX:GOLD

XAUUSD: 1/3 Friday market analysis and strategyGold hit a one-month high of 2050 on Thursday and closed near 2044. U.S. inflation data was in line with expectations and the number of Americans filing for unemployment benefits increased slightly, providing upward momentum for international gold. Traders' attention turned to further comments from Federal Reserve officials for clues about a rate cut.
The latest data were in line with expectations after recent strong inflation data, which showed the U.S. personal consumption expenditures (PEC) price index rose 0.3% in January and the core PCE price index rose 0.4%, putting pressure on the dollar. This makes gold cheaper for investors holding other currencies.
At the same time, U.S. Treasury yields fell, increasing gold's appeal, and the market adjusted expectations for a June interest rate cut. Although gold has traditionally been considered an inflation hedge, higher interest rates to control price increases would discourage investment in gold because it does not pay interest.
Gold technical analysis
Daily resistance is 2053, lower support is 2015
Four-hour resistance 2053, lower support 2038-26
✅Gold operation suggestions:
Gold bulls ended the multi-day oscillation yesterday and finally ushered in its first breakthrough. After the bulls broke through 2040, they directly touched near 2050 and have been oscillating around 2040. From the current point of view, short-term gold price support focuses on the hourly neckline. It is near 2038. The upper pressure is focused on the vicinity of 2053. The short-term bullish strong dividing line has moved to 2038. The daily level has not broken through and stood above 2053. We cannot fully believe that the bulls will return. Let’s first look at the operation in the 2053-2038 range.
Pay attention to the dividing line between long and short in 2038
SELL:near 2053
SELL:near 2038
BUY:near 2038
Technical analysis only provides trading direction!

XAUUSD: 30/1 Today’s Analysis and Trading StrategyDaily pressure 2040-2053, lower support 2000-1966
Four-hour pressure is 2040, support below is 2020
One-hour pressure is 2040, support below is 2032
Operational suggestions: Although bulls currently have an upward trend, they still encounter resistance after all and have not achieved substantial results. The upper pressure in the short term remains at 2040-43, which is also a key point during the day. The support below will remain at the integer level of 2000. If the daily level is above 2040, the bulls are strong but it does not mean that the bulls will break out. Above the 2053 mark, the market will turn bullish.
SELL:near 2050
SELL:near 2040
SELL:near 2020
BUY:near 2000
Technical analysis only provides trading direction!

Gold price bounces off, downside remains bets easeHere is what you need to know on Thursday, January 18:
Technical Analysis: Gold price finds a temporary support near $2,000
Gold price attempts a firm-footing near psychological support at $2,000 amid a nominal decline in the US Dollar Index. The near-term demand for the precious metal has turned bearish as it has slipped below the 50-period Exponential Moving Average (EMA), which trades around $2,017. The higher-high-higher-low formation in the Gold price is over and market participants could utilize pullbacks for building fresh shorts.
The 14-period Relative Strength Index (RSI) has dropped to near 40.00. If the RSI fails to sustain above 40.00 levels, a bearish momentum will get triggered.
•Gold price discovers bets near $2,000 but remains on backfoot amid easing Fed rate cut hopes.
•Stubborn US inflation and robust Retail Sales data favour a maintenance of hawkish interest rate stance.
•Market participants will focus on Fed Bostic’s commentary ahead.
Gold price (XAU/USD) has executed a short-term recovery move in the midst of a persistent downtrend. Gold price printed a fresh monthly low near the psychological support of $2,000 on Wednesday, then bounced.
Yet despite the rebound, the precious metal remains on the backfoot as investors continue to worry about when the Federal Reserve (Fed) will start its long awaited rate-cut cycle. The hopes of an early rate-cut decision from the Fed are easing as the last leg of inflationary pressures in the United States is turning out significantly more stubborn than previously thought, due to robust consumer spending and steady labor market conditions.
Amid an absence of front-line economic indicators, market participants are expected to shift focus towards the first monetary policy meeting of the Fed, which is scheduled for January 31. The Fed is widely anticipated to keep interest rates unchanged in the range of 5.25-5.50%. Investors will keenly focus on how the Fed proposes to make three rate cuts of 25 basis points (bps) each in 2024, as projected in the December monetary policy meeting.
Daily Digest Market Movers: Gold price finds an interim support as US Dollar corrects
•Gold price discovers an intermediate support near the psychological $2,000 level after an intense sell-off.
•The near-term demand is still downbeat as uncertainty about an interest rate cut from the Federal Reserve in March has deepened.
•Trades have pared bets supporting a rate cut in March due to resilience in the US economy.
•Bets supporting an interest rate cut of 25-basis points (bps) have increased slightly to 61% but are still below the 75% recorded last week, as per the CME Fedwatch tool.
•Market expectations for early cuts from the Fed have been pushed back as price pressures in the US economy remained stubborn and consumer spending grew strongly in December.
•Upbeat economic indicators have provided room to Fed policymakers to maintain a restrictive monetary policy stance for a longer period than that anticipated by market participants before their release.
•This week, Fed Governor Christopher Waller said the central bank should not rush taking interest rates down as more evidence is needed to ensure that price pressures are returning to 2% in a sustainable manner.
•Christopher Waller advised that the Fed should reduce interest rates “carefully and methodically”, considering resilience in the US economy.
•Meanwhile, the US Dollar Index (DXY) has rebounded after a gradual correction to near 103.20, supported by risk-off market sentiment. 10-year US Treasury yields are maintaining a firm-footing above 4%.
•Later the day, investors will focus on the weekly jobless claims for the week ending December 12 and commentary from Federal Reserve of Atlanta Bank President Raphael Bostic.
•Bostic is expected to maintain a hawkish argument considering stubbornly higher price pressures.
•On Monday, Fed’s Bostic commented that progress in inflation declining towards 2% could slow if policymakers cut interest rates soon.

SSRM: Interesting valuation and chartSSR Mining has a very interesting setup here, both a quarterly and also a daily signal warrant a long entry here. If the quarterly signal pans out, initially we'd target $16.50 by Q4 2020, but eventually, this could make price trigger further quarterly confirmation for bulls, potentially pushing price to even higher levels, circa 28.31.
Free cash flow is an important metric in the mining business, and in the case of $SSRM, it is at a very healthy levels relative to the market cap. This allows them to have sufficient leeway to pay workers (and avoid the problems with the work force South African miners had recently, for instance), expand into new projects and maintain their currently exploited mines, among others.
Going back to the technicals at play, the current correction in the daily timeframe and reaction to quarterly support paves the way for a very high reward to risk long trade. There's a few different ways to decide on a stop loss distance and position sizing, but in general, for equities I try to give them enough room for the trade idea to pan out favorably, before being forced to bail on a trade or being stopped out prematurely.
Best of luck,
Ivan Labrie.

Kinross Gold - 6:1 Long w/ Multiple ConfluencesThe weekly KGC price chart looks juicy for swing traders and position players, or anyone in search of quicker gold-correlated returns than the metal itself offers (+/- 25%).
As always, I strive to render these ideas of mine so obviously that their explanation will require no words, and this forecast is no exception.
My trading tactics - including the beauty of Tradingview and how it makes me look good - are based on identifying the opportunities within VOLUME, VOLATILITY and TREND EXHAUSTION.
This chart was developed on the 1D frame and the entry was made on the hourly, and is here presented in the 1W version to accentuate the Trend Exhaustion Wedge w/in the Fib Space as fully as possible, albeit w/ some loss of detail.
In fact, I generally prefer to trade on lower timeframes, so I execute swing trades like this one directly via my bank, in lieu of a savings account (which is NOT financial advice, by the way). Furthermore, a tighter Stop Loss at $4.71 (instead of the $4.64 shown here) offers a 9:1 Risk-to-Reward ratio.
When it comes to most mining stocks, I tend to rely on pure price action based on tight line-work, with a minimum of indicators. Besides the obvious Harmonic W, a variety of patterns are on display here, including a descending Three Drives followed by an ascending version.
The profit and retracement targets are passively based on Fibonacci ratios, and dynamically based on the VWAPs anchored at the C-point of the harmonic pattern. A volume profile is also anchored there, although it will become less valuable over time on the 1D chart, and is already invisible on hourly charts.
One indicator worth noting, though, is the correlation histogram with First Majestic Silver; the periods of divergence should be especially interesting to lower timeframe prospectors. In fact, especially when I look at mining charts, I prefer to study their correlation either to the underlying asset or, better yet, to some other lesser-correlated asset in the same "genre".
I will discuss both Kinross Gold and First Majestic Silver in forthcoming videos and streams on strategic and/or monetary metals. This will give you an opportunity to see what these charts look like on lower timeframes, and to ask questions.
Until then, be liquid !!!

Gold trend analysis
The role of the Federal Reserve is to keep plundering global wealth, so the U.S. dollar must fluctuate at a high level, at least it cannot collapse and depreciate, so the interest rate hike is suspended, the balance sheet is still shrinking, and the high interest rate is still there. After yesterday’s decline in gold, the current pressure has moved down to the 1905 area. Basically, after breaking through 1940, the support in the densely traded area below is the 1865 position, of course there is a 1880 in the middle
trading signal:
sell 1898-1896 tp1888-1883
Share free trading signals every day, if you need, please join me

Gold: Gold US market 1960 dry air
The market is always full of surprises, which increases uncertainty, but this is also the charm of the market. I believe that everyone has no objection to the bearish view of gold technology today, and it makes the bears uncomfortable, but since the overall position is still short, it is better to give a better point to go short. The gold US market data soared to 1960 and directly went short, and gold fell to make a profit harvest.
Minefield ⛏️💥The VanEck Junior Gold Miners ETF (ticker: GDXJ) has entered a certain minefield here. Our short-trade target zone has already been dealt with and the corresponding high of the turquoise wave (ii) was placed accordingly within said zone. We are now anticipating further impulsive sell-action in accordance with the general bearish trend. If the bulls want to start another comeback though, they should’nt be able to increase the price beyond our still active second sell zone (between $39.33 and $41.67).

Gold 1960 will be the key to choose the directionIt is recommended to go short around 1960, stop loss at 1965, and hold the target at 1950. For long orders, first look at the situation of 1950 support breakout.
Contact me for specific trading signals

Gold trading recommendations for
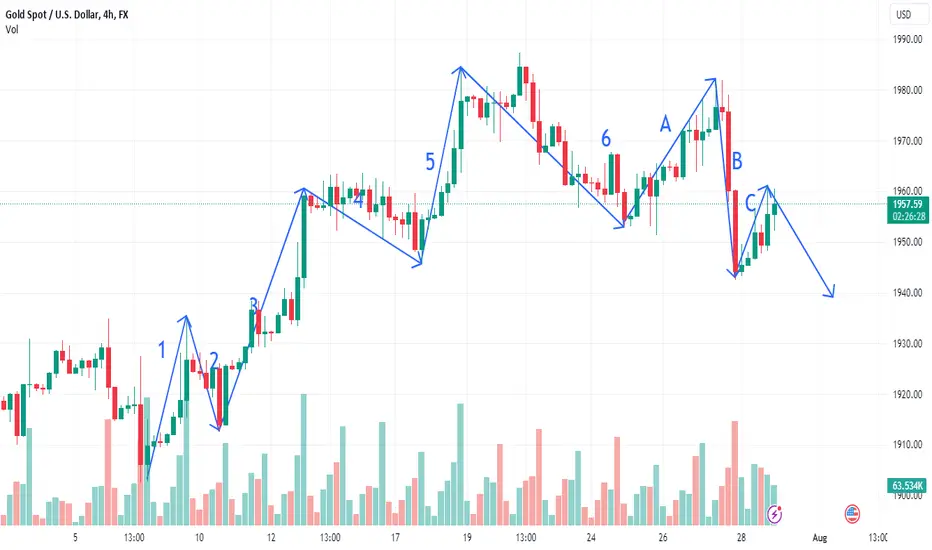
The triple top on the gold weekly chart continues to suppress gold. The daily line is now a positive line, and it is not that kind of big positive line. For the time being, it can only be regarded as a rebound. This wave of gold daily market has gone through five waves of rise, and now it is a big C wave adjustment of ABC adjustment. Is wave C now over? The gold daily line has not even broken through the downward trend line, and the trend line resistance is around 1930. Before it effectively breaks through 1930, we will continue to look at the daily short line, during the decline of the big C wave.
For the time being, gold can see signs of continued rebound in 1 hour, and there is an upward trend line support around 1910, but the daily downward trend line resistance is 1930, and 1930 is an area that has formed resistance many times in the early stage, and no effective upward reversal has been formed. So now 1930 is still very important in the short term. At the beginning of next week, you can sell high and buy low in the 1910-1930 range.
Trading inevitably requires luck in some places and times, but in the long run, good luck and bad luck will balance out. If you want to last for a long time, you must rely on skills and use good principles. How far a person can go depends on who he walks with; how good a person is depends on what kind of friends he has around him; how much a person can achieve depends on who guides him.
Trading strategy for next week:
gold: sell@1930 tp:1910
buy@1910 tp:1930
Next, there will be a lot of trading opportunities for gold, and I will provide you with more signals, don't miss the opportunity to make money!

Technical analysis of gold, how to operate the US market?Looking at gold on the daily line, the relative strength index (RSI) fell to 40, reflecting a bearish bias in the near-term outlook. Gold may face strong resistance at 1940, which is the confluence of the downtrend line and the 100-day moving average. Looking at gold from the 4-hour line, with the relative strength index (RSI) line at 14 recovering from the overbought area, gold prices are approaching the support line from a month ago. A looming bullish crossover on the moving average convergence and divergence (MACD) indicator added strength to gold's corrective rally. On the whole, it is recommended to rebound and short in the evening gold operation!
Gold evening operation strategy:
Empty order strategy: It is recommended to go short at 1932-1934, stop loss at 1941, and target around 1918;
Multi-single strategy: It is recommended to go long at 1918-1916, stop loss at 1910, and target around 1930
Detailed daily trading signals can contact me to get! I wish you all a great and profitable new week

Gold will continue to fall with the trendThrough analysis on Thursday, it is emphasized that gold needs to see weak shocks under the pressure of 1940. The actual highest is at midnight on Wednesday at 1938, and the highest throughout the day is almost around 1933
Therefore, it is impossible to give an effective homeopathic trading space, and the strength of the U.S. unemployment data cannot change the temporary extremely weak state, and the lowest fell to around 1912. Therefore, this trend is very obvious, and gold is extremely weak and weak. So, in the absence of an obvious anti-strength performance, for the time being, gold will still be dominated by high altitudes.
From a technical point of view, after this week's continuous decline, the daily line has continued to fall, and gradually broke the key support point. Brin has opened his mouth, which seems to have formed a weak unilateral. It may fall to the weekly low of 1830. Therefore, under the current circumstances, it is very important not to guess the bottom of the decline, and it is very important to follow the trend. The same is true for the H4 cycle. When Bollinger opened his mouth, the decline was along the 5-day and 10-day moving averages and out of the slow-falling space. Therefore, on Friday, we should also look at the moving averages to suppress the bearish. At the top, focus on the 1918 and 1925 highs. Wait for the adjustment to be completed, suppress the transaction at these two points, and focus on the low point of 1905 and the gains and losses at the 1900 full point below. But it is worth noting that if gold rebounds effectively today and stands above 1925, there may be room for adjustment and shock in the late trading.
6.23 Gold Strategy:
Focus on 1925 from above and still go short if the pressure is not broken, stop loss 6 points, target 1910-1900
Long order is only recommended to try if it does not break 1900
If you often lose money in trading and often fail to grasp the trend, then I can help you very well, please contact me

Gold trading recommendations today
The gold adjustment is coming to an end, a new downtrend is about to start, the rebound relies on the pressure of 1950 to short, and the waterfall is about to appear!
For the trend of gold, from the weekly level to the hourly chart, it has been analyzed countless times! Weekly triple top, historical top! The daily line fell all the way down. Although the current short-term sideways, the rebound is weak, and the pressure above 1970 has not been able to break through!
Yesterday was another downtrend! There are more signs that gold will continue to fall, and 1930 is by no means the current bottom!
Trading straregy:
gold: sell@1950 tp1:1945 tp2:1935
Next, there will be a lot of trading opportunities for gold, and I will provide you with more signals, don't miss the opportunity to make money!

Gold trading recommendations today
Gold rose directly with marginal support yesterday
Looking at the 4-hour cycle, the price of gold is still below the trend line. On Friday, the price of gold touched the downward trend line, and gold plummeted even more, putting pressure on it. It is easy to see that gold is now in a oscillating trend, because the high and low points extend horizontally, and the gold price shuttles back and forth on the moving average, which has ruled out the unilateral trend, and now it is a oscillating trend.
Based on this, I judge that the price of gold is in a volatile market in a downward trend. Sooner or later, gold will fall below and start a plunge mode.
Trading straregy:
gold: sell@1961 tp1:1951 tp2:1946
Next, there will be a lot of trading opportunities for gold, and I will provide you with more signals, don't miss the opportunity to make money!

XAUUSD we see fast rejection 1982 2nd day reject 1983 market and initiating resistance means someone is resisting and initiating .in terms of candle stick all look same absorption it could be consolidation hence confusion lots of people use the words you know as through they mean the same thing ok they are not interchangeable words how ever consolidation is where the market moves into sideways ways patters you can call this support and resistance . market interaction that is taking place in you other words if we see the market go back but up comes this price point we see a substantial amount of volume transacted at the higher price know we see some one sell aggressively sell , we see buyers filled 1974 after rejecting multiple times tend to get a little bit of a continuation type flow momentum type flow higher test the range sometimes price is leading the move some times there are other factors this flow someone has to come in and do something in prices irrelevant sometimes there is volume and someone comes in and say well i need to execute a hundred thousand contract you get specific type of movement
sometimes technical are relevant sometimes the fundamental relevant its important we have to navigate different areas all so important to note when your specific expertise you are effectively sometimes technical are relevant sometimes the fundamental relevant its important we have to navigate different areas all so important to note when your specific expertise you are effectively .
each 45min rotation we see each shift relative more aggressive we can see shift in dynamic we see absorption 1982 1980 sofa block less volume 1881 multiple times hit sellers aggressive to sell in that level volume was sustain in that level little bit lower bid up initiate selling they continue to initiate and continue initiate and continue to initiate . all the way to low of the day. hope fully it paints a picture for you.

Gold trading recommendations today
Gold rebounded but 1950, continue to be short
The current decline of gold is still the same, the rebound is not under pressure, and it will continue to make new lows after the shock! Relying on the key pressure position is short
The current gold is undoubtedly still in a downward trend. On the 4-hour level, gold fluctuates all the way down! And it keeps breaking new lows, and the high point connection forms the suppression of the current downward trend line! It is also the key resistance of this rebound!
Before breaking through the suppression of the downward trend line, gold will continue to fluctuate downward, and will continue to break new lows! The longer the shock, the stronger the explosive power!
Trading straregy:
gold: sell@1950 tp1:1935 tp2:1925
Next, there will be a lot of trading opportunities for gold, and I will provide you with more signals, don't miss the opportunity to make money!

It will bring you huge profits
If it really forms the form of a head and shoulders, you might as well be bold and set your goal at 1920!The process is tortuous, but it will come eventually!
I'm waiting for you here!Follow me, making money will no longer be difficult!

Barrick: Dig Deeper! ⛏Barrick still has got heaps of digging operations to do. The share should continue the downwards movement it has started from the last high of wave (iv) in blue and drop below the support line at $12.65. Thereupon, Barrick should enter the yellow zone between $11.97 and $6.32 to develop wave (2) in yellow, whose low should then complete the overarching downwards trend and thus initiate fresh upwards movement. However, there is a 35% chance that Barrick could turn northwards earlier, climbing above the resistance at $22.80. In that case, the share should proceed and rise above $26.07 and $31.22 as well.

4/17 Gold trading signal: Sell
We have made a profit of more than 300% for two consecutive weeks!
Last week, gold rose to near 2050 under the stimulus of news from all parties. During the US market on Friday, it directly fell below 2000, a decline of more than 50 US dollars. The gold long signal given on Thursday was successfully profitable, and the short signal on Friday was also very good. Caught this wave of the market!If you are trading following my signal, then congratulations, you have discovered the treasure!
Today's trading focuses on the resistance of 2008, 2016, and 2028, and supports 1987. Around these points, we will go short at the high and long at the low to trade!In the case of breaking the position, follow the trend again. If you are not sure, welcome to me!
