XAUMO XAUUSD (Gold Spot) ANALYSIS | AUG 01, 2025 | CAIRO TIME GMThis is a stealth bullish accumulation day. Market maker completed a fake drop and now prepping breakout. Play long bias from control zone with stop-hunt fade backup. Schabacker would call this a false breakdown spring + congestion base rally.
XAUUSD (Gold Spot) ANALYSIS | AUG 01, 2025 | CAIRO TIME GMT+3
🔍 Multi-Timeframe Technical Breakdown (Daily → 5m)
1️⃣ Price Action & Patterns
Daily: Bullish rejection tail forming (pin bar) off VAL (3,288). Strong buyer defense.
4H: Classic bullish engulfing off VAL support. High rejection wick to downside. Micro-structure shows market maker trap.
1H: V-shape recovery seen. Absorption bar confirmed via footprint delta spike.
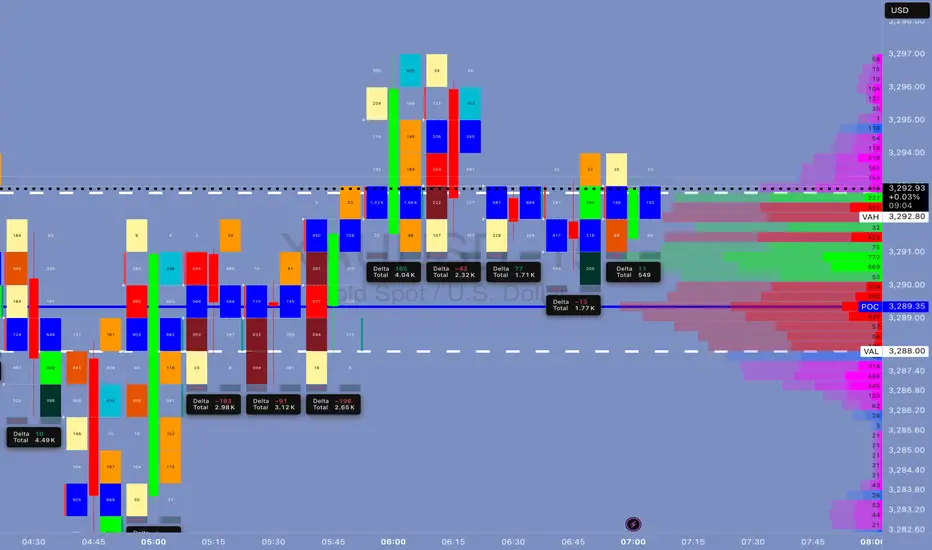
15m: Buyers stepping in at POC (3,289.35), stealthy buying—confirmed by divergence between delta & price.
5m: Accumulation in box range between 3,289–3,292. High absorption on bid side, low offer lifting—sign of stealth long build.
2️⃣ Volume & Delta Footprint
POC Cluster across all TFs: 3,289.00–3,291.50 is the control zone.
Volume Node Rejection at 3,288 = confirmed buyer base.
Delta: Absorption → sellers hitting bids but no follow-through = market maker trap → bullish implication.
Volume Spike at 3,288 = fakeout move likely manipulated to hunt stops.
3️⃣ Support/Resistance
VAL: 3,288 🔥 Strong Demand Zone
POC: 3,289.35–3,291.75 🧠 Smart Money Zone
VAH: 3,292.80 🎯 Break above confirms momentum
Res. Extension: 3,296.20, 3,300
Fibonacci Confluence: 3,288 = 61.8% golden retracement from recent rally
5️⃣Volatility
Compression near VAH = Volatility Expansion imminent.
Expect Breakout in next 1–2 hours (likely post 09:00 Cairo Time – Kill Zone)
6️⃣ Market Maker Philosophy
Last 3 days show liquidity vacuum trap below 3,288.
MM has triggered stop hunts to shake weak longs.
Building long inventory stealthily under POC.
Expecting rally trap to suck in breakout buyers → then retrace → final breakout continuation.
🧨 JEWEL TRADE ENTRY (Highest Probability)
📈 Order: Buy Stop
🎯 Entry: 3,293.10
🛑 Stop Loss: 3,287.70
💰 Take Profit: 3,302.40
📊 Confidence: 87%
🧠 Justification: Breakout of VAH/Golden Zone + High Volume Node = Trend Shift Confirmed
This is for EDUCATIONAL PURPOSE ONLY, and not financial advise.
Goldonthenile
MACRO CONTEXT & NEWS FLOW IMPACT — "WHY THE HELL IT MOVED"🔥 I. MACRO CONTEXT & NEWS FLOW IMPACT — "WHY THE HELL IT MOVED"
Yesterday’s move was a classic institutional fakeout followed by controlled accumulation. Today is retest day. Watch VWAP and order flow like a hawk. Don’t chase, wait for reversion and load at value.
📅 Date: July 30, 2025
📰 Event:
US Employment Cost Index: Lower than expected
Core PCE: Cooled off
Market Implication: Fed easing is now on the table.
DXY Weakens → Real yields drop → Gold gets bought like crazy.
👊 Institutional Logic:
Rate-sensitive assets (Gold, Bonds) exploded after the release.
Algorithmic reaction to macro signal: DXY down → XAU bid hard → MegaBar explosion.
BUT institutions needed liquidity to enter big → they faked a breakdown first.
That’s institutional deception 101.
📉 II. DAILY CHART ANALYSIS — THE BIG BOYS' GAMEBOARD
🗺️ Structure:
Price dropped from 3,355 to 3,258 in 3 days — a high-velocity markdown.
On July 30, Price printed a Megabar reversal (Massive range, delta-flush, volume spike).
VAH = 3,294.90 capped upside.
POC = 3,288.91, and VAL = 3,282.90 held beautifully.
🔍 Institutional Pattern:
This is a classic “Flush > Absorb > Mark-up” sequence.
Textbook from “Technical Analysis and Stock Market Profits”:
“Volume confirms intention, range confirms commitment. A wide bar with climax volume at low implies the exhaustion of sellers and transfer of ownership.”
🔑 Key Daily Stats:
📉 Delta Flush: -584K
🔁 Reversal Delta: +70K
🔊 Volume spike: >450K (Well above 30-day volume MA)
💡 Inference:
This bar did not print because of retail buying. It’s smart money rebuying from panic sellers.
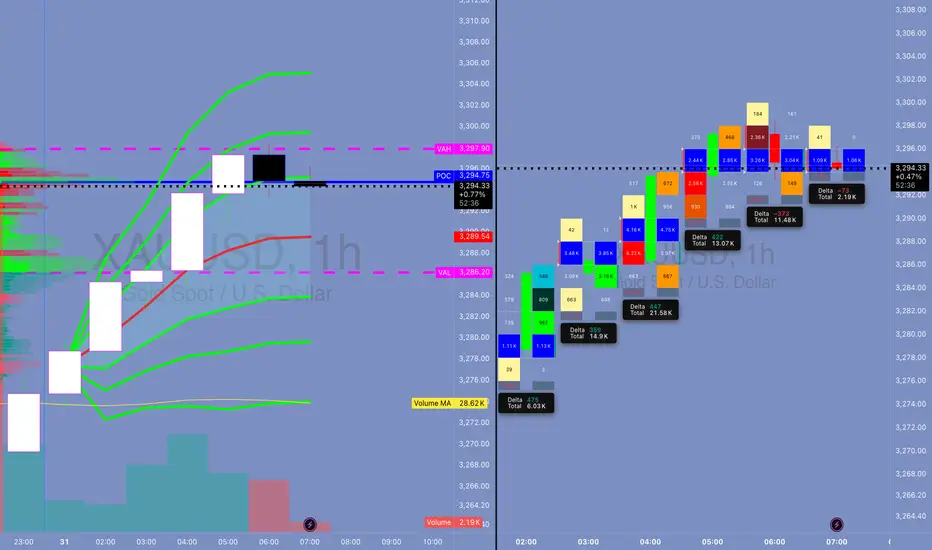
⏱️ III. 4H / 1H TIMEFRAME: ORDERFLOW & REACCUMULATION
📌 4H Chart:
📍 Megabar with -191K delta near 3,258 (Volume: 191.14K)
Immediate absorption by dark blue and green delta bars — this was not retail reversal.
VWAP reversion in play — price gravitates toward 3,294 (VWAP anchor zone)
🔁 1H Chart:
Rapid stair-stepping: Each hourly candle had higher lows and strong deltas.
Volume built from super-POC 3,289 to super-VWAP 3,295.25.
Final hour: exhaustion wick → distribution into resistance.
🧠 Institutional Tactic:
They used Volume by Price congestion to hold price between FVRP bounds:
Low Volume Nodes (LVNs) = acceleration zones
High Volume Nodes (HVNs) = consolidation + absorption zones
🔍 IV. 15M / MICROSTRUCTURE — WHERE THE GAME WAS REALLY PLAYED
🔬 VWAP Stack Analysis:
VWAP: 3,294.61
D-VWAP: 3,289.30
Super-VWAP Cluster held price in check — real institutional price magnet.
🔄 Delta Flow (15m):
Delta climbed from -3.15K → +3.21K in 1.5 hours.
Imbalance flipped bullish near POC.
🎯 FPVR Mapping (Volume Profile Right Side):
Thickest distribution volume occurred at 3,287 – 3,295
Value tightly packed = fair price.
Institutions are loading in value, not chasing.
⚙️ V. INDICATOR & MOMENTUM SIGNALS — INSTITUTIONAL CONFLUENCE ZONES
Tool Signal
VWAP Anchored VWAP tagged and respected — classic institution level
SMA50 Capped daily move (3,342) — still a long-term bearish lid
HMA5/9 Bullish crossover on 15m/1H – signals momentum alignment
Volume MA Volume climax confirms effort at lows, signaling phase change
🔩 VI. TECHNICAL SEQUENCING OF EVENTS (STEP BY STEP)
Asia Session: Tight range, price floats around VAL (3,282)
London Session: Fake breakdown to 3,258 – traps late shorts
NY Pre-News: Choppy price action within FRVP range
Macro News Drop: Megabar → -191K delta flush
Next Candle: Delta flips +21.2K → Absorption confirmed
Price Walks Up: Controlled bid to VWAP
End of Day: Distribution at VAH → price capped by VWAP band
💣 Final move = algorithmic mean reversion + VWAP auction completion
🧬 VII. ADVANCED ORDERFLOW INTERPRETATION
⚔️ MEGABAR (The Trap Setup):
Volume = 191K+
Delta = -191K (yep, full-on flush)
What happened?
→ Late shorts + stop runs + SL hunters got rekt.
→ Institutions absorbed, switched algo, and reversed.
🧱 FVRP (Fair Value Range Profile):
Defined by VAL (3,282.90) and VAH (3,294.90)
Institutions play inside this range for risk efficiency
They accumulate low and distribute high within it
🔄 Delta Rotation:
Delta Rotation = Shift from Negative Accumulation → Positive Distribution
Classic rotation confirms phase transition
🧠 VIII. INSTITUTIONAL OBJECTIVE (WHAT THEY WANTED)
Primary Goal: Create liquidity void below → Enter large long positions
Secondary Goal: Return to VWAP zone and unload
Tertiary Goal: Signal to market: "We're in control, stay out or get punished"
This is textbook Volume Profile Auction Theory in motion.
🎯 IX. HYPOTHETICAL TRADE SETUP (EDUCATIONAL PURPOSE ONLY)
🧾 Trade Plan: Institutional VWAP Reversion Play
Order Type: Buy Limit
Entry: 3,287.00
Stop Loss: 3,279.00 (below VAL & invalidation)
Take Profit: 3,300.00 (Super-VAH zone)
Confidence: 85%
R/R: 1:1.6
💡 Justification:
Entry at POC + SMA50 cluster
Stop below structural invalidation zone
Target near major supply
This is the exact playbooks funds run during reaccumulation rotations
🧠 X. EDUCATIONAL TAKEAWAY — WHAT YOU SHOULD LEARN
Volume is truth. If volume spikes at lows, it’s not weak hands — it’s smart money flipping.
VWAP is magnet. Everything mean-reverts back to VWAP in controlled auctions.
Delta tracks aggression. Sharp delta reversals = algorithm switch.
Megabar = signal. Huge candle + volume + delta = possible phase shift.
FRVP = roadmap. Price doesn’t move randomly — it moves to balance imbalances.
🔚 CONCLUSION — YESTERDAY’S LESSON
July 30, 2025 wasn’t just a bullish day — it was a textbook institutional deception-reversion cycle. If you understand:
How the news was used
How the megabar printed
How the volume clustered
How the VWAP held
… then you’re not trading blindly.
You’re trading with the damn architects of the market.
Schabacker's Gold Trap Inside the Trap: Schabacker Congestion, VWAP Warfare & The Silent Distribution on XAU/USD
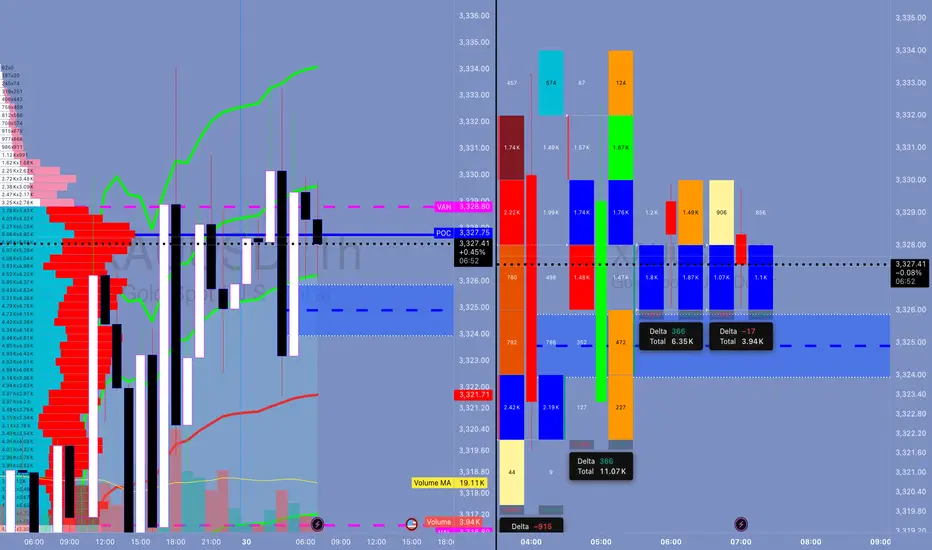
1. The Congestion Area – Schabacker Style
🔍 What We Saw:
Price action rotated in a tight range: 3,324.5 - 3,329.5.
This is not random. This is Schabacker’s classic Congestion Zone:
Duration: 12+ hours
Width: ~5 points
Volume: tapering near edges
Failed breakouts on both sides = classic neutral wedge compression.
🎯 Schabacker Teaching Applied:
"Congestion areas are places of rest and preparation — they are the breeding grounds of significant breakouts or breakdowns."
From his bible “Technical Analysis and Stock Market Profits”:
Congestion after a trend → likely a continuation (but confirm via breakout volume).
Multiple failed breakouts = deceptive strength/weakness → traps.
Range becomes psychological equilibrium → breakout from this zone is explosive.
📘 Lesson:
Watch for breakout confirmation only AFTER price escapes the congestion and retests the range (confirm with volume and delta). If volume weakens and price returns inside = fakeout, fade that sh*t.
🔥 How Schabacker Explains July 29 Price Action
"This was a classic congestion scenario with symmetrical compression, rejecting value high and value low over and over — a balanced market ripe for an imbalanced expansion."
Price coiled with lower highs + higher lows inside the value zone = triangle-like congestion.
Breakout attempts both sides failed = energy stored.
Delta flipped negative toward the close + volume dried = distribution inside the congestion.
✅ Congestion was not random chop. It was the Smart Money disguising their exit before slamming price.
⚔️ ENHANCED STRATEGIC OUTLOOK FOR TODAY (JULY 30, 2025)
🎯 Bias: Short bias unless proven wrong by breakout + acceptance above 3,329.50
Schabacker’s congestion broken to the downside = high probability short trigger.
First target = edge of congestion zone @ 3,316.80 (previous VAL).
Second target (extension) = swing low anchor near 3,310.
📘 Volatility Note:
After tight range like this (Schabacker Box), volatility expansion is imminent. Don’t get caught trading inside — trade the break and retest.
💣 HYPOTHETICAL TRADE PLAN: SCHABACKER STRATEGY IN PLAY
Order Type: 🔻 Sell Stop Below Congestion Break
Entry: 3,322.00
Stop Loss: 3,330.00 (above congestion top + failed breakout zone)
Take Profit 1: 3,316.80 (edge of range, VAL)
Take Profit 2: 3,310.00 (target from congestion width projection)
Confidence: 78%
🧠 Justification:
Factor Explanation
VWAP Flatlined = balanced market
FVRP Price camped near POC = equilibrium
Footprint Absorption at highs, silent selling = distribution confirmed
Delta Early buyer strength flipped = trap
Schabacker Congestion Classic box breakout setup = timing the expansion
🧠 EDUCATIONAL SUMMARY — WHAT YOU JUST LEARNED
✅ Schabacker’s Congestion Area Tactics
Congestion after a move Leads to continuation (trend resumes after pause)
Multiple failed breakouts Traps traders = setup for fakeout fade
Volume dries inside box = Explosive breakout likely
Use congestion width To project breakout targets
You don't fade chop — you exploit it after the breakout.
Don't waste your bullets inside the box. Wait for the beast to break loose — then you unload.
XAU/USD Strategy – Ride with the Market Maker, Not Against HimThis isn’t retail guesswork. This is institutional precision. You’re not reacting to the chart—you’re front-running the behavior behind it. If you want to trade like a market maker, you need to think like one. Accumulate where they accumulate. Strike where they strike. Exit before the blood spills.
Market Positioning Overview:
Gold is in a clear macro bullish phase. After confirming a textbook inverse head and shoulders breakout on the daily chart, price is targeting higher liquidity pools at 3389.50 and 3411.20. This isn’t noise—it’s calculated institutional movement. Market makers are in accumulation-to-expansion mode, and most retail traders will be slaughtered chasing false breakouts unless they understand how to align with this flow.
This strategy is not for amateurs. This is how institutional traders operate—mapping kill zones, front-running liquidity grabs, and riding the trend after the trap is sprung.
1. How Institutions Trade Gold:
Institutional price movement always follows this 3-phase structure:
• Phase 1 – Accumulation: Sideways price action to build large positions in stealth.
• Phase 2 – Manipulation: Quick stop hunts and false breakouts to generate liquidity and trap retail.
• Phase 3 – Expansion: Real directional move after the trap is full and stops are harvested.
You don’t predict any of this—you position inside the trap and ride the move when confirmation hits. Simple.
2. The Kill Zones: Where Smart Money Operates
Green Zone – Execution Zone (3350.5 to 3353.5):
This is where institutions are entering. It aligns with Fibonacci 61.8%, volume shelf, and the EMA/HMA cluster. If you’re buying, it’s here. You set your Buy Limit, wait for price to dip, and execute when the reversal candle confirms.
Yellow Zone – Accumulation Trap (3348.0 to 3355.0):
This is where market makers build their book. The price goes nowhere, volume contracts, and emotions run high. This is a no-trade zone. You wait. You observe. You let the breakout happen, then enter on the retest.
Red Zone – Manipulation Zone (3365.8 to 3372.2):
This is where retail gets wiped out. Breakouts above resistance here are bait. Market makers sweep stops and then reverse. You never chase here. You fade this zone only with volume divergence and reversal confirmation.
3. Confirmation Protocols: Trade Like a Professional
Ichimoku + Chikou Span (Heikin Ashi-Based):
If Chikou is above price and Kumo, trend is confirmed. Only go long if price is above the cloud with Chikou trailing clean air.
Stochastic RSI:
Enter long when %K crosses above %D below the 20 level—inside the green zone. Exit partials when you hit red zone and Stoch RSI turns down.
MACD:
You only enter if histogram bars are expanding upwards. Flat or fading momentum near resistance is a warning sign.
Volume Bollinger Bands:
Volume contraction followed by breakout spike = execution. Entry must be clean. No volume = no trade.
4. Trade Execution Plan: The Professional Setup
• Type: Buy Limit
• Entry: 3353.50
• Stop Loss: 3336.00
• Take Profit 1: 3389.50
• Take Profit 2: 3411.20
• Reasoning: Entry sits at Fib 61.8%, in the green zone, with clean structure. TP zones align with liquidity objectives of market makers. Risk/reward is asymmetrically favorable.
You don’t adjust the plan unless the market violates structure. This is a strategy, not a reaction.
5. Execution Rules of Engagement:
1. No trades inside the yellow zone. This is a trap. Be patient.
2. Do not chase breakouts in the red zone. Wait for the fakeout, then fade.
3. Only enter long from the green zone. That’s where smart money is.
4. Use Chikou and Volume for confirmation. No blind entries.
5. Cut losses with discipline. Stop belongs under the green zone—nowhere else.
6. Take profit at red zone or Fib extensions. That’s where liquidity gets harvested.

XAU/USD: Strong Bearish Momentum with Limited Upside🐻 XAU/USD Analysis: Bearish Momentum Dominates Across Timeframes with Limited Upside Potential 🐻
Idea:
In this multi-timeframe analysis of XAU/USD, we explore a solid bearish setup that persists across daily, 4-hour, 1-hour, and 15-minute charts. This alignment creates a clear, layered downtrend. Here’s a breakdown of each timeframe, highlighting support and resistance levels, ideal trade setups, and short entry points, while remaining cautious of minor corrective bounces.
🕰️ Daily Chart (1D): Long-Term View
From a wide perspective, the daily chart signals a strong bearish outlook:
• Momentum: Clearly bearish, with RSI at an oversold level of 24.61. Despite the oversold status, the prevailing downtrend remains strong, with limited upward potential.
• Ichimoku Cloud: The price is far below the cloud, with the lagging span mirroring the bearish structure. Sellers are in control, and there are no reversal signs.
• ADX & DI: A high ADX and dominance of the DI- line emphasize strong selling pressure.
• Key Support Zone: The zone between 2,575 and 2,580 acts as critical support. If price dips into this zone, we may see a corrective bounce before a potential further decline.
The daily chart maintains a bearish sentiment, where any temporary rallies are likely to be capped.
🕰️ 4-Hour Chart (4H): Medium-Term Insights
The 4-hour chart provides a closer look at possible short-term corrections within the broader downtrend:
• Trend: Bearish momentum continues, with a slight bullish divergence hinting at a minor pullback. This divergence suggests that sellers may temporarily lose momentum.
• RSI: With an RSI of 27.77, slightly above oversold territory, the 4-hour chart hints at a possible minor correction.
• Ichimoku Cloud: Both price and the lagging span remain below the cloud, reinforcing the downward trend. However, the proximity to a key support zone may prompt buyers to test the strength of the bearish hold.
• Resistance: Watch for a potential rejection at 2,590 - 2,595, likely strengthening short setups if price attempts to rally and fails at this level.
The 4-hour chart presents a potential for small corrections, though bearish conditions remain the primary theme.
🕰️ 1-Hour Chart (1H): Short-Term Perspective
The 1-hour chart captures immediate price dynamics, suggesting the possibility of a minor bounce:
• Trend: RSI sits at 20.91, in oversold territory, suggesting a short-lived bounce may occur.
• Ichimoku Cloud: Price remains below the cloud, with exhaustion signs as it nears support. This setup underscores bearish pressure but hints at a possible minor pullback.
• Moving Averages: The strong detachment from MAs suggests the bearish trend will continue, but a mean reversion play is possible, where price might retrace toward the MAs before resuming its downtrend.
• Immediate Support Zone: The 2,580 - 2,583 zone could serve as a temporary lifeline for buyers, though any bounce here is likely to be brief.
This chart provides a snapshot of a potential pullback, with the downtrend still prevailing.
🕰️ 15-Minute Chart (15M): Intra-Day Snapshot
For intra-day traders, the 15-minute chart highlights immediate levels:
• Moving Averages: The 10 MA at 2,587 and the 50 MA at 2,592 act as intra-day ceilings, likely capping any upward movement.
• Short-Term Resistance: The 10 MA at 2,587 serves as the first barrier, with the 50 MA at 2,592 reinforcing resistance.
This chart is ideal for quick, short-term trades, confirming limited room for upside, setting the stage for possible scalps within a narrow range.
📝 Trade Setups
Primary Short Setup
• Entry: Sell limit at 2,590 - 2,593; secondary entry at 2,595 if price retraces to resistance.
• Stop Loss: 2,598
• Take Profits:
• TP1: 2,583
• TP2: 2,580
• TP3: 2,575
Secondary Bounce Setup (Countertrend)
• Entry: Buy at 2,575 - 2,578 if reversal signals appear.
• Stop Loss: 2,573
• Take Profits:
• TP1: 2,585
• TP2: 2,590
🔄 Moving Average Detachment & Reversion Play
Across all timeframes, the price’s separation from moving averages suggests a possible mean reversion:
• Short-Term Reversion: Monitor for rejections near 2,590 to enter short positions if bearish momentum resumes.
• Long-Term Reversion: Daily chart support at 2,575 is critical; a break lower would confirm continued downtrend.
Summary
1. Bearish Continuation: The downtrend dominates, favoring short entries at resistance levels.
2. Corrective Bounce: Exercise caution on countertrend plays.
3. Mean Reversion: Moving average detachment suggests a potential short-term correction; watch for resistance rejection to confirm further short setups.
Trading Implications
• For Sellers: This setup favors short positions across timeframes, using resistance levels to enter or add to positions.
• For Buyers: Proceed with caution; the limited upside and strong resistance make long positions challenging unless a breakout occurs.
Conclusion: The strong bearish alignment across timeframes supports short setups with precise entries, while moving averages act as resistance across all timeframes, reinforcing the downtrend and creating opportunities to capitalize on minor pullbacks within a well-defined bearish environment.
