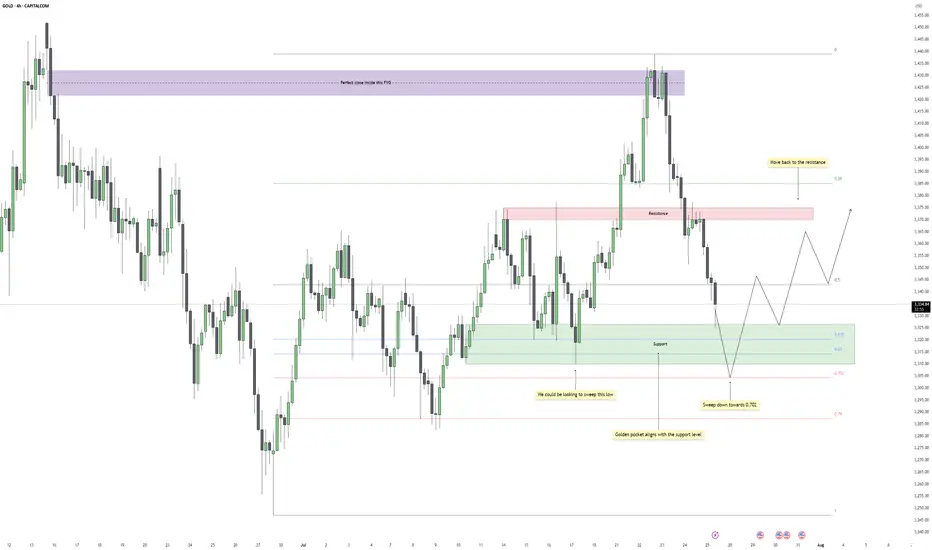
Gold - Eyes on the Final Flush Before ReclaimGold recently dropped after reacting perfectly inside a higher time frame fair value gap. That zone acted as clean supply, offering a precise close within the imbalance and initiating a strong bearish leg. The move confirmed that buyers were overwhelmed at that level, and price began its descent back into a broader consolidation range.
Support Cluster and Fibonacci Alignment
The current zone being tested holds significant weight. Price has tapped into a clear support region, one that has already caused multiple strong bounces in recent sessions. What adds further confluence is the alignment of this zone with the golden pocket region of the entire upward leg. This kind of technical overlap increases the chances of responsive buying once liquidity is cleared below.
Liquidity Target and Inducement Setup
Just below current price action, there's a clean low that hasn't been taken out yet. This low acts as the inducement, sitting right above deeper Fibonacci levels, especially the 0.702. If price continues lower in the short term, a sweep of that low into the golden pocket would provide the ideal liquidity grab before a reversal. The market often rewards those who wait for that final flush.
Bullish Recovery Path
Once the liquidity is taken and price stabilizes at the golden pocket zone, the path is open for a recovery move back into the midrange and potentially higher. The most likely magnet for price after a successful bounce would be the previous resistance zone, which coincides with the 0.5 retracement of the recent drop. That area should act as the next decision point and could either cap the rally or provide the base for a continuation if buyers show strength.
What I’m Watching
The cleanest scenario would be a sweep of the low just below support, ideally pushing into the lower green box near the 0.702 level, followed by a strong bullish reaction. I’ll be watching for a market structure shift on the lower timeframes at that point to confirm the entry. If that happens, the trade has room to develop back into the prior resistance zone, offering a solid range for intraday or swing setups.
Conclusion
Gold remains in a broader range for now, but the technicals suggest one more drop to clear late long positions before a recovery. The reaction at the support cluster will be crucial. If bulls step in after the sweep, there’s a high-probability path back toward resistance, with the move likely supported by the golden pocket confluence.
___________________________________
Thanks for your support!
If you found this idea helpful or learned something new, drop a like 👍 and leave a comment, I’d love to hear your thoughts! 🚀
Goldprediction
Gold Recovery Setup = Divergence + Support ClusterGold ( OANDA:XAUUSD ) fell to the lower line of the ascending channel and the Support zone($3,350-$3,326) , as I expected in my previous idea .
Gold is currently near a set of Supports .
Supports:
Support zone: $3,350-$3,326
Monthly Pivot Point: $3,333
Potential Reversal Zone(PRZ): $3,339-$3,329
Lower line of the ascending Channel
50_EMA(Daily)
Support lines
In terms of Elliott Wave theory , Gold appears to be completing a bearish wave 5 .
Also, we can see the Regular Divergence(RD+) between Consecutive Valleys .
I expect Gold to rise to at least $3,359 .
Second target: $3,367
Note: Stop Loss (SL) = $3,319
Do you think Gold can break the Support cluster by the end of trading hours?
Gold Analyze (XAUUSD), 1-hour time frame.
Be sure to follow the updated ideas.
Do not forget to put a Stop loss for your positions (For every position you want to open).
Please follow your strategy; this is just my idea, and I will gladly see your ideas in this post.
Please do not forget the ✅ ' like ' ✅ button 🙏😊 & Share it with your friends; thanks, and Trade safe.

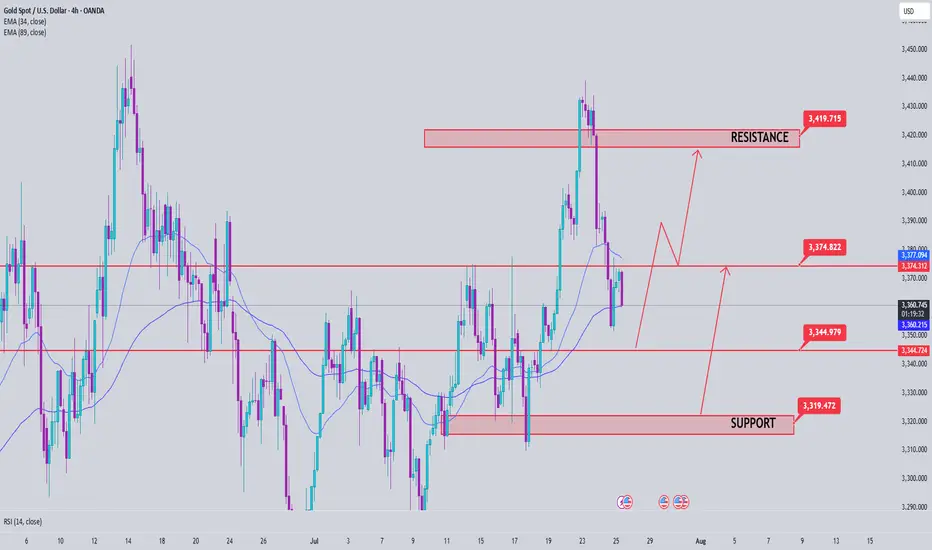
XAU/USD) bullish the support Read The captionSMC Trading point update
Technical analysis of (XAU/USD) on the 4-hour timeframe, indicating a potential bounce from a key trendline support within a rising channel.
---
Analysis Summary
Pair: XAU/USD (Gold Spot vs. USD)
Timeframe: 4H
Current Price: 3,338.715
Bias: Bullish rebound within ascending channel
---
Key Technical Elements
1. Ascending Channel:
Price has been respecting a well-defined rising channel, bouncing between support and resistance levels.
2. Key Support Zone:
The yellow highlighted area marks a critical support level and lower boundary of the channel.
Also intersects with the trendline, strengthening the potential for a bounce.
3. 200 EMA (Dynamic Support):
The 200 EMA at 3,343.616 lies just below current price, acting as a dynamic support level.
4. RSI (14):
RSI is around 34.93, nearing the oversold zone, suggesting a buying opportunity may be near.
---
Target Points
First Target: 3,402.099
Second Target: 3,446.661
---
Trade Idea
Direction Entry Zone Stop-Loss Target Zones
Buy 3,330–3,345 Below 3,320 3,402 / 3,446
Mr SMC Trading point
---
Summary
Gold is currently testing a key support level and ascending trendline. If price holds above this area, we can expect a bullish rebound toward 3,400–3,446 levels, aligning with the upper channel resistance.
Please support boost 🚀 this analysis)

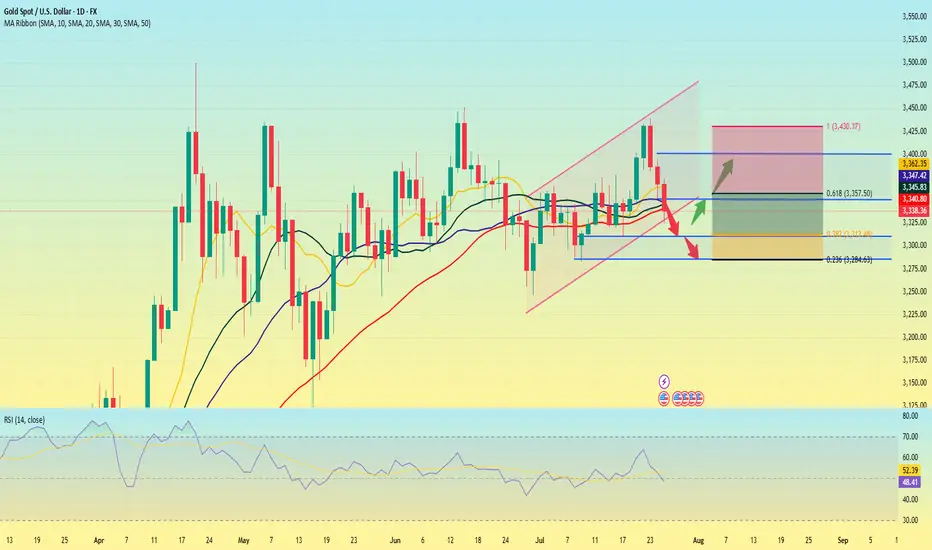
Gold Showing Signs of Reversal After Hitting Key ResistanceHello Guys.
Gold has reached a major resistance zone around 3439–3425, which has already acted as a strong ceiling in the past. The price tapped into this area again, forming a clear divergence, and failed to break higher.
Here’s what stands out:
Divergence signals a weakening bullish momentum at the top.
The price rejected the resistance and is now breaking structure to the downside.
A minor pullback may occur before continuation, as shown in the projected moves.
First target: 3259.792
Second target (if support breaks): 3136.869, a deeper zone for potential bounce or further drop.
This setup hints at a bearish trend building up. Stay cautious on longs unless the price structure changes again.

XAUUSD: Bearish Bias SetupI am watching for a possible reversal in XAUUSD, predicting a rejection with a downside target around 3.300.
This downside target is reasonable based on this setup, as it is based on a previous bullish move, from which price could find support and bounce, or break below, and the downside momentum could start to continue down.
I am just sharing my thoughts on the chart, this is not financial advice. Always confirm your setup and manage your risk accordingly.

Gold Trade SetupI will risk!!!
It seems we are near at the end of correction wave...
The first target R/R is 2 and the second is 4...

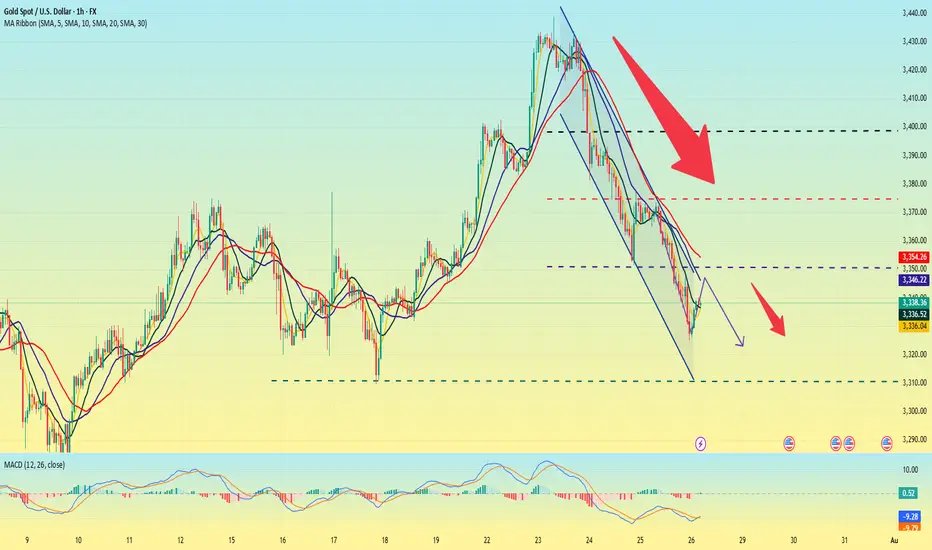
Gold is going down. It may continue next week.On the last trading day of this week, the bears attacked strongly and continued to refresh the recent lows, reaching the lowest point near 3325 before stopping.
From Monday's 3345 to 3440, it closed near 3337. This week, it also walked out of the large range roller coaster pattern, and all the strengths in the previous period did not exist. Under the continuous downward trend, the bulls were also vulnerable, and there was not even a strong rebound, which indirectly explained the strength of the bears in the short term.
As for the current trend, the bears are likely to continue to be strong, and before there is a symbolic upward breakthrough, we still need to maintain the idea of shorts to operate. The current upper pressure is maintained near 3350, which is also the bottom position touched for the first time in the previous period. It is possible that it will be transformed into a top-bottom conversion pattern; and the strong support level below is near 3310.
When the Asian market opens next Monday, we need to pay close attention to whether there is a gap problem on both the bulls and bears. After three consecutive negative daily lines, all the moving average systems have been broken, and it is also likely to form a resonance pressure pattern. On Monday, gold will first touch around 3350 and continue to short. The profit range will be around 3330-3320, and the stop loss will be 3360. If the European session is stronger, you can adjust the point before the US session.
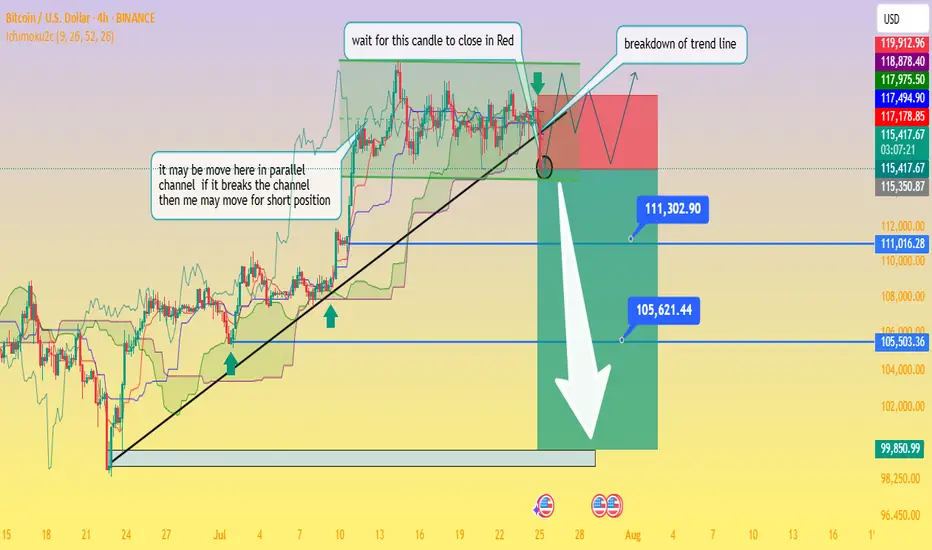
Critical Breakdown: BTC/USD Poised to Fall — Waiting on H4 CloseAnalysis of the BTC/USD 4‑Hour Chart
From the chart you provided, here's how the technical situation looks:
Ascending trendline support has been tested multiple times and was recently breached this afternoon, signaling a possible shift from the bullish setup to a bearish continuation.
The price is now trapped within a descending triangle formation beneath a well‑defined swing high resistance zone. This reflects indecision in the market, with neither buyers nor sellers in clear control
Business Insider
+15
Fxglory Ltd
+15
Bitcoin News
+15
.
Key levels to monitor:
Support zone: ~$115,500, extending down to ~$111,300 and ~$105,600 as deeper targets if bearish momentum strengthens.
Resistance zone: ~$119,000–120,000 area, forming strong overhead supply
Economies.com
DailyForex
Bitcoin News
.
The chart’s annotations align with a classic breakout strategy—with the caveat: wait for a confirmed close below the trendline before considering short positions (as noted in your “wait for this candle to close in red” comment).
Breakout confirmation would likely pave the way toward your indicated profit zones near ~$111k and ~$105k, with a larger potential down to ~$99.8k if further downside pressure builds.
🔍 What the Broader Market Signals
Technical sentiment from sources covering today’s analysis shows BTC/USD hovering just under $120,000, stuck within the defined range of $115.5k support to $120k resistance
Economies.com
.
While there’s still neutral momentum in indicators like RSI and MACD, the short-term direction leans bearish if the breakdown is confirmed on the H4 timeframe
Fxglory Ltd
.
Analysts emphasize that sustained movement above $116.5k could retarget resistance near $119–120k. A failure there and a move below $115.5k may thrust price deeper toward your downside zones
DailyForex
.
✅ Trading Strategy Overview
Scenario Trigger Target Levels
Bearish Breakdown H4 candle closes below trendline ~$115.5k $111.3k → $105.6k → possible $99.8k zone
Bullish Rejection Bounce back above ~$116.5k and trending above resistance $119k–120k retest, potential breakout if sustained
Neutral / Wait-and-see No decisive candle close yet Hold for confirmation
⛳ Final Thoughts
chart highlights a critical point: don’t act prematurely. Wait for a decisive H4 candle close below the trendline before committing to shorts. Confirmed bearish action around the breakout could open the path to the lower targets you identified. However, if price rebounds above support and climbs above $116.5k, a short-term retest of $119k–120k is still in range.
Traders should maintain prudent risk management—watching the unfolding price action around these pivot points without overreaching. Let me know if you'd like help crafting entry/exit zones or risk profiles for this setup!
Gold - The clear top formation!🪙Gold ( TVC:GOLD ) just created a top formation:
🔎Analysis summary:
Over the past four months, Gold has overall been moving sideways. Following a previous blow-off rally of about +25%, this cycle is very similar to the 2008 bullish cycle. Bulls are starting to slow down which will most likely result in the creation of at least a short term top formation.
📝Levels to watch:
$3.000
🙏🏻#LONGTERMVISION
Philip - Swing Trader

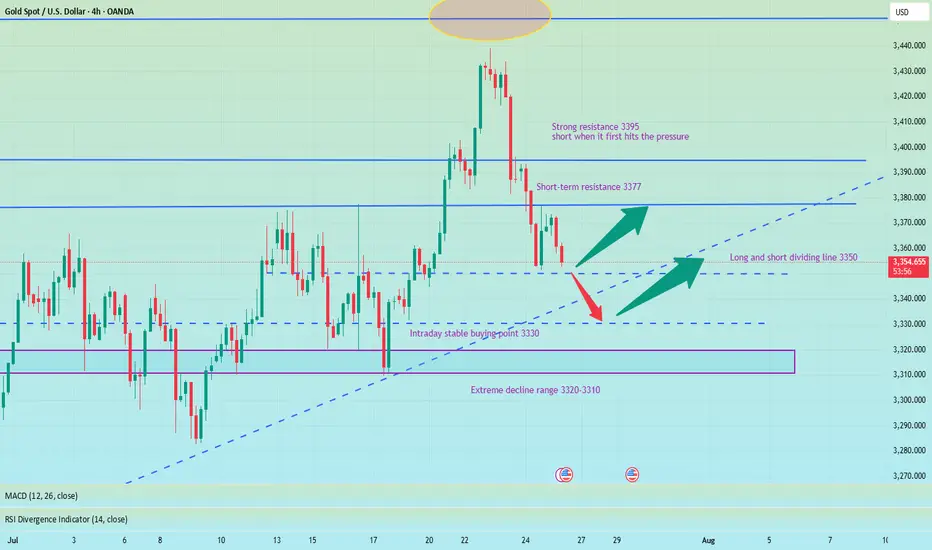
Be alert to new lows, pay attention to 3350 and go long at 3330📰 News information:
1. Tariff issues
2. Next week's NFP data
📈 Technical Analysis:
Last night, gold rebounded to only around 3377 before starting to fall back. Our judgment that the current rebound is weak is completely correct. 3350 is the support point of the bottoming out and rebounding to nearly $20 last night. Whether the European session can go down to 3350 will determine the trend of gold.
From the daily chart, the daily line has fallen for two consecutive days, suggesting that the price may continue to fall today. At present, we need to pay attention to this week's starting point of 3344-3345, and then the 3330 line below. The extreme decline is 3320-3310. At the same time, the narrowing of the daily Bollinger Bands is also paving the way for next week's NFP data.
From the 4H chart, the current MACD indicator crosses and increases in volume, and the middle track of the Bollinger Bands and SMA30 basically overlap near 3388. As for the hourly chart, the upper pressure is mainly concentrated near 3375-3377, which is also the high point of the rebound last night. If gold rebounds directly upward and encounters pressure and resistance at 3375-3385 for the first time, you can consider shorting and strictly implement stop loss.
Overall, if the current market falls to 3350-3345 for the first time and gets effective support, you can consider going long with a light position, defend 3340, and look to 3356-3362; if the decline is strong and continues to fall below 3350, the best stable long point for the day is 3330-3320, defend 3310, and earn $10-20 to leave the market.
🎯 Trading Points:
BUY 3350-3345
TP 3356-3362
BUY 3330-3320
TP 3345-3360
In addition to investment, life also includes poetry, distant places, and Allen. Facing the market is actually facing yourself, correcting your shortcomings, facing your mistakes, and exercising strict self-discipline. I share free trading strategies and analysis ideas every day for reference by brothers. I hope my analysis can help you.
TVC:GOLD PEPPERSTONE:XAUUSD FOREXCOM:XAUUSD FX:XAUUSD OANDA:XAUUSD FXOPEN:XAUUSD
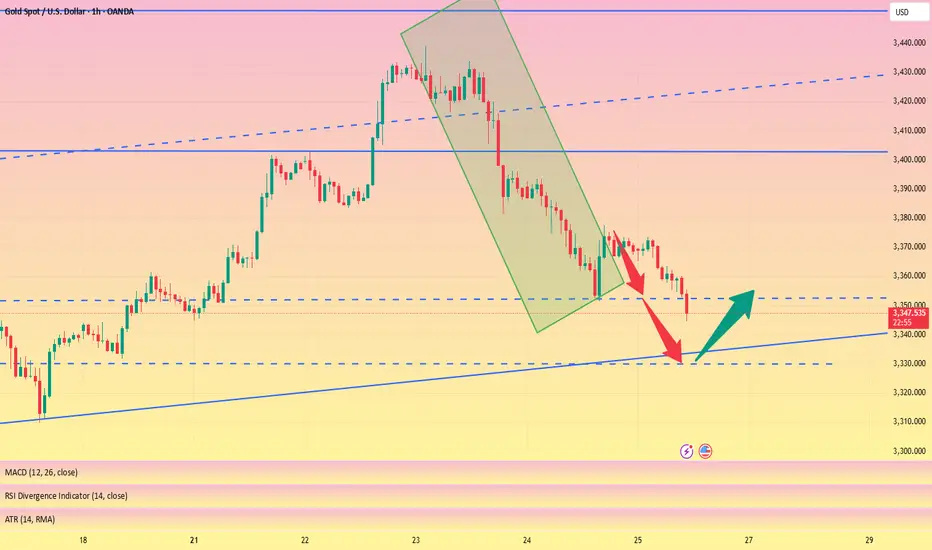
How can we seize the golden opportunity steadily and accurately?Yesterday, gold showed a trend of falling first and then rising to bottom out and rebound. After falling back to 3351, it quickly rebounded to around 3377. The overall fluctuation rhythm was highly consistent with our prediction. We accurately grasped the opportunity to arrange long orders and promptly notified the high position to reduce positions and make profits. The rhythm was properly controlled and we gained good returns.
From a technical point of view, the four-hour line fell and rebounded, and the short-term short momentum slowed down. Although it has not completely turned into a long structure, the short trend is no longer valid. At this stage, we will not look at new lows for the time being, and the operation is mainly based on the main long idea. At the daily level, pay attention to the long-short watershed of 3385. If it breaks through this level, it is expected to open up the upward space and look to 3392 or even above 3400; if it does not break, the market may continue the shock and wash pattern. Pay attention to the support below around 3365-3350. As long as it does not break and stabilizes, you can still choose to arrange low and long positions. In the short term, pay attention to the breakthrough of the rebound high point 3377. If it successfully stands firm, it will further enhance the continuity of the long position.

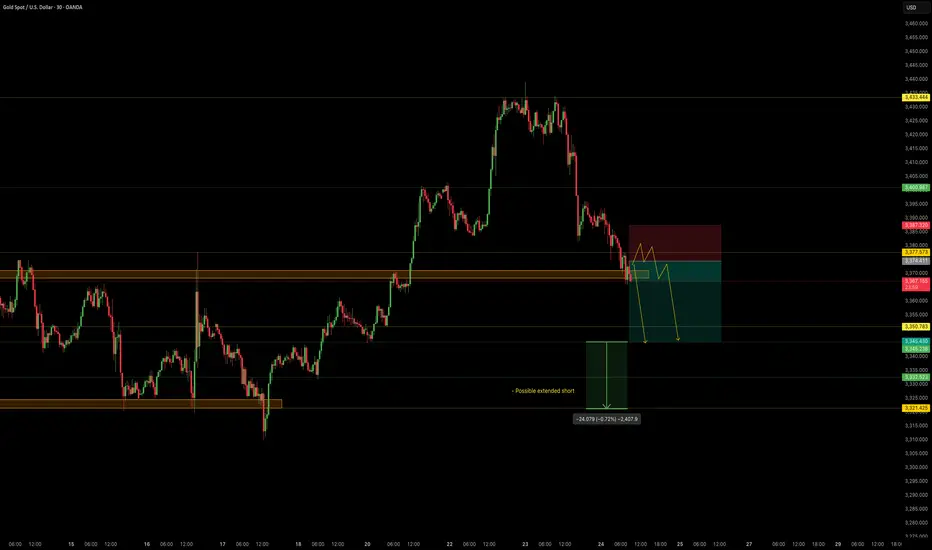
NordKern - XAUUSD InsightNordKern | Simplified Insight OANDA:XAUUSD – Short Opportunity Ahead
Gold is now near our important level at 3370, offering a shorting opportunity considering recent events and technical action.
Gold Price Decline – What's Behind It?
In the last two sessions (July 23–24), gold has retreated strongly owing to a set of global as well as market-specific circumstances:
1. Trade Deal Optimism
Advances in U.S.–Japan and U.S.–EU trade discussions lessened worldwide uncertainty, decreasing demand for gold as a safe-haven.
2. Higher U.S. Yields
Higher Treasury yields are rendering non-yielding assets such as gold less appealing, adding to downward pressure.
3. Technical & Profit-Taking
Following a recent rally, gold was exposed to selling. Stop-loss and profit-taking triggers hastened the fall.
Summary of Key Drivers
U.S. Trade Deals: Reduced geopolitical risk
Higher Treasury Yields: Decreased gold's relative attractiveness
Technical Selling: Enhanced the downward trend
Trade Setup – Bearish Bias
Entry : 3374.4
Stop Loss : 3387.3
Take Profit : 3345.4
Extended Target : 3322
Key Notes:
- Trade Deal Optimism: U.S.–Japan and U.S.–EU agreements eased global tensions, reducing demand for gold as a safe-haven asset.
- Yield Pressure: Rising U.S. Treasury yields made gold less attractive compared to interest-bearing alternatives.
- Technical Selling: Profit-taking and stop-loss triggers accelerated the decline after gold’s recent rally.
This setup remains tactically driven. Manage risk carefully and monitor for any renewed political shifts.
Wait for 3330 to buy the bottom and reduce unnecessary operation#XAUUSD
We have made good profits from short selling yesterday. Currently, gold has fallen to 3350📎. The 4HMACD death cross has increased in volume and is expected to continue to decline. Consider going long near 3330📈. I don’t think it is prudent to bottom out at 3340. Move forward steadily on Friday and reduce unnecessary operations⚖️.
🚀 BUY 3335-3330
🚀 TP 3345-3362
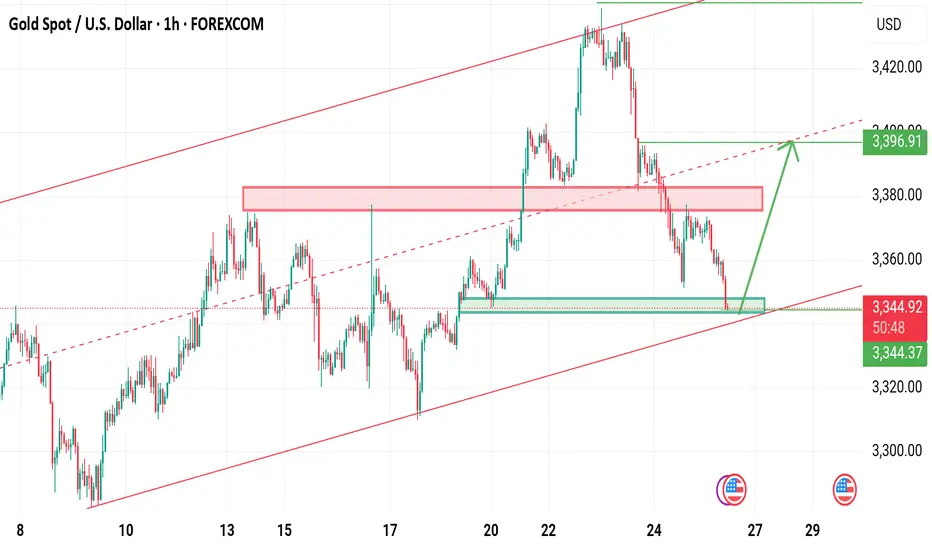
XAUUSD Last hope for buyers Gold is currently still holding rising channel last hope for buyers the bottom trendine .
Below 3335 buyers will be liquidate
What's possible scanarios we have?
▪️I'm gonna take buy trade from 3340-3338 area by following our rising Trend along with structural liquidity sweeps strategy, my target will be 3357 then 3368 in extension.
▪️if H4 candle closing below 3335 this Parallel moves will be invalid and don't look for buy till confirmation
Gold XAUUSD Sell in trendline completion stageGold XAUUSD Sell in trendline completion stage - short term trade. now in 4th touch. bounce back to test previous level testing and return back to support again and it will break to test the sellers.

GOLD - at Cut n Reverse Region, whats next ??#GOLD - market just reached at his ultimate area and keep in mind that if market break his current region than it will go further and nose dive..
NOTE: cut n reverse below our mentioned region..
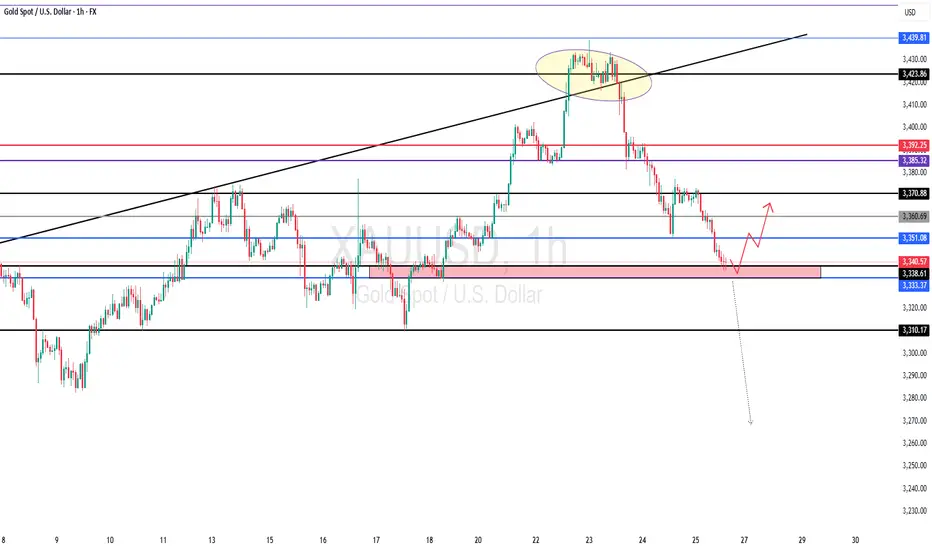
Chart Analysis Gold (XAU/USD)Chart Analysis Gold (XAU/USD)
**Bearish Outlook (Short-Term)**
* **Price is below EMA 7 and EMA 21**, showing short-term bearish momentum.
* Strong **resistance zone** around **\$3,430–\$3,440** was rejected sharply.
* Price has broken below **\$3,405–\$3,395** support and is now **consolidating above \$3,385–\$3,380**, a critical support area.
* Volume is rising on red candles, supporting **selling pressure**.
**Key Support Zone:**
\$3,380 – If broken, next downside targets:
→ **\$3,370**
→ **\$3,360**
*Bullish Scenario (If Support Holds)**
* If **\$3,380** holds and price reclaims above **\$3,395**, a **bounce toward \$3,405–\$3,410** is possible.
* Look for a **break above EMA21 (currently near \$3,402)** for bullish confirmation.

GOLD XAUUSD BUY We shall be looking to scalp a bit on the gold as it has been selling for a while now and can expect a reversal as nothing sells forever in the market, so can buy a dip and expect it to push a fair amount
Gold is weak. Beware of lows.On Thursday, the dollar index ended a four-day losing streak thanks to the progress of the fund between the United States and its trading partners.
As signs of easing global trade tensions curbed demand for safe-haven assets, gold fell for the second consecutive trading day, and yesterday it hit the 3350 bottom support level.
From the 4-hour chart
although it rebounded to the 3370-3380 range after hitting 3350. But it can be found that the current rebound is actually weak, and it is still maintained at 3360-70 for rectification. At present, the bottom of the 4-hour bottom is absolutely supported at 3340-3335. The rebound high is around 3375. As of now, gold has not rebounded above 3375, and gold is actually in a weak position.
Secondly, from the hourly chart, the weakness is even more obvious. The high point on Thursday was around 3395. Today's current high point is around 3375. It can be seen that if the bottom falls below the 618 position 3350 again, it will directly touch around 3335. It coincides with the target position of 3340-3335 in the previous 4-hour chart.
Therefore, it is not possible to buy the bottom and go long today. Be alert to the possibility of further touching 3340-3335.
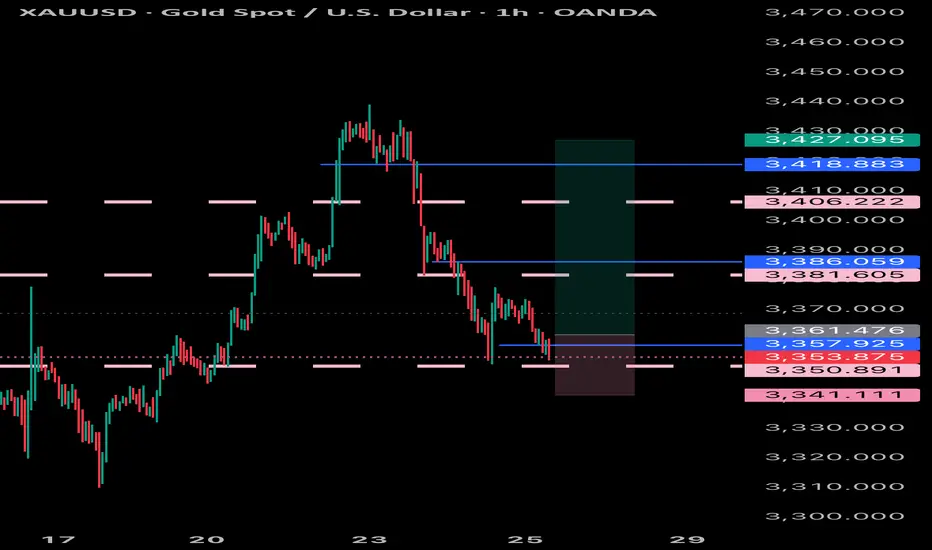
Gold – 25 July: Watching M15 Demand for Bullish Reversal📍 Gold – 25 July Outlook
Early Signs of Reversal from H4 OB Zone – Wait for Clear Continuation
🔍 Market Recap & Context:
Yesterday, the H4 Order Block zone (3359–3345) was retested and showed signs of holding. A visible M15 structure shift (ChoCH) suggests the market may be preparing to resume the uptrend.
However, the M15 Break of Structure (BoS) has not yet occurred — so this is not a confirmed reversal .
📍 Current Zone to Watch:
M15 Demand Zone: 3359.5 – 3351.5
Price is retracing into this zone. If respected, it could be the base for the next bullish leg.
📌 Trade Setup Possibility:
If price holds the M15 demand zone and M1 gives confirmation (e.g., micro-ChoCH + micro-BoS , a long trade could be considered.
But keep in mind — this would be an aggressive entry , because the M15 BoS is still pending.
This setup would rely on:
• Candlestick behavior
• Volume spikes or reaction
• Price action psychology
✅ Strategy Note:
Wait for signals like:
– Bullish engulfing on M1 or M5
– Micro ChoCH + demand hold
– Volume absorption or imbalance reaction
Only act if the market shows strength — not just a zone tap.
📝 Summary:
• Bias: Early bullish reversal watch
• Zone in Play: 3359.5–3351.5 (M15 demand)
• Confirmation: M1 LTF shift + strong candlesticks
• Caution: No M15 BoS yet — be precise and patient
• Risk Management: 1:3 RR — 40 pip SL / 120 pip TP
Let the chart speak first — observe with stillness, execute with precision.
📘 Shared by @ChartIsMirror

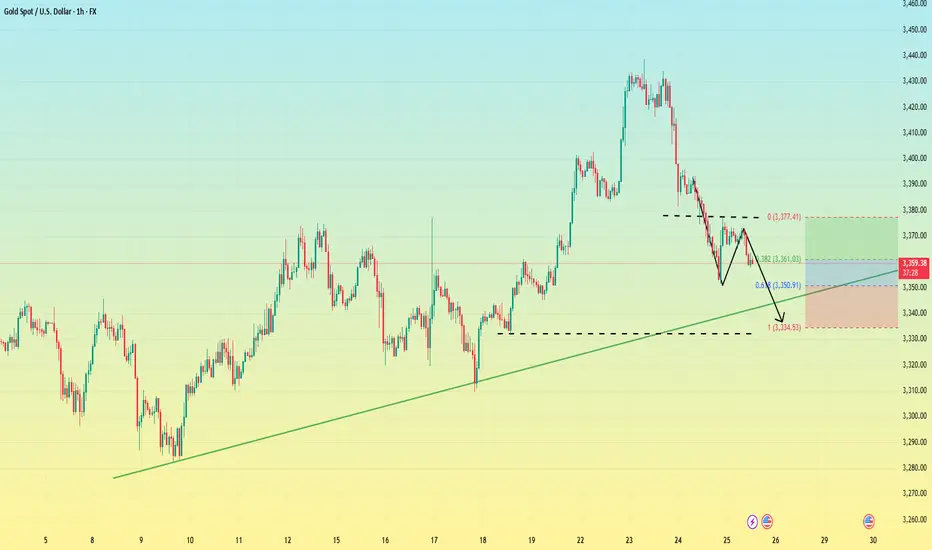
Gold price analysis July 25Gold Analysis – D1 Uptrend Still Maintains, But Needs New Momentum
Yesterday’s trading session recorded a D1 candle closing above the Breakout 3363 zone, indicating that buying power in the US session is still dominant. This implies that the uptrend is still being maintained, although the market may need a short-term technical correction.
In today’s Tokyo and London sessions, there is a possibility of liquidity sweeps to the support zone below before Gold recovers and increases again in the New York session.
Important to note:
The uptrend will only be broken if Gold closes below the 3345 zone on the D1 chart.
In this case, the 3320 level will be the next support zone to observe the price reaction and consider buying points.
For the bullish wave to continue expanding towards the historical peak (ATH) at 3500, the market needs stronger supporting factors, which can come from economic data or geopolitical developments.
📌 Support zone: 3345 – 3320
📌 Resistance zone: 3373 – 3418
🎯 Potential buy zone:
3345 (prioritize price reaction in this zone)
3320 (in case of breaking through 3345)
🎯 Target: 3417
Analysis of gold price trend next week!Market news:
This week, international gold recorded its biggest weekly decline in a month. Spot gold turned sharply lower after a sharp rise and finally closed lower. Signs of progress in US-EU trade negotiations hit the safe-haven demand for London gold prices. Geopolitical situation is also a factor in the downward trend of gold prices. On the 25th local time, Tahir Noonu, a senior Hamas official, said that Hamas was absolutely positive about the efforts of the relevant mediators, but was surprised by the US statement. Before the United States and the European Union made progress in trade negotiations, fund managers raised their bullish bets on gold to the highest level since April this year. The trade war has pushed gold prices up 27% this year. Although the easing of trade tensions will weaken safe-haven demand, gold has also been supported by strong buying from central banks.Next week, international gold prices will focus on US-EU and US-China trade negotiations. If the negotiations are optimistic, gold prices may continue to test the $3,300/ounce mark; in addition, focus on the Federal Reserve's resolution. After Trump's visit to the Federal Reserve headquarters, whether the Federal Reserve will maintain its independence will be highlighted in this resolution. Non-agricultural data will also be released on Friday, which needs attention.
Technical Review:
From the weekly gold level, gold is still in a wide range of 3500-3120. It has been fluctuating for ten weeks. The Bollinger Bands are gradually shrinking. MA5 and MA10 are running horizontally, indicating that gold fluctuations will continue. This time, gold stabilized and rose from 3247 to 3438 and then fell back. The current short-term range is 3247-3438! Next week, pay attention to the range of fluctuations and choose a new direction after the narrowing. The daily level is currently in the 4th wave adjustment. There is a high probability that there will be a 5th wave rise after the adjustment, and then a large-scale ABC adjustment will be started. At present, there are two changes in the structure of the 4th wave, one is the triangle contraction and the other is the ABC structure. No matter how it runs, the market outlook is to wait for low-level long positions to see the 5th wave rise. In the short term, gold is still oscillating and selling.
Next week's analysis:
Gold is still adjusting, but it has basically adjusted in place. The current daily price has also adjusted to the key support level of 3300. Similarly, the four-hour chart just stepped back to the upward trend line support, which is the short-term long order entry. Buy above the 3300 mark next week! Next week, gold is expected to further test the 3310-3280 support level. Gold at the 4-hour level peaked at 3438 and then fell back. It has now formed a unilateral trend. The K-line is under pressure from the 5-day moving average and continues to set new lows, and breaks the short-term upward trend line. The Bollinger band opens downward and diverges, and the MACD water cross diverges downward to underwater, indicating that the current gold trend is in an absolute weak position! Next, gold will continue to test the support near the previous low of 3300. If 3300 is not broken, gold buying will continue to have momentum. If 3300 is broken, the short-term rise will end, and the subsequent rebound will basically be just a correction. However, the current 4-hour green column shows signs of shrinking volume, so it is not easy to sell at a low level. Try to sell after the rebound correction, or buy at a low level!
Operation ideas:
Short-term gold 3305-3308 buy, stop loss 3297, target 3350-3370;
Short-term gold 3350-3353 sell, stop loss 3362, target 3320-3300;
Key points:
First support level: 3320, second support level: 3309, third support level: 3300
First resistance level: 3346, second resistance level: 3360, third resistance level: 3375

Gold is weak. Will it explode next week?Gold prices failed to stabilize above $3,400 after a bullish breakout this week. The technical outlook highlights the recent indecision of gold bulls.
In the first two trading days of this week, spot gold prices rose by 2.4%, but the cumulative decline in the last three trading days of this week reached nearly 3%. The sharp fluctuations this week were due to the positive progress in Trump's trade negotiations, and the rebound in market risk appetite, which hit the safe-haven demand for gold.
Looking at next week, the economic calendar will provide several high-impact data releases. The Federal Reserve will announce its monetary policy decision after the policy meeting on July 29-30; the US Bureau of Labor Statistics will release the July employment report; and some important news such as the US-China trade negotiations may trigger the next major move for gold.
From a technical perspective, the current market short-term technical outlook highlights the hesitation of gold buyers. The daily chart shows that the RSI is still slightly below 50, and gold prices have difficulty staying away from the 20-day and 50-day MAs after breaking through these two levels earlier this week.
On the upside, 3450 constitutes the first resistance for gold prices. If it breaks through this resistance, gold prices will most likely hit the 3400 integer mark again.
On the downside, if gold prices remain below 3340, technical sellers may still be interested. In this case, 3310 can serve as the first support level, followed by the second support level near 3285.
A new week is about to begin, and I wish all traders good luck.