Gold fluctuates upward. Is the decline over?On Monday, gold opened at around 3282, and then fell back quickly to around 3247 under pressure; the downward low was blocked, and then rebounded strongly to around 3297; the market currently maintains a small upward trend.
At present, we need to focus on the resistance range of the upward trend.
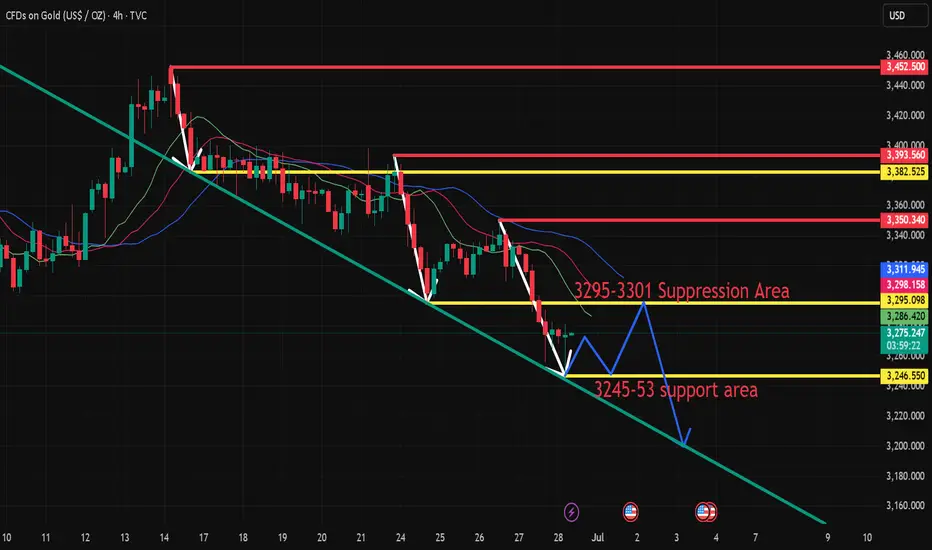
From the 4-hour chart, the upper short-term resistance is around 3295-3300, followed by the suppression range of 3310-3315. The main direction of short-term operations maintains the rebound short-selling strategy. The support below is around 3255; the overall short-term operation relies on 3260-3300 to maintain the main tone of high-altitude participation unchanged.
Operation strategy:
Short near 3305, stop loss 3320, profit range 3270-3260.
A new week has just begun. I wish you all gain something from the market fluctuations.
Goldprediction

GOLD LONG IDEA MARKET STRUCTURE CHANGEgold futures were on a full sell off due to ongoing global turbulence in the month of June macro news is there to show the bigger picture but price tells the full story
imbalance was filled and the week opened with a bearish candle closing above 3,250 COMEX:GC1! price range now it is time to see It play out to the buyside for the precious metal

Gold long-short strategy US trading range operation
Gold prices (XAU/USD) recovered some of their losses during Monday's Asian trading session, driven by expectations that the Federal Reserve may cut interest rates further this year (and perhaps earlier than previously expected). This prospect weighed on the dollar, making dollar-denominated gold more attractive to overseas buyers.
However, the recent improvement in global risk sentiment (driven by the US-China trade agreement and the Israeli-Iranian ceasefire agreement) may reduce the safe-haven demand for gold. Investors will now turn their attention to upcoming comments from Federal Reserve officials, with Atlanta Fed President Rafael Bostic and Chicago Fed President Austan Goolsbee expected to speak later in the day.
Gold prices recovered, accumulating around the 3,300 price range at the beginning of the new week. Still in a major downtrend.
⭐️Set Gold Price:
🔥Sell Gold Area: 3316-3318 SL 3323
TP1: $3305
TP2: $3290
TP3: $3277
🔥Buy Gold Area: $3248-$3246 SL $3241
TP1: $3258
TP2: $3270
TP3: $3286
⭐️Technical Analysis:
Set reasonable buy orders based on technical indicators EMA 34, EMA89 and support and resistance areas.

Gold's rally has not reversed yet? The consolidation pattern hasTechnicals:
Short-term risks remain skewed to the downside as the momentum of the relative strength index (RSI) and the moving average convergence divergence indicator (MACD) weakens. The RSI hit a new low below the neutral 50 mark. If short pressure intensifies in the next few trading days, gold prices may retest the upper track of the previous falling channel at 3215, followed by the rising support line from October 2024 at 3150. If it falls below this level, the decline may accelerate towards the psychological level of 3000, or even lower to 2970.
On the upside, if a strong catalyst pushes gold to rebound above the 20-day and 50-day moving averages (currently 3320-3350), the next resistance level may appear in the 3400-3435 range. A decisive close above this boundary may pave the way for gold prices to move towards 3500, or test resistance near 3530, and then may target the 3600 level.
Overall, despite the weakening technical indicators, gold has not completely lost its bullish reversal potential. As long as the price remains within the sideways structure above 3150, the downward pressure may still give rise to a "buy on dips" strategy.

XAUUSD I Trade Update Welcome back! Let me know your thoughts in the comments!
** XAUUSD Analysis - Listen to video!
We recommend that you keep this pair on your watchlist and enter when the entry criteria of your strategy is met.
Please support this idea with a LIKE and COMMENT if you find it useful and Click "Follow" on our profile if you'd like these trade ideas delivered straight to your email in the future.
Thanks for your continued support!Welcome back! Let me know your thoughts in the comments!

Gold bulls are suppressed, rebound short-selling range grasp
💡Message Strategy
The cooling of geopolitical tensions and the easing of Sino-US trade tensions have boosted market risk appetite, and rising stock markets have weakened the attractiveness of holding gold, suppressing gold prices.
However, geopolitical tensions have not completely calmed down, and expectations of a September rate cut by the Federal Reserve have increased, limiting the decline in gold and providing support. In terms of operations, it is recommended to treat it with a volatile mindset.
📊Technical aspects
On the daily chart, after gold hit a two-month high in mid-June, it encountered resistance and fell back, hitting a new low in nearly a month, and the short-term trend is biased downward.
For gold's upper pressure, pay attention to the intraday high of $3,300. The gold price bottomed out and rebounded during the day. For gold's lower support, pay attention to the intraday gold price rebounding above the rising position of $3,270, followed by the intraday low of $3,247, which is also near the low point of the gold price after the rise in May. The 5-day moving average and the MACD indicator cross downward, showing that the short-term technical side is dominant.
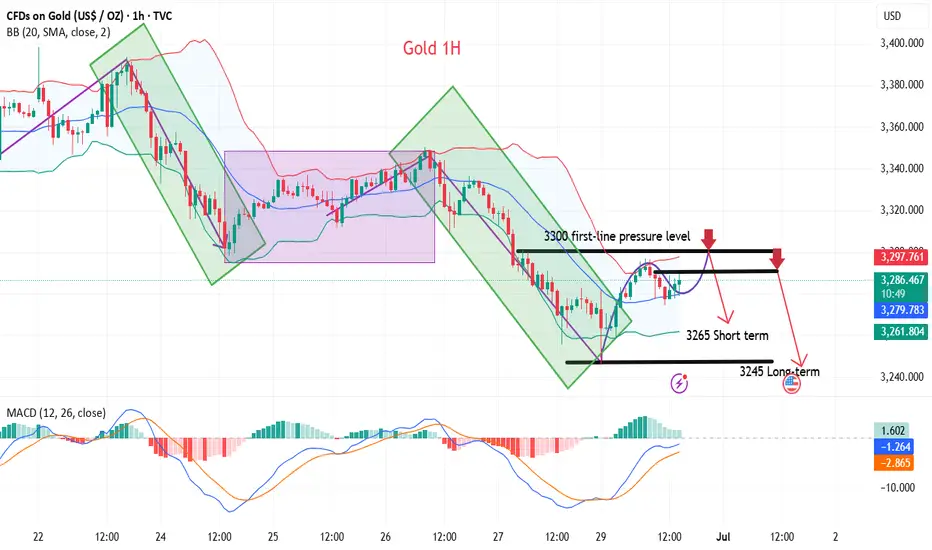
From the 1-hour analysis, the upper short-term resistance is around 3277-3281, the 3295-3301 line is suppressed, and the 3316 line is suppressed.
In terms of operation, the main short-term support is around 3250-3255. The overall main tone of high-altitude participation remains unchanged in this range, so pay attention in time.
💰Strategy Package
Short Position:3290-3300,SL:3316,Target: 3240-3250
Gold: Eyes on QML Zone for Potential Reaction Before Deeper DropHello guys!
Let's go deep into the GOLD chart!
Price has completed a liquidity grab near 3440 (marked as "a hunting") and is now heading downward toward a key QML zone.
First, a reaction is expected around the QML area (3180–3220), where previous structural interest and demand may cause a temporary bounce.
After this reaction, the price is likely to retest higher, potentially forming a lower high.
Then, the dominant bearish structure is expected to continue, with a possible sharp drop toward the final demand zone around 3050–3080.
This movement represents a classic manipulation.

Gold is under pressure at 3296 and may weaken and fall today
I am analyst Yulia, and I always believe that profit is the only criterion for measuring strength. My analysis is never perfunctory, and my trading style is unique. Follow my rhythm, and you will never fail in the annual cycle. Others have already rushed on the road to wealth, but you are still hesitating whether to cross the traffic light at the intersection? Remember, hesitation will lead to failure! Follow my pace, and wealth will be very close to you.
Gold rebounded as I expected during the weekend, but the rebound to 3296 was under pressure. The short-term 60-day moving average and the suppression near the five-day moving average failed to break, so the rebound within the day was limited. It may weaken and fall today, but it belongs to a shock and bearish trend, so consider shorting near 3282-85, stop loss 3291, pay attention to risks.
June 30 gold short-term trading: short near 3283, stop loss 3291, take profit 3263

Gold is trading sideways. Has it reached a high point?On the first trading day of this week, after hitting 3247 in the early Asian session, it quickly rebounded to around 3295, and then fell back slightly. It is currently maintained at around 3285.
From the hourly chart, the Fibonacci 0.618 position of this trend from 3247 to 3297 is at 3278. The price has always been above 3278, but it has only fallen below this position in a very short time. If the retracement does not break through the 0.618 position, there is a high probability that there will be a high point in the subsequent trend.
Next, we should focus on the area around 3280. If the price always closes above 3280, then today's high point of 3297 will most likely be refreshed. If the upward trend is opened again, it is very likely to touch around 3310. 3310 is also the current 0.618 position. And it is also the top position of this hourly chart range.
Therefore, we should be cautious when shorting gold above 3280, as there is a high probability that it will reach above 3300.
Aggressive trading can rely on entering the market and going long near 3280, and the profit range is between 3300-3310.
For short strategy trading, Quaid recommends that it is safer to short when the price rebounds near 3310.

Gold has no chance to rise
Gold did not break through the upper pressure on Friday. Gold fell directly after opening on Friday. The bears broke through the previous 3295 support line, and the lowest reached 3255. It closed near 3274. The daily line also closed in the form of a big Yin line. The downward trend is obvious, and all the previous supports will also turn into pressure. The short-term moving average system crosses downward to accumulate energy for the bears, and the Bollinger Bands are also expected to open downward. Since the closing did not break through the upper 3300 suppression level, we will continue to rebound and short next week. After all, the technical side is still short, and only by following the trend can we keep up with our rhythm. We also pay attention to international news on the weekend. Combined with the news, I will analyze the specific strategy ideas before the opening of Monday. If your current gold operation is not ideal, I hope Yulia can help you avoid detours in your investment. Welcome to communicate!
From the 4-hour analysis, the upper short-term resistance is around 3295-3301, and the focus is on the important suppression of 3314-16. In terms of operation, the rebound continues to be short and follow the trend to fall. The short-term support below is around 3250-3255. The overall high-altitude participation is maintained in this range. I will remind you of the specific operation strategy during the trading session, so please pay attention to it in time.
Gold operation strategy:
Short at the rebound of 3295-3301, short at the rebound of 3314-16, stop loss at 3326, target at 3255-3260, and continue to hold if it breaks;

6.30 Safe haven disappears, gold loses its luster!Gold did not break through the upper pressure at midnight last Friday. Gold fell directly after opening in the morning on Friday. The bears broke through the previous 3295 support line, and the lowest reached 3255 in the evening. It closed at around 3274, and the daily line also closed in the form of a big Yin line.
From the 4-hour analysis, the upper short-term resistance focuses on the 3295-3301 line, and the 3316 line is focused on. In terms of operation, it is still rebounding and continuing to be short and follow the trend to fall. The short-term support below focuses on the 3250-3255 line. The overall high-altitude participation tone remains unchanged relying on this range. I will remind you of the specific operation strategy during the session, and pay attention to it in time.
Gold operation strategy:
1. Short gold rebounds at the 3295-3301 line, and short gold rebounds at the 3314-16 line, stop loss at 3326, target 3255-3260 line, and continue to hold if it breaks;
XAU/USD Chart Analysis: Price Retreats to Monthly LowXAU/USD Chart Analysis: Price Retreats to Monthly Low
In mid-June 2025, demand for gold surged following reports of exchanged strikes between Israel and Iran, along with US bombings of Iran's nuclear facilities. As a so-called safe-haven asset, gold prices climbed towards $3,430.
However, by the final day of June, the XAU/USD chart shows that gold had retreated to around $3,250, marking the lowest level in a month.
Why Is the Gold Price Falling?
On one hand, this reflects easing tensions in the Middle East, as a ceasefire—albeit fragile—between Israel and Iran remains in place.
On the other hand, the risk of trade wars is also diminishing. According to media reports:
→ President Donald Trump announced last week that the United States had signed a trade agreement with China and hinted that a “very major” deal with India would follow soon.
→ The US is also close to concluding agreements with Mexico and Vietnam, while negotiations with Japan and many other countries are ongoing.
Technical Analysis of the XAU/USD Chart
Looking at the broader picture, it is worth noting that gold prices in 2025 continue to move within a long-term upward channel (shown in blue), with the following key observations:
→ The channel’s median line acted as resistance (indicated by arrow 1);
→ The line dividing the lower half of the channel in half also showed signs of resistance (indicated by arrow 2).
Now, gold is trading near the lower boundary of the channel – a key support level within the multi-month uptrend. Demand may begin to strengthen here, with long lower wicks on candles on the lower timeframes supporting this view.
A rebound from the lower boundary is possible in early July, but how strong might it be? Note that bears have taken control of the $3,345 level (which has now flipped from support to resistance), and there are signs of a triple top pattern (A-B-C) forming near the $3,430 resistance. This raises the risk of a bearish breakout from the ascending channel.
This article represents the opinion of the Companies operating under the FXOpen brand only. It is not to be construed as an offer, solicitation, or recommendation with respect to products and services provided by the Companies operating under the FXOpen brand, nor is it to be considered financial advice.

Analysis and layout of gold trend at the end of the month📰 News information:
1. Gold market liquidity at the end of the month
2. Impact of geopolitical situation
📈 Technical Analysis:
From the beginning of the decline of gold near 3338 on Friday to today's lowest point near 3244, gold has fallen by nearly $94. At present, gold has rebounded as expected. In the short term, I think we have two key areas to pay attention to. The first is the position of 3290-3295, which is a 50% rebound, and the second is the upper top range limit range of 3300-3320. Of course, if it breaks through 3280 and then retreats, it can also be long twice, but the current price rebounds, considering the position of the temporary low long position, there is not much trading opportunity. First look at the key areas given to find opportunities for shorting, and pay attention to the opportunity of retreating to 3280-3270 below.
🎯 Trading Points:
SELL 3290-3295
TP 3380-3370
SELL 3300-3310-3320
TP 3290-3280-3270
BUY 3270-3260
TP 3290-3300
In addition to investment, life also includes poetry, distant places, and Allen. Facing the market is actually facing yourself, correcting your shortcomings, confronting your mistakes, and strictly disciplining yourself. I hope my analysis can help you🌐.
OANDA:XAUUSD FOREXCOM:XAUUSD FX:XAUUSD PEPPERSTONE:XAUUSD FXOPEN:XAUUSD TVC:GOLD

GOLD H2 Intraday Chart update for 30 June 2025Hello Traders,
As you can see that there are some solid in the market since morning, right now market is sustains below 3300 Psychological Level and move towards 3270-75 key support zone and then at 3350
Monthly candlestick closing also due today
only if market breaks 3305 successfully today then GOLD will move towards 3335
Disclaimer: Forex is Risky

XAUUSD Under Pressure: What the Market Is Telling UsGold (XAUUSD) is currently trading with a clear bearish bias, showing sustained downside momentum on the 4H timeframe 🕒. Price has been gradually stepping lower, and the structure continues to favor the sellers.
As expected for early in the week, there’s been a bit of choppy movement ⚖️, but the overall sentiment remains weak. Unless we see a strong shift or catalyst, I’ll be maintaining a bearish outlook.
🧭 I’m watching for price to revisit key resistance levels, and if we get a clean break and retest 🔄, I’ll be looking for potential short setups from areas of previous demand that flip into resistance.
🌐 Keep an eye on broader risk sentiment — if NASDAQ starts pulling back or DXY strengthens, it could fuel further downside in gold.
As always, this is not financial advice, but the detailed breakdown is available in the latest video 🎥.

6.30 Four-hour resistance determines the strength of the reboundAt the weekly level, the short-term focus is on the adjustment and continued breaking of the weekly support. As time goes by, the weekly support is at the 3285 watershed. At the daily level, after the price broke the daily support last week, the price continued to rely on the daily resistance to bear pressure. At present, the daily resistance is at the 3355 area resistance. Below this position, gold can continue to be shorted. At the four-hour level, the four-hour key position is the key to our emphasis on short-term trends. At present, the four-hour watershed is in the 3300 area, so the focus is on the gains and losses of this position. Before it breaks up, the short-term focus will be on the pressure first, but once it breaks up, it will need to focus on the rebound to the daily resistance. From the one-hour perspective, the bottom rebounded during the early morning session and broke through the high point of the previous trading day’s early morning retracement, so the short-term is still in adjustment. Temporarily pay attention to the gains and losses of the 3300 position, and treat it as the right-side trading method in terms of operation.

Gold on high time frame
"Hello traders, focusing on gold, the price recently swept liquidity around $3,250 and displayed strong signals indicating a potential upward movement. The next target could be around $3,400."
If you need further clarification or have more details to discuss, feel free to share!

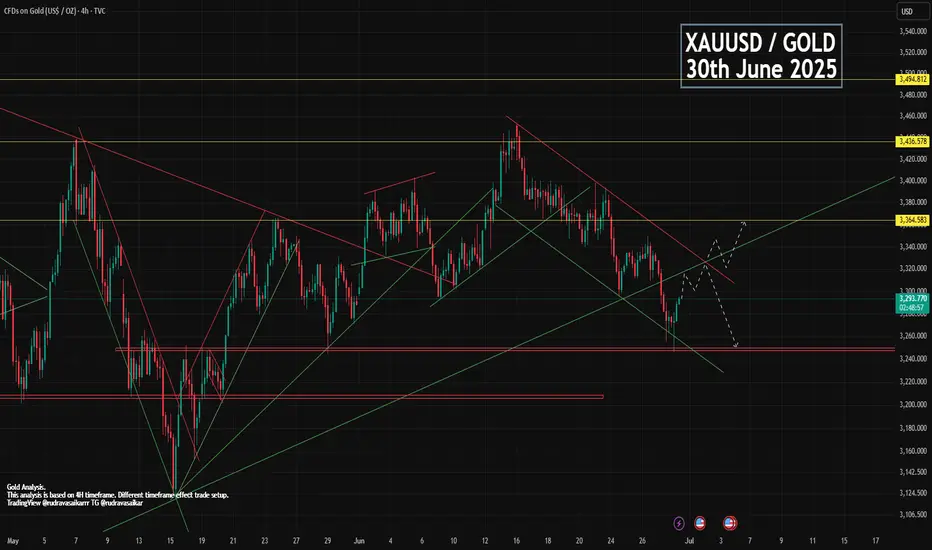
GOLD 30th JUNE - MONTH-END BULLISH OR BEARISHDue to war no update on gold, gold made bolt move downward. Slowly war has been becoming calm but no good news about it has been stopped completely. But you can see some great and correct structure in gold chart where you can find amazing entry and exit points. Gold lower was 1246 since then. Now gold is trading in bullish flag and expecting to breakout. And after breakout we can expect a big move upward.
Key point.
Support - 3248, 3272, 3289
Resistance - 3298, 3313, 3332, 3349
Comment and like for analysis. Love it then follow
Any Query Reach Us or comment down.
Follow for more updates.
Rudra Vasaikar Wishes You A Great And Very Amazing Trading Life. Trade Safe, Trade Right.
RISK WARNING 🔴 🔴 🔴
There is high risk of loss in Trading Forex, Crypto, Indices, CFDs, Features and Stocks. Choose your trade wisely and confidently, please see if such trading is appropriate for you or not. Past performance is not indicative of future results. Highly recommended - Information provided by Rudra Vasaikar/Pro Trading Point are for Educational purpose only. Do your investment according to your own risk. Any type of loss is not our responsibility.
HAPPY TRADING.
Gold continues to be weak, but be careful about operations
📣Gold prices fell 2% last Friday, hitting a near one-month low. Optimistic trade-related agreements boosted risk appetite and weakened the attractiveness of gold as a safe-haven asset. This week, the market will usher in a group meeting of major central bank governors around the world (Fed Chairman Powell, European Central Bank President Lagarde, Bank of England Governor Bailey, Bank of Japan Governor Kazuo Ueda, and Bank of Korea Governor Lee Chang-yong). The market will also usher in non-agricultural data. In addition, Powell's remarks on whether to resign may ignite the market this week. Gold prices may fluctuate more around the lower track of the Bollinger Band at $3,270/ounce this week.
Technical analysis:
Last Friday, the K-line had a lower shadow, and the Bollinger Band did not diverge. It is not easy to go short directly in operation, but wait for the rebound to confirm 3295 and the key resistance of ma5 to be short.
💰 Operation strategy: Rebound to 3280-3283 to go short, target 3270-3265, stop loss 3288-3290

XAUUSD📉 The Setup: Bullish Divergence on XAUUSD (15m/30m)
Buy only on Breakout
🔍 Observation:
On the 30-minute timeframe, price made a lower low while the RSI indicator printed a higher low — classic sign of bullish divergence 🔄.
💡 Translation: Bears are losing steam! Bulls may be preparing to charge in! 🐂⚡
📊 Trade Plan – Long Entry

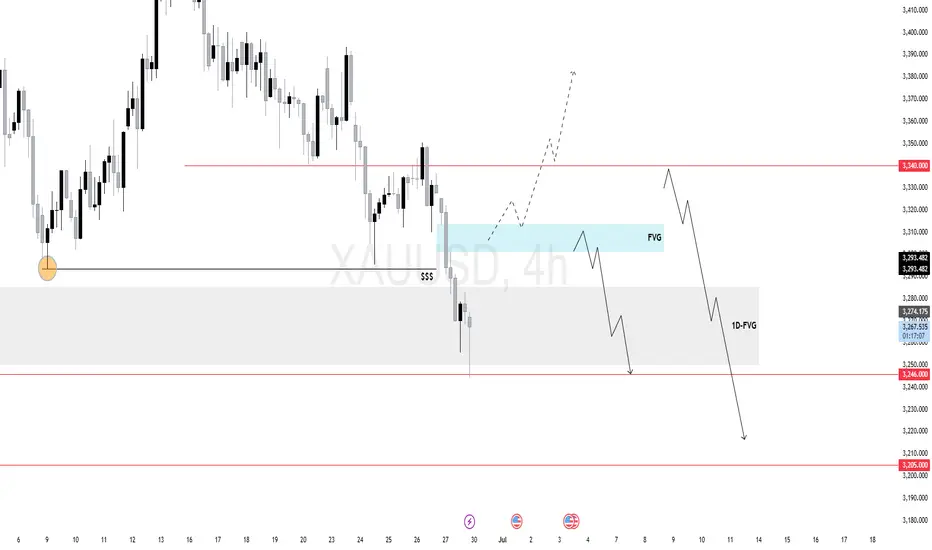
$XAU (XAUUSD) 4H forecastGold swept short-term sell-side liquidity and tapped into a daily FVG, where price is currently consolidating.
The 4H chart shows two potential paths:
Retrace Scenario: Price may rally short-term into the 4H FVG zone for a premium-based entry — ideal area for shorting continuation aligned with the bearish daily and weekly narrative.
Immediate Breakdown: If price rejects at current levels, a continuation toward the 3246 and 3205 daily draw-on-liquidity zones is likely.
XAU/USD) bearish Trand analysis Read The captionSMC trading point update
Technical analysis of (XAU/USD) on a short-term timeframe, incorporating several key tools and concepts:
---
Overview of the Analysis
Price Level (Current): Around $3,273.40
EMA 200 (Blue Line): Around $3,337.95 (signaling broader trend)
Resistance Zone (Yellow Box): Between approximately $3,300–$3,320
Support/Target Zone: Around $3,231.11
RSI (Relative Strength Index): At 32.88, which is near oversold territory (below 30)
---
Interpretation of Chart Structure
1. Descending Channel:
Price is moving within a downward-sloping channel.
Suggests a bearish trend is in play.
2. Resistance Level (Yellow Box):
Price is expected to retest this area and face resistance.
Confluence of a supply zone and upper trendline, reinforcing its strength.
3. Projected Price Action:
Price may climb back up into the resistance zone.
A rejection is anticipated, leading to another leg down.
The target is around $3,231.11, which matches previous measured moves.
4. Measured Moves (Blue Arrows):
Highlights historical price drops of ~79 points.
Repeating this pattern suggests symmetry and continuation.
5. RSI Indicator:
Currently at 32.88: nearing oversold, but not quite.
No clear bullish divergence, so price could drop further.
---
Trade Idea Summary
Bias: Bearish
Entry Zone: Near $3,300–$3,320 (resistance)
Target: Around $3,231.11
Invalidation: If price breaks and holds above $3,337–$3,340 (EMA 200 and channel breakout)
Mr SMC Trading point
---
Caution/Considerations
Watch for false breakouts above the resistance zone.
Monitor RSI for potential bullish divergence that could invalidate the downside.
Be cautious around the U.S. economic news event icon, which might cause volatility.
plesse support boost 🚀 this analysis)

Navigating Gold Futures: Support, Resistance, and ProjectionsCOMEX:GC1!
The chart appears to depict a clear five-wave pattern: I, II, III, IV, and V.
Waves I to III show strong upward movements, indicating bullish sentiment.
Wave IV looks like it could be a corrective phase, with a potential dip before another upward movement in Wave V.
Support and Resistance Levels:
The horizontal lines around 2,800 and 2,575.3 indicate critical Fibonacci retracement levels (38.20% and 50%).
If the price approaches these levels during the correction, they could serve as support, making it a potential buying opportunity.
RSI Indicator:
From the bottom indicator (RSI), we can see fluctuations in momentum, which can aid in timing trades.
Look for interpretations of the RSI: if it trends towards the extremes (overbought/oversold), that could signal reversal points.
Future Projections:
Should the market respect the outlined support levels, Wave V could potentially push towards a new high above 4,000 as indicated by the upward projection.
Market Sentiment:
Overall, the pattern suggests a bullish outlook long-term, but caution is warranted during corrective phases as prices might retrace towards support levels.
