GOLD ROUTE MAP UPDATEHey Everyone,
A PIPTASTIC day on the markets with our analysis playing out in true level to level fashion.
Yesterday we stated that that we had the cross and lock below 3348 opening the swing range, which was hit perfectly and gave the bounce and that we will now wait to see if the full swing is completed to 3348.
- This was played out to perfection with the full swing completed into 3348. No further lock above confirmed the rejection back into the swing range.
We will continue to buy dips using our support levels taking 20 to 40 pips. As stated before each of our level structures give 20 to 40 pip bounces, which is enough for a nice entry and exit. If you back test the levels we shared every week for the past 24 months, you can see how effectively they were used to trade with or against short/mid term swings and trends.
The swing range give bigger bounces then our weighted levels that's the difference between weighted levels and swing ranges.
BULLISH TARGET
3376 - DONE
EMA5 CROSS AND LOCK ABOVE 3376 WILL OPEN THE FOLLOWING BULLISH TARGETS
3395
EMA5 CROSS AND LOCK ABOVE 3395 WILL OPEN THE FOLLOWING BULLISH TARGET
3419
EMA5 CROSS AND LOCK ABOVE 3419 WILL OPEN THE FOLLOWING BULLISH TARGET
3440
BEARISH TARGETS
3348 - DONE
EMA5 CROSS AND LOCK BELOW 3348 WILL OPEN THE SWING RANGE
3330 - DONE
3306 - DONE
EMA5 CROSS AND LOCK BELOW 3306 WILL OPEN THE SECONDARY SWING RANGE
3288
3271
As always, we will keep you all updated with regular updates throughout the week and how we manage the active ideas and setups. Thank you all for your likes, comments and follows, we really appreciate it!
Mr Gold
GoldViewFX
Goldprediction

Gold is sideways. Is a new trend brewing?Information summary:
On June 23, Trump announced that Iran and Israel reached a comprehensive ceasefire, but the asymmetric terms of the agreement caused the conflict to continue. Israel launched another air strike on Iran, and Israel threatened to kill Iranian senior officials. The uncertainty of geopolitical risks continues to support gold prices.
Market analysis:
From the 4-hour chart, the MA5-day and 10-day moving averages show signs of upward divergence, and the K-line stands firm on the moving average support and fluctuates upward. In the short term, pay attention to the breakthrough and decline of the 3350 pressure level. The current market's downward momentum has weakened, and the overall market remains volatile. We need to be wary of the risk of short-term adjustments after continuous surges. Be alert to the short-term adjustment risks after continuous highs.
Operation strategy:
Short near the price rebound of 3345, stop loss 3355, profit range: 3330-3320.

Gold fluctuates at high levels, intraday trading points📰 Impact of news:
1. Initial unemployment claims data
📈 Market analysis:
Gold has begun to show signs of bottoming out in the short term in the past two days. Since the daily line bottomed out and pulled up, the daily line closed positive yesterday, and the bulls began to counterattack, and the 1H low was rising. If it doesn't fall further in the short term, it will most likely bottom out and rebound. The upper pressure is at the Bollinger middle track of 3355, which is also the high point of Tuesday's decline. If gold breaks and stabilizes at this price, it will have a larger upward space, and the upper side will look at 3385. In the 4H chart, MACD temporarily forms a golden cross, which is a bullish signal; but the BOLL track pressure is still there, and gold bears still have momentum in the short term. Therefore, on the whole, in the short term, gold should pay attention to the 3350-3360 resistance above. If it encounters resistance under pressure here, it can consider shorting. Pay attention to the 3330-3320 support area below.
🏅 Trading strategies:
SELL 3350-3360
TP 3340-3330-3320
BUY 3330-3320
TP 3340-3350
If you agree with this view, or have a better idea, please leave a message in the comment area. I look forward to hearing different voices.
TVC:GOLD FXOPEN:XAUUSD FOREXCOM:XAUUSD FX:XAUUSD OANDA:XAUUSD

6.26 Gold intraday analysis and forecast—During the European session on Thursday (June 26), spot gold prices fluctuated significantly during the day, first falling and then rebounding, and are currently around 3337.60, fluctuating in a wide range.
The rebound from Tuesday's low of $3295 has risen above the previous support of $3340 (June 20 low), confirming a deeper bullish correction. The currency pair may be in the C-D leg of a small Gartley pattern, moving towards the downward trend line resistance since the mid-June high (previously $3450, currently $3365).
A break above this level will mark a trend reversal and shift the focus to the $3400 line, which suppressed bulls on June 17, 18 and 22.
On the downside, if the above trend line is blocked, it may first seek support at the intraday low of $3330 before looking at the previously mentioned $3295 (June 9 and 24 lows).

Can we still go long if the decline of gold intensifies?
📊Comment Analysis
Looking back at today's trend, it rose to a high of 3350, and then continued to retreat. The current low is 3310. At present, due to the upward trend line broken by the hourly line, many orders can only be short. The trend is still biased to the short side, and the current market risk aversion does not facilitate the longs. But first of all, one thing can be confirmed that this round of gold decline lasted for a long time, which also enhanced the execution of gold to go long near 3310-3320 in the future.
Since gold has fluctuated greatly in the past two days, it means that the end point of emotions will not disappear so easily for the time being. In the short-term K-line pattern, continuous short-side artillery should not be constantly changed and increased. It is necessary to stop and see appropriately. The early trading is relatively difficult to grasp, but at least the current market has given some signals, so I hope that when the market is in place, your execution will be strong enough, and then you can look at gold according to the trading signals I gave. The rehearsal is definitely exciting enough, but the actual operation is not that simple!
💰Strategy Package
Gold: Pay attention to the low-long opportunities of 3310-3220 in the US market, and defend at the 3300 line. If the retracement continues, go long directly. Otherwise, the upper resistance will be around 3345!
⭐️ Note: Labaron hopes that traders can properly manage their funds
- Choose the number of lots that matches your funds

Gold volatility intensifies. Waiting for direction?The price of gold fluctuated greatly this week, which means that the end point of sentiment will not disappear so easily for the time being; in the short-term K-line pattern, there are continuous ups and downs. If you want to trade steadily, you can wait and see for a while.
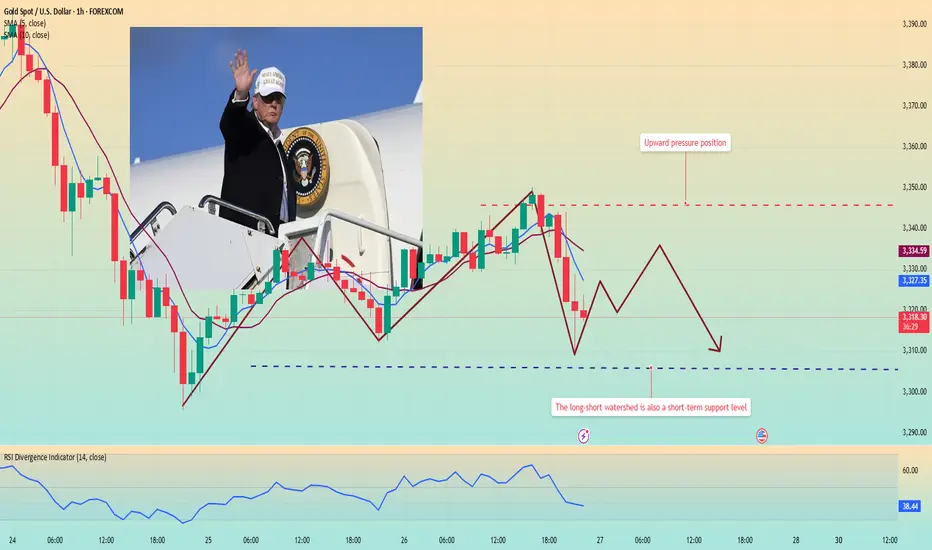
From the hourly chart, the MA5-day and 10-day moving averages cross downward, and the RS indicator hovers around 40.7. This shows that the market trend is weak. The current price has bottomed out near 3310 and rebounded to fluctuate around 3320. The price may continue to decline after a slight rebound.
Today, focus on the long opportunities near 3305 and the pressure position above 3345.
Quaid has always believed that only by insisting on detailed analysis of the market and reducing losses, can we slowly accumulate the principal of the account.
Good luck to everyone.
XAUUSD Outlook: Watching FVG Reaction for Bearish EntryThe previous day’s up-close candle didn’t reflect strong bullish conviction. Although price opened higher than the previous candle’s close, it closed only slightly above — completing the three-candle formation required to establish a Fair Value Gap (FVG).
As expected, buy-side liquidity above the previous day’s high has been raided. Price is now pushing towards the consequent encroachment of the FVG. How the market reacts at this level will be key in determining the next directional move.
While I maintain a bearish bias, I expect the market to trade higher into a bearish order block, providing a potential opportunity to enter short. If price does not react from the current FVG, it could continue higher to sweep liquidity resting above the swing high at 2357.82, which sits just below another unfilled FVG.
Entry Strategy
I will look to enter short only after a clear displacement, signalling a change in state of delivery, either:
Off the reaction from the current FVG, or
From a deeper liquidity zone
If no such confirmation presents itself, I will remain on the sidelines and wait for a more favourable setup.
Thanks for your support!
If you found this idea helpful or insightful, please drop a like 👍 and leave a comment — I’d love to hear your thoughts! 🚀
Follow me for more daily price action insights and trading strategies on XAUUSD and other key markets.
Let’s grow and trade smarter together! 📈
Disclaimer:
This content is for educational and informational purposes only and does not constitute financial or investment advice. All trading involves risk. You are solely responsible for your own decisions, so always conduct proper research and due diligence before taking any trades.
Past performance is not indicative of future results. Trade responsibly.

6.26 Gold intraday operation strategy, rebound 42-48 line shortFrom the 4-hour analysis, the upper resistance is around 3342-48. The intraday rebound relies on this position to continue to be short and follow the trend to fall. The short-term support below is around 3314-3316 integers. The upper pressure is around 3342-48. The overall support relies on this range to maintain the main tone of high-altitude low-multiple cycles. The short-term long-short watershed is 3370. It is difficult to say that it is strong before the daily level breaks through and stands on this position. I will remind you of the specific operation strategy during the session, so please pay attention to it in time.
Gold operation strategy:
1. Short the gold rebound at 3345-48, stop loss at 3356, target 3317-3325, and continue to hold if it breaks;

GOLD - Its breakout? What's next??#GOLD... market broke our resistance area that is 3338 around
So keep close now and sustain above means a bounce expected.
Good luck
Trade wisely

It’s the right time to short goldThe daily gold line presents a three-top gathering pattern. The historical trend shows that the 3290-3280 area has triggered technical pullbacks many times, all of which rebounded to around 3350. The current 4-hour chart trend line suppression level coincides with the Fibonacci 0.618 pullback resistance from the previous high of 3450 to 3300 in the 3350-3360 range. This area constitutes the core pressure zone. If the price fails to effectively break through and stand above 3360 when it probes this area again, it is highly likely to replicate the previous two resistance and fall patterns. At that time, short orders will be arranged based on the 3350 first-line resistance area, with the goal of breaking the key support of 3300 and further looking down at the 3280 and 3260 levels. The overall bearish tendency is maintained, and the resistance to rebound is a signal to enter the market and sell short.
Gold recommendation: Gold is short around 3345-3352, target 3330-3320

Gold Turns Bullish After Clearing Daily Sell-Side LiquidityThe purge of this liquidity indicates that institutional players may have engineered a move to grab orders before initiating a new upward leg. Following this move, price action shows signs of strong bullish intent, such as bullish engulfing candles, increased volume on up moves, or a break above short-term resistance.
This liquidity sweep not only invalidates bearish pressure but also creates a clean bullish imbalance, offering a potential entry zone for buyers. Traders should now watch for:
A break and retest of the key structure above the liquidity sweep.
Bullish order blocks forming on lower timeframes (e.g., H1 or H4).
Confluences like Fibonacci retracement levels, trendline support, or moving average bounces.
As long as price holds above the level of the purge and continues forming higher lows, gold is likely to trend upward in the near term. Potential targets include recent highs or fair value gaps left behind during the bearish move.
This setup favors buying pullbacks rather than chasing price, with invalidation below the recent sweep level.

XAUUSD: Breakout or Bull Trap?Gold (XAUUSD) on the daily timeframe is showing signs of a temporary rebound after a sharp drop from the resistance zone at 3,452 USD. Specifically, the price has bounced back from the support area around 3,291 – 3,298 USD – a region aligned with dynamic EMA support and the 0.382 Fibonacci retracement of the previous bullish leg.
1. Key Technical Structure:
A clear reversal candlestick pattern has formed at a strong support zone, paving the way for a short-term technical rebound.
The 0.5 Fibonacci level at 3,346.5 is currently acting as the nearest resistance – aligning closely with today’s closing price.
EMA 20 and EMA 50 are beginning to converge, indicating market indecision on the next directional move.
2. Short-Term Price Scenarios:
Bullish Scenario: If price holds above the 3,291 – 3,298 support zone and breaks above 3,348, it could retest the 3,400 – 3,452 highs in the coming days. In this case, strengthening EMAs and bullish candle momentum would support this setup.
Bearish Scenario: Conversely, if the price fails to break through the 3,348 – 3,352 resistance zone and falls below 3,291 again, the market may head toward deeper support levels at 3,240 – or even as low as 3,167 USD.
3. Trading Recommendations:
Short-term Buy if there is a confirmed bullish candle closing above 3,348 with strong volume; stop loss below 3,291.
Sell on rally around 3,348 – 3,352 resistance if no clear breakout is confirmed.
Apply strict risk management, especially in a choppy market environment ahead of key macroeconomic data at the end of the month.
Conclusion:
XAUUSD is currently in a “trend re-evaluation zone.” Closely monitoring the 3,291 – 3,348 range will be the key to timing efficient entries in the short term.

XAU/USD) Bullish trand Read The captionSMC trading point update
Technical analysis of Gold (XAU/USD) on the 1-hour timeframe, highlighting a breakout from consolidation supported by key levels and trend structure. Here’s the detailed analysis:
---
Technical Breakdown
1. Key Support Zone
Price has formed a strong base around 3,315–3,325, with multiple bullish rejections (green arrows).
This zone has acted as a demand level, reinforcing bullish structure.
2. Ascending Trendline Support
An uptrend line supports higher lows, showing momentum building to the upside.
3. EMA 200
Price is now challenging the 200 EMA (3,353.41) — a key dynamic resistance.
A successful breakout and retest above this EMA will likely fuel continued bullish movement.
4. Breakout & Measured Move Projections
The chart indicates a bullish breakout from a consolidation box (yellow zone).
Measured move targets based on the previous rally:
First target: 3,368.86 (1.17%)
Second target: 3,381.55 (1.75%)
5. RSI Confirmation
RSI (14) is around 57, showing bullish momentum but still below overbought—supporting further upside potential.
Mr SMC Trading point
---
Conclusion / Idea Summary
Bias: Bullish
Entry Zone: On pullback into 3,330–3,340 range or breakout retest above EMA 200
Targets:
3,368.86
3,381.55
Invalidation: Sustained close below 3,320 and break of the uptrend line
---
Please support boost 🚀 this analysis)

Gold fluctuated slightly, retreating to low-multiple operations
📌 Gold news
During the North American trading session on Wednesday, gold prices remained stable, rising by more than 0.30% as easing tensions between Israel and Iran boosted risk sentiment. Meanwhile, disappointing US housing data may prompt the Federal Reserve (Fed) to take action in the future. However, Fed Chairman Jerome Powell's continued tough stance has limited further upside for gold.
📊Comment analysis
Gold fluctuated in a small range yesterday, and the daily line closed with a positive cross star.
Daily support is around 3327-3324, and you can go long if you touch it.
Daily resistance is around 3368, and you can go short if you touch it.
If the market goes down to yesterday's low, the bottom continues to look near this week's low, and I am more inclined to be bullish
💰Gold operation strategy
If gold is close to 3327, you can go long, with a target of 3345.
Look for opportunities to short around 3350-3360, with a target around 3330.
I hope Labaron's article can help you with your investment. If you don't understand something, you can find me. I am not only a mentor, but also a friend worth making in your life.
⭐️ Note: Labaron hopes that traders can properly manage their funds
- Choose the number of lots that matches your funds

XAU/USD – Smart Money Building Toward $3360? |26 June 2025Gold (XAU/USD) is pushing into fresh highs around $3337, and we may be approaching a key inflection point. But beneath the surface of candles and wicks lies the real story — one written by liquidity, displacement, and smart money positioning.
This outlook breaks down gold’s price action using Smart Money Concepts (SMC), price structure, and Fibonacci confluence, to help identify the most probable high-value trade zones for both swing and intraday traders.
4H Outlook – Institutional Flow & Structure
Market Structure
Gold recently broke above the $3310–$3320 resistance, confirming a bullish Break of Structure (BOS). This keeps the market in a sequence of higher highs and higher lows, validating continued bullish pressure.
Smart Money Insights
BOS: Clean break above $3320 signals strength.
CHoCH: None yet — trend remains bullish.
Liquidity Sweep: Sell stops below $3295 have already been taken.
Buy-Side Liquidity: Sits above $3350 — price may gravitate there next.
FVG: Unfilled Fair Value Gap between $3314–$3322 — possible retracement zone.
Bullish OB: Identified between $3300–$3310, aligned with FVG and BOS level.
Equilibrium: Using $3275 (swing low) and $3342 (swing high), the midpoint sits near $3308, acting as fair re-entry value.
Key Zones
Buy Zone (Demand): $3295–$3310 — OB + FVG + Fib confluence.
Sell Zone (Supply): $3350–$3360 — next likely liquidity target.
Bias Summary
As long as price remains above $3295, the bullish structure stays valid. Watch for a retracement into $3308–$3316 for potential continuation toward $3350–$3360. Price may briefly dip below $3310 to trigger liquidity before moving higher.
1H View – Precision Entries
Structure
Following the high at $3342, price has pulled back slightly and is forming what appears to be a bullish flag — often a continuation pattern.
Smart Money Zones (1H)
FVG: $3315–$3322 — potential short-term reaction zone.
Order Block: $3305–$3312 — 1H bullish OB aligned with 4H bias.
Sell-side Liquidity: Swept at $3295 earlier this week — supports continuation.
Trade Setups
Long Setup #1 – Optimal Entry
Entry: $3308–$3315
Stop: Below $3295
TP: $3342 (partial), $3350–$3360 (full)
Why: Strong zone combining FVG, OB, and Fib support.
Long Setup #2 – Aggressive Entry
Entry: $3316–$3320
Stop: $3300
TP: $3340–$3350
Why: Quicker entry inside the imbalance — riskier but valid.
Short Setup – Countertrend (Low Conviction)
Only valid on a clear break below $3310 + CHoCH
Entry: Below $3310 (confirmed)
Target: $3295
Note: Lower confidence unless 1H structure turns bearish.
Final Notes
The bias remains bullish above $3301–$3308. This is a high-probability area to look for long setups on retracement. Avoid shorts unless we see a confirmed structural shift with a CHoCH and OB breakdown.
Expect the market to potentially hunt stops below $3310, then aim for liquidity sitting above $3350–$3360.

Gold continues to fluctuate. Waiting for a trend?Today, gold has been suppressed below the high of 3345, and the hourly line tends to be weak. Looking at the number of Yin and Yang lines on the hourly line during the fluctuation, we can see that the typical Yin line is continuous and the Yang line is few, plus the weak suppression of the previous day, from the rhythm point of view, it is a weak signal.
From the hourly chart, around 3312, this is the 0.618 position of the retracement of the 3295-3337 fluctuation range. The decline is slow during the day, and the 0.618 position has become a support rebound.
And the current trend, like the previous day, may continue to rebound and then fall. At the same time, there was no cyclical decline in the early Asian session. Instead, it fluctuated sideways, bottomed out and rebounded, and then continued to return to the high of the previous day.
Judging from the current market situation, the Asian market bottomed out and rebounded in the morning, reaching a high of around 3343, and then began to fall back, and is currently fluctuating around 3335.
The trend of the European session is very critical, and the focus is on the watershed below 3328. If this position falls below, the price will most likely continue to fall.
Operation strategy:
Short around 3340, stop loss 3350, profit range 3320-3310.

Gold Price Struggles at Key Support ZoneTechnical Analysis – Data as of June 25–26, 2025
In the latest trading sessions, XAUUSD continues to move within a narrow range, reflecting a cautious market sentiment awaiting clearer signals. The daily chart shows price hovering around the 3,341 USD level — aligning with the 0.618 Fibonacci retracement and intersecting key descending trendlines and previous correction zones.
1. Notable Price Action:
Gold has bounced slightly from the 3,294 USD support and retested the 3,360–3,365 USD resistance but failed to break through.
Small-bodied candles with long wicks indicate indecision, suggesting that neither buyers nor sellers have a clear upper hand.
The descending trendline (blue line) is acting as a significant resistance barrier, with each bullish attempt being rejected.
2. Key Support and Resistance Levels:
Immediate Support: 3,294 – 3,296 USD
Nearby Resistance: 3,360 – 3,365 USD
Crucial Breakout Zone: 3,382 – 3,394 USD (Fibonacci 0.618 – 0.786 of the latest downleg)
3. Short-Term Trading Strategy:
If XAUUSD maintains support above 3,294 USD, a short-term technical rebound toward 3,360 – 3,394 USD is possible.
However, a clean break below 3,294 with strong volume could trigger further downside momentum, potentially targeting 3,265 USD or even 3,221 USD.
4. Overall Outlook:
The market is currently in a state of uncertainty, with neither side showing dominance. Traders are advised to wait for a decisive breakout in either direction before entering new positions. Breakout trading strategies with volume confirmation should be prioritized in this phase.

Gold may continue to rebound to 3350-3360If gold can stand above 3330 today, it will stimulate long trading behavior to a certain extent, especially the self-rescue behavior of trapped longs. Gold may continue to rebound and is expected to reach the 3345-3355 area. So there is no need to risk shorting gold near 3330 for the time being; although gold may continue to rebound, it is still under pressure in the 3350-3360-3370 area; and gold is still weak overall, so we can consider shorting gold in the 3350-3360 area and look at the target area of 3325-3315.
The Premium privilege of my account will end on June 26, and it will stop updating here from tomorrow. Friends in the channel have already made a lot of money by following my trading strategy. Friends who have not joined yet can join and receive the latest trading strategies and trading signals as soon as possible to escort your trading!

6.26 Gold intraday analysis guideOn Wednesday (June 25), international spot gold rose slightly during the US trading session, but was still suppressed by the 20-day moving average (US$3,355). The RSI (14) was at 48.7, in the neutral range of 40-60, suggesting that the market lacks a clear direction. US$3,355 (20-day moving average) has become the recent watershed between long and short positions. If it breaks through this level, it may test the psychological barrier of US$3,400. The support below is US$3,245 (the low point on May 29). If it fails, it may drop to the integer level of 3,200 and US$3,121 (the low point on May 15). Stability of the geopolitical situation: If the ceasefire agreement in the Middle East continues, the outflow of safe-haven funds may further suppress the gold price. Fed policy expectations: If the July non-agricultural and CPI data show that inflation is cooling down, it may rekindle expectations of interest rate cuts and boost gold. The current gold market is in a "wait-and-see mode", and both long and short sides lack decisive momentum. Traders need to pay close attention to: US economic data: especially employment and inflation indicators for the Fed's policy path. Geopolitical dynamics: Any breakdown of the ceasefire agreement could quickly push up safe-haven demand. Dollar trend: If the Fed maintains a hawkish stance, a stronger dollar may further suppress gold prices. Gold is expected to maintain range fluctuations in the short term, with the $3,355 moving average resistance and $3,245 support forming a key trading range. The direction of the breakthrough depends on new fundamental catalysts.
Personal operation analysis:
Trend: Oscillating trend
Support: Near 3,300.00
Resistance: Near 3,335.50
Strategy:
View logic: Short view near 3,335-3,340, stop loss 3,345, take profit near 3,300--3,280, and follow the stop loss 300 points.

GOLD - Near to CUT n REVERSE Area? What's next??#GOLD... market placed a very reasonable high that is around 3338-39 around
Keep close that area because if market holds then drop expected otherwise not..
Note: we will go for cut n reverse above 3338-39 on confirmation.
Good luck
Trade wisely

Gold Short Term OutlookYesterday, we noted that gold needed to close and hold above the $3,330 resistance to open the path toward $3,346 and potentially $3,375.
Since then, price rejected the intraday support and is now trending above the $3,330 level.
Currently, the 50MA is acting as dynamic resistance. A clean break above it could trigger a move toward $3,346 and possibly higher resistance zones.
However, if bullish momentum fades, price may drop back toward the key support area, where buyers could look to step in again.
🔑 Key Levels:
Resistance:
$3,330 • $3,346 • $3,361 • $3,375
Support:
$3,306 • $3,287 • $3,271 • $3,242

BTC continues to short at high levels during the day📰 Impact of news:
1. Geopolitical impact
📈 Market analysis:
BTC has reached an intraday high of 108,125, just one step away from the all-time high of 112,000. With the increase in trading volume and institutional sentiment turning bullish, the momentum seems to be in the bulls' favor. In addition to institutional buying, the ceasefire agreement in the Iran-Israel war is also an important factor in Bitcoin's sharp rebound. Trump's announcement of the end of the war almost immediately triggered a surge in the cryptocurrency market. However, the overall pattern has not changed, and the range resistance has not been broken, so we still keep the idea of shorting at high levels.
🏅 Trading strategies:
SELL 108000-107500
TP 104500-103500
If you agree with this view, or have a better idea, please leave a message in the comment area. I look forward to hearing different voices.

GOLD ROUTE MAP UPDATEHey Everyone,
Another smashing day on the charts with our levels being respected perfectly inline with our plans to buy dips.
After completing our bearish 3348 and bullish 3376 target we had the cross and lock above 3376 leaving a gap to 3395, which fell short just by few pips.
We then had the cross and lock below 3348 opening the swing range, which was also hit perfectly. We got the perfect bounce, just like we analysed allowing us to buy dips and now seeing the swing range carry out the move. We will see if this is completed for the full swing range 3348.
We will keep the above in mind when taking buys from dips. Our updated levels and weighted levels will allow us to track the movement down and then catch bounces up.
We will continue to buy dips using our support levels taking 20 to 40 pips. As stated before each of our level structures give 20 to 40 pip bounces, which is enough for a nice entry and exit. If you back test the levels we shared every week for the past 24 months, you can see how effectively they were used to trade with or against short/mid term swings and trends.
The swing range give bigger bounces then our weighted levels that's the difference between weighted levels and swing ranges.
BULLISH TARGET
3376 - DONE
EMA5 CROSS AND LOCK ABOVE 3376 WILL OPEN THE FOLLOWING BULLISH TARGETS
3395
EMA5 CROSS AND LOCK ABOVE 3395 WILL OPEN THE FOLLOWING BULLISH TARGET
3419
EMA5 CROSS AND LOCK ABOVE 3419 WILL OPEN THE FOLLOWING BULLISH TARGET
3440
BEARISH TARGETS
3348 - DONE
EMA5 CROSS AND LOCK BELOW 3348 WILL OPEN THE SWING RANGE
3330 - DONE
3306 - DONE
EMA5 CROSS AND LOCK BELOW 3306 WILL OPEN THE SECONDARY SWING RANGE
3288
3271
As always, we will keep you all updated with regular updates throughout the week and how we manage the active ideas and setups. Thank you all for your likes, comments and follows, we really appreciate it!
Mr Gold
GoldViewFX
