XAU/USD Double Bottom Breakout Bullish Momentum Incoming!XAU/USD Double Bottom Breakout 💥 | 🚀 Bullish Momentum Incoming!
Analysis:
🟡 Double Bottom Pattern: Two clear lows have formed around the $3,340 support, signaling a potential reversal.
🟦 Accumulation Zone: The price consolidated in a range, indicating strong buying interest before the breakout.
🟣 Bullish Momentum: Recent aggressive bullish candles show strong buying pressure.
📈 Breakout & Retest Zone: If the price holds above $3,370, a bullish continuation toward $3,409 and possibly $3,445 is expected.
🧭 Target Area: Marked with a blue box, the upside potential is clearly projected.
Conclusion:
A successful retest of the breakout level may lead to a strong bullish run. Keep an eye on $3,370 as the pivot zone. 🎯
Goldprediction

Conflict breaks out, risk aversion rises, can 3400 be broken?Bowman's dovish comments in the afternoon eased the market, by which time risk aversion was deepening as sudden geopolitical conflicts continued to deepen. Will the USA make a corresponding response to this matter? This series of events has once again put gold into a complicated situation. Can gold hit the 3,400 mark today?
Free trading strategies are updated daily🌐. All trading strategies released since this month have been verified and can serve as a good reference📈.👇 I sincerely hope that these strategies can be helpful to you👇.
OANDA:XAUUSD FX:XAUUSD FOREXCOM:XAUUSD FXOPEN:XAUUSD TVC:GOLD

Gold Market Analysis: Key Levels and Trends 23/June/2025 Core Themes
1. Geopolitical Drivers: Escalating tensions in the Middle East, particularly U.S. airstrikes on Iranian nuclear facilities, are fueling gold's "flight to safety" narrative. Analysts anticipate sustained demand for gold amid potential regional conflict.
2. Technical Bullish Bias: Gold is in an uptrend, respecting key support levels and forming higher lows within an ascending channel. Breakouts above resistance (e.g., $3,439–$3,501) could validate further gains.
3. Correction vs. Continuation: While short-term pullbacks are expected (e.g., testing $3,320–$3,200), the broader bullish structure suggests corrections are temporary.
---
Key Technical Levels
Support:
- Immediate: $3,320 (lower channel boundary)
- Deeper: $3,200 (critical level; break could extend corrections)
Resistance:
- Short-term: $3,378–$3,382 (upper channel boundary)
- Mid-term: $3,439 (previous resistance; target for bullish continuation)
- Long-term: $3,501 (potential next resistance; requires strong momentum)
Fibonacci Retracements:
- 23.6%: $3,360–$3,370 (support zone for long entries)
- 50.0%: $3,400 (conservative take-profit target)
- 61.8%: $3,415 (key golden ratio level; likely Wave (5) peak)
- 100%: $3,435–$3,440 (aggressive target; upper channel line)
---
Trade Setups & Strategies
1. Long Entry:
- Target: $3,400–$3,435 (Fibonacci extensions)
- Stop-Loss: Below $3,315 (break of key support)
- Entry Zone: $3,360–$3,370 (near ascending channel support and 23.6% Fib)
2. Bullish Confirmation:
- Breakout Above $3,378: Validates continuation toward $3,439 and $3,501.
- Volume Increase: Confirms strength at key levels (e.g., $3,360–$3,370).
---
Risk Management & Key Risks
- Stop-Loss Placement:
- Longs: Below $3,315 (protects against deeper corrections).
- Shorts: Above $3,350 (avoids false breakouts).
- Volatility: Monitor geopolitical developments (e.g., U.S.-Iran escalation) that could trigger rapid price swings.
- Correction Risks: If gold fails to hold $3,320, a drop to $3,200 may occur, requiring tighter stops.
---
Fundamental Outlook
- Safe-Haven Demand: Rising tensions are likely to sustain gold's appeal.
- Inflation & Rate Outlook: Persistent inflation concerns and potential rate cuts (if economic data weakens) could further support gold.
- Negotiation Risk: De-escalation or Iran's concessions may pause the bullish momentum, leading to a reversal toward $3,340–$3,320.
---
Conclusion
Gold is in a strong bullish phase, driven by geopolitical risks and technical structure. Traders should focus on buying dips near $3,320–$3,370 with targets toward $3,439–$3,501. However, monitor the $3,320 support and geopolitical developments closely. If the trend breaks, a retest of $3,200 could follow. Always use stop-losses to manage risk.
Final Note: The market is highly volatile, so position sizing and risk management are critical. Stay alert for news updates and technical confirmations (e.g., closes above $3,378)

GOLD ROUTE MAP UPDATEHey Everyone,
Great start to the week with our new 1H chart playing out to perfection!!!
We started with a gap on market open clearing our Bullish target. We then got our bearish target at 3348, followed with no ema5 cross and lock confirming the rejection into our bullish target 3376.
We now have ema5 cross and lock above 3376 opening 3395.
We will see levels tested side by side until one of the weighted levels break and lock to confirm direction for the next range.
We will keep the above in mind when taking buys from dips. Our updated levels and weighted levels will allow us to track the movement down and then catch bounces up.
We will continue to buy dips using our support levels taking 20 to 40 pips. As stated before each of our level structures give 20 to 40 pip bounces, which is enough for a nice entry and exit. If you back test the levels we shared every week for the past 24 months, you can see how effectively they were used to trade with or against short/mid term swings and trends.
The swing range give bigger bounces then our weighted levels that's the difference between weighted levels and swing ranges.
BULLISH TARGET
3376 - DONE
EMA5 CROSS AND LOCK ABOVE 3376 WILL OPEN THE FOLLOWING BULLISH TARGETS
3395
EMA5 CROSS AND LOCK ABOVE 3395 WILL OPEN THE FOLLOWING BULLISH TARGET
3419
EMA5 CROSS AND LOCK ABOVE 3419 WILL OPEN THE FOLLOWING BULLISH TARGET
3440
BEARISH TARGETS
3348 - DONE
EMA5 CROSS AND LOCK BELOW 3348 WILL OPEN THE SWING RANGE
3330
3306
EMA5 CROSS AND LOCK BELOW 3306 WILL OPEN THE SECONDARY SWING RANGE
3288
3271
As always, we will keep you all updated with regular updates throughout the week and how we manage the active ideas and setups. Thank you all for your likes, comments and follows, we really appreciate it!
Mr Gold
GoldViewFX

XAUUSD Analysis todayHello traders, this is a complete multiple timeframe analysis of this pair. We see could find significant trading opportunities as per analysis upon price action confirmation we may take this trade. Smash the like button if you find value in this analysis and drop a comment if you have any questions or let me know which pair to cover in my next analysis.

Gold is moving upward. Testing the ultimate pressure.Gold opened high at around 3397 and then quickly retreated. After hitting the lowest point of around 3346 in the European session, it continued to rebound. It fluctuated in a large range around 3360-80 many times, which also added a lot of confusion to the market.
After retreating to around 3355 again, it continued to move upward, reaching a high of around 3389. At present, the market still has upward momentum, and the key pressure above is maintained at 3400, which is also the previous high point and the last line of defense for the bears. If this position continues to be broken, the bulls may continue to move upward without resistance in the later period, with the target price around 3430-3450. The key support below is still maintained in the range of 3355-3340.
Judging from the current market, the short-term fluctuations may continue to expand, and the ultimate target above is maintained at around 3400. This position is likely to be broken, but the probability of continuing to rise is small. The current bulls may still be in a form of enticing more.
Operation strategy:
Short near 3395, stop loss 3410, profit near 3375.
If it continues to break below 3370, it will be seen around 3340. If it breaks through the extreme pressure level of 3400, we need to consider stopping the loss in time. .

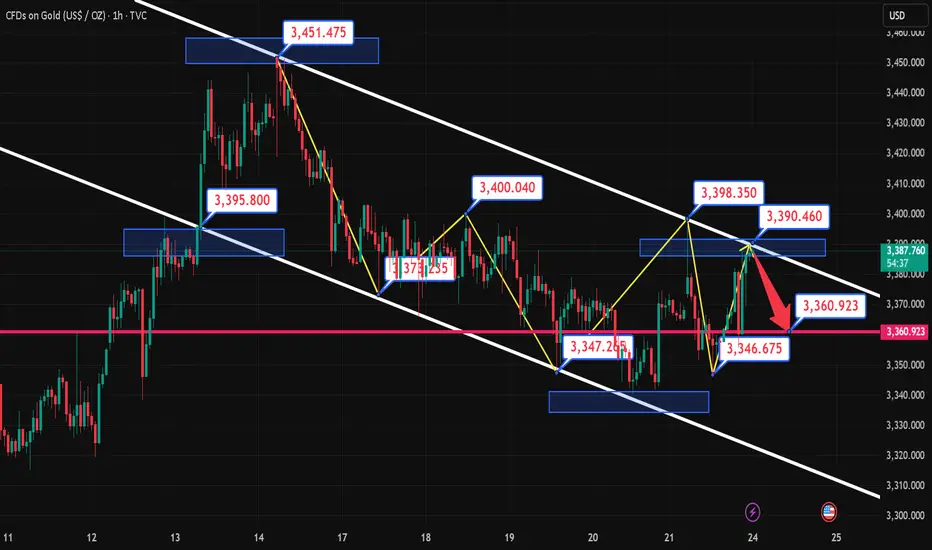
6.24 Gold resistance strengthens + kinetic energy exhaustionGold prices have fallen under pressure near $3,380 several times, and this area gathers three technical resistances:
1. The daily Bollinger band middle track 3,375 and the upper track 3,450 form a suppression.
2. The previous high of $3,400 plus the Fibonacci 38.2% retracement level constitutes a concentrated selling pressure area.
3. The previous high of $3,451 failed to break through effectively, forming a bearish structure with the second highest point moving down.
Risk of breaking the shock range: Gold continues to trade sideways in the 3,300-3,450 range, but the K-line continues to close in a small real body alternating yin and yang pattern, indicating that the long and short momentum is exhausted. If it falls below 3,350 , a technical sell-off will be triggered, with the target pointing to 3,300-3,330!
SELL: 3,388\3,393 Stop loss: 3,398
Target: 3,360
Profit point: 30
GBPUSD Trading Strategy for the WeekGBPUSD is reacting at the support zone of 1.34000. This is the last important support zone that the pair is facing. If this support zone is broken, the pair will enter a prolonged Downtrend phase. 1.325 could be the target for this decline.
If the 1.34000 zone is pushed up by buyers, the pair will touch the 1.35000 border zone. If this zone is broken, the pair will form a double bottom pattern and continue to increase back to the peak of last week around 1.36000. In case the buying force is not strong enough to break 1.35000, the pair will return to the sideway in the rectangular border.
Support: 1.32500
Resistance: 1.36000
Break out: 1.34000-1.35000
Recommended good trading strategy:
Trade when price confirms in Break out zone.
BUY 1.32600-1.32400 Stoploss 1.32000
SELL 1.35900-1.36100 Stoploss 1.36400

6.23 Gold Short-term Technical AnalysisStimulated by geopolitical conflicts such as the US airstrike on Iran's nuclear facilities on Monday, gold opened $24 higher at 3398 in the early trading. However, it failed to continue the upward trend and quickly fell back to the 3360-65 area. Retrieve all the gains!
Technical analysis: 4-hour head and shoulders top pattern: right shoulder 3373 neckline 3340 MACD dead cross diverges downward Bollinger band opening expansion and price running near the lower track, short-term trend is bearish, and the daily line is still in the rising channel!
Short-term operation:
SELL: 3375\3385 Stop loss: 3390
$1:3360 $2:3340
BUY: 3338\3345 Stop loss: 3353
$1:3380 $2:3400
Operation suggestion: High-altitude is the main, low-multiple is the radiation

Gold XAU/USD Bullish Reversal Setup – Targeting $3,454.65Price: $3,384.41
Strategy: Buy/Long
🟦 Key Levels:
Entry Zone: Around $3,345.76
This level aligns with a previously tested support zone marked in purple.
Stop Loss: $3,331.56
Below the support zone, providing downside protection if the setup fails.
Target (TP): $3,454.65
Marked as EA TARGET POINT, suggesting a potential upside of 3.16% (~$105.83 gain).
📊 Technical Indicators:
Moving Averages:
200 EMA (blue): Near the entry level, adds strength to the support zone.
50 EMA (red): Recently crossed below price, indicating early bullish momentum.
Price Action:
Sharp bounce from support suggests buying interest.
Potential inverse head and shoulders pattern forming, which is a bullish reversal pattern.
🧠 Trade Idea:
Buy near $3,345.76,
Stop Loss at $3,331.56,
Take Profit at $3,454.65
Risk/Reward Ratio ≈ 1:3.3 — favorable setup for long positions.

6.23 Gold Short-term Technical GuidanceThe current price is in the double-line interval of 3350-3375 on the hourly chart. Please note that the four-hour lifeline 3368 is also the resistance point determined by the last rebound in the Asian session.
The Asian session fell under pressure and returned to the sweeping range. It was treated as a sweep. The European session was able to hold the 3350 mark. Look up to find the 3368 area, followed by 3375 and 3385-3388.
If the European session falls below and closes below 3350, the short-selling forces are dominant. The four-hour lifeline 3368 is used as suppression. Look down to find 3333-3331, followed by 3320-3315

Short gold, gold still has at least one chance to pullback!At present, gold has rebounded to the 3370-3380 area again, which largely confirms that 3350-3340 is the bottom area at this stage. However, what we still cannot underestimate is that even with the support of safe-haven, gold has still failed to effectively break through the resistance of 3385-3395-3405 area, and even fell under pressure several times. To a certain extent, it weakened the willingness and confidence of bulls, so it aggravated the trend of wide fluctuations in the short term. During this period, we must pay attention to the rhythm change of gold.
According to the current bullish strength of gold, I think gold does not have the conditions to directly break through the heavy resistance of 3385-3395-3405 area for the time being, so gold still needs at least one retracement expectation, so I think we can still try to short gold in the 3375-3385 area, but the retracement expectation should not be too large, 3365-3355 is enough!

Gold opens high and moves lower, focus on 3340 support📰 Impact of news:
1. Federal Reserve Board member Bowman speaks on monetary policy and the banking industry
2. The United States intervenes in the Iran-Israel conflict and pays attention to the geopolitical situation
📈 Market analysis:
In the early Asian session, gold prices surged but failed to break through the key watershed of 3405. The current risk aversion conflict failed to break through the key resistance level, so the short-term trend is still weak and bearish. On the hourly chart, gold continues to retreat. As the current short-selling momentum continues to gain momentum, we will first look at whether the double bottom support of 3340 is effective. If it fails to break through while retreating, we can consider a short-term upward rebound in the support and consider going long. Looking at the second decline point at 3370-3375, unless the news stimulates the gold trend, you can still consider placing short orders if it touches the 3370-3380 line! On the whole, pay attention to the resistance line of 3370-3380 above and the support line of 3345-3335 below.
🏅 Trading strategies:
BUY 3350-3345-3335
TP 3360-3370-3380
SELL 3370-3380
TP 3360-3350-3345
If you agree with this view, or have a better idea, please leave a message in the comment area. I look forward to hearing different voices.
OANDA:XAUUSD FX:XAUUSD FOREXCOM:XAUUSD FXOPEN:XAUUSD TVC:GOLD

Trade Idea: Long XAUUSD (BUY STOP)1️⃣ Multi-Timeframe Structure
• 1 Hour (Macro):
• Trend: Bullish. 20 SMA is riding above the 50 SMA .
• Price has broken above the prior resistance at 3374.50 and is now retesting it as support.
• 15 Minute (Tactical):
• After a clear push down into 3340.37, price rallied back above 3374.50.
• SMAs have flipped back bullish, and volume during the retest shows absorption of selling pressure.
• 3 Minute (Entry Precision):
• Micro-green candle wicks show a small scratch of buyers stepping in just above 3374.50.
• Momentum is picking up to the upside, but we want confirmation of strength before committing.
⸻
2️⃣ Trade Execution
▶️ Entry: Buy Stop at 3379.50
• Wait for a clean 3 m/15 m push above the short-term swing high (~3379) to confirm buyers are in control.
✂️ Stop Loss: 3374.50
• Just below the broken resistance-turned-support level.
• True structural invalidation of this bullish thesis.
🎯 Take Profit: 3394.50
• Targets the next logical resistance cluster (round number area and prior swing highs) for ~15 pt gain.
Risk-Reward ≈ 1:3 (SL = 5 pts, TP = 15 pts)
⸻
3️⃣ Invalidation & Expiry
❌ Cancel the pending Buy Stop at 3379.50 if either:
1. A full 15 m candle closes below 3374.50 before entry.
2. It’s not triggered by 8:30 AM PST.

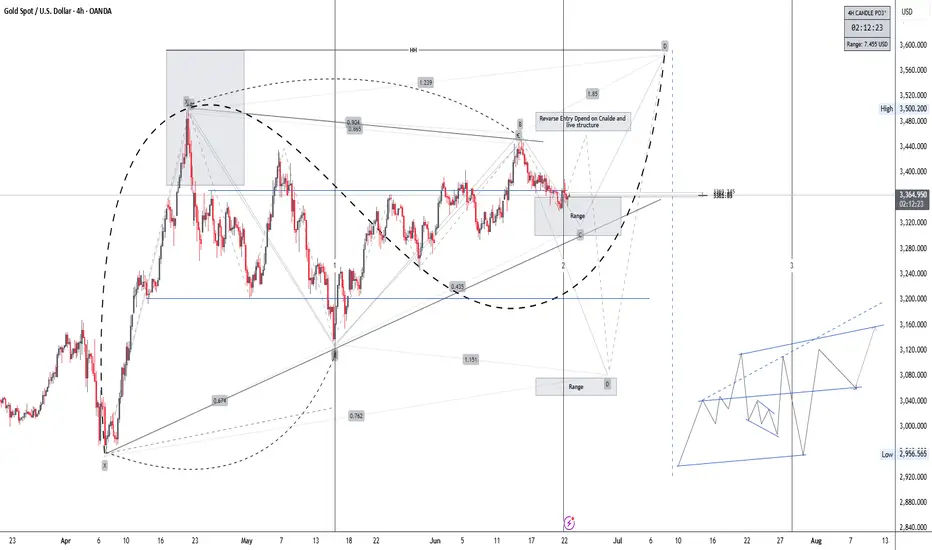
XAUUSD H4Gold is forming a bullish structure on the 4H chart. Price is consolidating at a key reversal zone (Point C). If we get bullish confirmation, I’m targeting:
$3,400 short-term
$3,500 next
$3,560+ final leg (Point P)
Support at $3,300 must hold—below that, I’ll re-evaluate.
Watching closely for a breakout and retest above the trendline before entering.
Not financial advice – just my view.
Is World War III not far away?
The market has always been a zero-sum game between longs and shorts. No matter how successful you are in other aspects, in the market, winning and losing are the only criteria. Recently, many traders have been asking what to do if gold and crude oil lose money? How to recover the losses? In fact, it is normal to have such concerns. After all, as long as it is an investment, there will be risks. And facing this risk of loss, most traders will be panicked, so here I am your beacon in the endless darkness!
The ultimate question of the conflict: Is war inevitable?
The key variable of the current situation lies in Iran’s way of retaliation: will it choose a small-scale attack on the US military base to shock the tiger, or will it go all out to block the Strait of Hormuz? The US military deployment also reveals subtle signals: the "Ford" aircraft carrier battle group has entered the Arabian Sea, and the B-52 bomber has entered the Al Udeid base in Qatar. This "force deterrence + limited strike" strategy seems to avoid a full-scale war with Iran while trying to curb its nuclear program.
However, history has repeatedly proved that the "powder keg" in the Middle East is never short of sparks - a gunshot in Sarajevo in 1914 triggered World War I, and a bottle of laundry detergent became an excuse for the Iraq War in 2003. Today, when news of US fighter jets bombing Iranian nuclear facilities comes out, and when Iran lists US citizens as targets, the direction of this conflict has gone beyond the "controllable range".
For ordinary investors, whether war breaks out or not, the value of gold as crisis insurance has been redefined, and every alarm in the Middle East may become a charge for gold prices to rebound.
Interpretation of gold trend in European session
Gold trend surged at the opening, but failed to break through the watershed line of 3405 expected at the weekend. At present, the support of risk aversion conflict failed to break through the key resistance level. The short-term trend is still the same as last week's analysis. It is still weak and bearish. The stimulus of news can only have a certain impact on short-term operations, and will not change the trend. At present, we have been insisting on seeing a break and fall last week, but it has not come yet. The first test position this week is still the small double bottom of 3340!
Gold continues to retreat on the hourly line. Under the current situation where the short-selling momentum continues to exert force, first see whether the double bottom support of 3340 is effective. If the early retreat is in place and fails to break through, it can be seen that the support is short-term rebound upward. The second decline point of 3372-75 is seen above. Unless the United States makes trouble again, it is still possible to arrange short orders!
Gold: Retracement to 3338-40, defense at 30, target at 3365-70! Short at 3372-75 when it pulls back, defend at 3380, target at 3345-40!

Watch out! XAUUSD Spot Gold in a ranging zone . Ranging move ..XAUUSD Spot gold has been in a ranging zone with low downward momentum sideway moves since 18 June 2025 till date (23 June) .
Short term traders - watch out from getting stuck in trades. This is a time to Analyse - wait and watch the region for next major break outs.
Next upward break out : USD 3394.75
Next downward break out : USD 3340.45

Let’s talk about gold’s movement
This week, the fundamentals are relatively relaxed. The two sides of the Middle East war continue to fight each other. The market is relatively tired, resulting in the relative weakness of gold, silver and oil. From the technical perspective, the gold price continues to fluctuate and fall. After falling to the bottom, it rebounds rapidly. The overall bulls are strong again. Let's briefly sort it out:
1: Fundamentals: Market aesthetic fatigue leads to continuous adjustment of gold, silver and oil;
2: Technical aspect, the fundamentals are relatively weak, resulting in the technical adjustment of "up and down puncture" to wash the plate!
To sum up: This week's trend is very difficult to operate; long, the fundamentals are weak; short, the overall risk aversion has not disappeared; therefore, there is a trend of constantly piercing the lows, and then constantly pulling up; the overall trend is a decline of three and a rise of two!
The current overall environment:
1: Fundamentals:
The first stage: The Middle East war is still going on, the two sides continue to fight each other, and their attitudes are strong; the opposing forces of the camps are obvious; the impact is far-reaching! The first stage is a continuous confrontation; risk aversion is born, assisting the strong rise of gold, silver and oil; we are still in the first stage!
The second stage: the opposing camp forces gradually exit; for example, the United States decides whether to exit within 2 weeks, which is actually waiting for the intensity of Iran and Israel's next move. The United States exits and the war expands; the United States and the West exit indirectly, and the Middle East war becomes protracted. Refer to the Russian-Ukrainian war. The United States and the West continue to wait and see, then the Middle East war will form a multi-to-one situation, which is relatively unlikely. Israel is a "nail household" placed in the Middle East by the United States and the West. The United States and the West will not sit idly by and watch Israel being completely defeated.
The third stage: the end of the war; this stage is far away; refer to the current Russian-Ukrainian war; once the war starts, it will not end easily, whether it is an agent, the forces behind the camp, or the forces of a third party, without the final benefits in hand , will not end the war, such as the chaebols that support it, the military and industrial enterprises that support it, the political ladder strategic goals that support it, etc.
To sum up: we are currently in the first stage of the war, and the subsequent second stage is the core stage of the market, so we have to be careful about risk aversion repeatedly, and be careful about risk aversion rekindling, so that the bulls can "stir up a thousand waves again, but at this stage, the market continues to pierce and wash the market, which makes us very uncomfortable! We can only choose to follow the trend, and then choose different support levels, and deal with it mainly in line with the trend
This week's trading ideas: First, they are all trend-following ideas, and second: they are all support points, but they are not very smooth, and the uninterrupted piercing, stopping the decline, and pulling sharply are all uncomfortable
Next week's market outlook:
1. Weekly K, it is still a time-for-space mode, the price is resistant to falling, the indicator is corrected, here 3500 is definitely not a high point in the future; but it still takes time to promote the continuous upward attack of weekly K! Therefore, from a long-term perspective, I still suggest that gold is mainly bullish;
2. Daily K, the stochastic indicator continues to be near the central axis, forming a bottoming out and rebounding; the indicator is in a dead cross, the price is resistant to falling, and the market is washed here, washing "the sky is hanging and the earth is dizzy"; at the same time, in terms of form, it continues to fluctuate and rise. After multiple rises, the probability of subsequent breakouts is relatively high;
3. 4 hours, the stochastic indicator is golden cross, the form is bottoming out and rebounding, and it is also an uninterrupted decline and piercing, and then a sharp rise; the high-level one-word interval of 4 hours is integrated It is a relay sideways signal; the follow-up means the continuation of the trend;
To sum up: technically, the daily K-line is sideways and resistant to falling, and the weekly K-line is sideways and resistant to falling. The subsequent multiple upward tests on the technical side will gradually form a break; fundamentally, the subsequent second stage has not yet arrived completely, and the attitude of the United States in the next two weeks will also determine the direction of the second stage of the war
I suggest that the idea is to maintain the trend of low-multiple ideas. In terms of position, refer to the support and choose the uninterrupted layout of the support position; wash-out response: do a good job of risk control, wash-out is also helpless; short-term: try to avoid it as much as possible. Without a fundamental change, don't over-lay out short-term. Trend: combining fundamentals and technical aspects, the subsequent breakout of 3500 and the probability of setting a new high are relatively high

Analysis and strategy of gold trend today 6.23
📣Risk aversion heats up over the weekend. Gold opened high and moved higher in the morning, but quickly fell back, presenting a "lure to buy" market, and the bulls seemed short-lived.
Under the current situation, the early rebound is under pressure at 3390-95. It is recommended to go short with the trend, keep a close eye on the moving average trend and key points, and grasp the trading rhythm.
Operation suggestions:
Short near 3390-3392, defend 3400, target 3350-3340
Buy near 3350-3348, defend 3340, target 3390-3400

Gold price 15 days, will the gold price rise or fall?
📣 Macroeconomic data and central bank policies
1. Iran launched a large-scale missile attack on Israel: This morning, Iran launched about 27 to 30 ballistic missiles at Israel, targeting Tel Aviv, Haifa and Ben-Gurion International Airport. Israel's "Hammer" air defense system intercepted multiple incoming missiles, but still caused about 20 to 86 injuries, and some residential houses and infrastructure were damaged. Subsequently, the Israeli Air Force launched a retaliatory strike on military targets in western Iran, destroying two Iranian F-5 fighters and multiple missile launchers and military bases. The large-scale military conflict between the two sides further exacerbated tensions in the Middle East.
2. Iran plans to block the Strait of Hormuz, a major oil route in the Middle East: After the United States bombed Iran's nuclear facilities, the Iranian parliament immediately approved the closure of the Strait of Hormuz, and is currently awaiting approval from the highest authority. The Strait of Hormuz is known as the mouthpiece of oil. About a quarter of the world's seaborne crude oil trade passes through this place, and the oil exported by the Gulf countries through the strait accounts for 20%-25% of the world's total oil output. Once the Strait of Hormuz is blocked, the global oil supply will be severely impacted, triggering violent fluctuations in the energy market. This will not only exacerbate inflation expectations, but also make the economic outlook more uncertain. In this case, gold, as an important tool to combat inflation and economic uncertainty, will significantly increase its attractiveness, which may trigger a large number of investors to buy, thereby driving up gold prices.
3. The Fed maintains interest rates unchanged, and internal differences increase: In the early morning of June 19, Beijing time, the Federal Reserve announced that it would maintain the target range of the federal funds rate at 4.25%-4.5%, which is the fourth consecutive month that it has maintained this interest rate level. In this statement, the unemployment rate was slightly adjusted. Although the uncertainty of the economic outlook has been reduced, it is still at a high level. The dot plot shows that the Federal Reserve maintains its forecast of two interest rate cuts this year, but has raised the median forecast for the interest rate in 2026. Judging from the attitude of officials, the number of people who support two rate cuts this year is basically the same as those who support maintaining the current interest rate, which indicates that the differences within the Fed on the direction of monetary policy are increasing.
🎈Technical factors
Support and resistance From the technical chart, gold currently forms a double bottom support at 3340 in the hourly cycle, showing that this position has a certain support strength. If the gold price can hold the 3340-3350 first-line support in the next 15 days, it is expected to rebound on this basis. The short-term resistance above is 3385-3390, which is the previous trading concentration area. If gold can break through this resistance level, the long volume will really start to exert force and look further to a higher position. If the gold price falls below 3340, the key support level, it may trigger further selling, and the bottom may test $2941.
Gold price trend forecast and operation suggestions for the next 15 days:
Based on the above factors, there are several possibilities for the gold price trend in the next 15 days:
Optimistic outlook (probability 40%)
If geopolitical conflicts further escalate or US economic data, such as consumer confidence, are not as expected, leading to further strengthening of the Fed's interest rate cut expectations, gold prices are expected to stabilize and rebound around $3340-3350, and retest the previous high of $3450-3470. In terms of operation, investors can buy on dips when the gold price falls back to the support level, set a reasonable stop loss, and look at the resistance level.
Neutral scenario (probability 50%)
The price remains in the range of $3350-3385, waiting for the Fed's policy signals and macroeconomic data to guide the direction. In this case, investors can adopt a high-sell-low-buy operation strategy, buy at the bottom of the range, and short at the top of the range, strictly control positions and stop losses, and avoid large losses due to emotional fluctuations.
Pessimistic scenario (10% probability)
If the US economic data is strong, indicating stable economic growth, or the geopolitical risks suddenly ease, and the market risk aversion sentiment cools down significantly, the gold price may fall below the key support level of $3,340 and seek support at $2,941. At this time, investors should stop losses in their long orders in time, and even consider shorting at highs, but pay attention to market changes and control risks.
Overall, the gold market is full of uncertainty in the next 15 years. When investing in gold, investors must pay close attention to changes in macroeconomic data, central bank policies and geopolitical situations, combine technical analysis, reasonably control positions, set stop losses, and make investment decisions with a profit-taking spirit.

XAUUSD – Is Gold About to Break Out of Balance? Market Overview As the U.S. dollar maintains its upward momentum fueled by expectations that the Federal Reserve will keep interest rates elevated for an extended period, gold (XAUUSD) is currently trading near the key Point of Control (POC) for June. The consolidation around the $3,350–$3,360 zone indicates a temporary balance of supply and demand, and the market appears to be gearing up for a strong directional breakout in the upcoming sessions.
Detailed Technical Analysis ✅ Volume Profile & Price Structure
POC (highest volume level): $3,360 – the central volume area for the week/month
Current price: $3,353 – just below the POC, reflecting selling pressure dominance
Price is reacting to the demand zone at $3,343–$3,345, with significant volume support below
Short-term reversal signals from ParLE and ParSE indicators suggest a potential market shift
🔍 Key Resistance Levels:
$3,360 – POC and immediate resistance zone
$3,398 – previous supply zone with strong rejection history
$3,451 – Fibonacci extension high and the strongest resistance for the month
🔍 Key Support Levels:
$3,345 – high-volume support cluster
$3,343 – Fibonacci and dynamic support zone
$3,276 – final support before mid-term structure breakdown
🎯 XAUUSD Trading Strategy for Today (June 23, 2025) 🔻 Primary Scenario: SHORT based on short-term bearish structure
Entry: $3,358–$3,360 (on POC retest + bearish rejection candle)
Stop Loss: $3,370
Take Profits:
TP1: $3,345
TP2: $3,343
TP3: $3,327
Probability: High, if price remains below POC
🔺 Alternative Scenario: LONG if price holds $3,343 support
Entry: $3,343–$3,345 (strong bullish candlestick setup in demand zone)
Stop Loss: $3,330
Take Profits:
TP1: $3,360 (POC)
TP2: $3,383
TP3: $3,398
⚠️ Risk Warning & Macro Factors to Watch
The USD Index is surging – applying downward pressure on gold
Fed's short-term rate projections (FedWatch Tool) reflect “no cut” expectations through Q3
Traders should maintain tight risk management within high-volume zones to avoid false breakouts
Follow @Henrybillion ” to stay updated with the most accurate and actionable XAUUSD trading ideas every day!

GOLD Intraday H1 Chart Update For 23 June 25 GOLD Intraday Chart show mid term Bearish move for now
For Today keep an eyes on 3368 level Breakout for Buy Scalping for long trade we may wait for dip around 3330-3340 zone SL remains possibly 100 pips
As long as market sustains below 3400 Psychological Level it will remains Bearish and will try to move towards 3200-30 Psychological

Gold (XAU/USD) 4H Analysis-23 June 2025Gold (spot XAU/USD) is currently trading around $3,358. On the 4-hour chart, price has been range-bound between $3,356 and $3,400. Recently, gold attempted to break higher (up to around $3,394) but quickly reversed — a sign that the breakout may have been a smart money trap. Technically, the structure saw a break below $3,380 in mid-June, leading to a push toward the $3,323 region. This reflects a short-term bearish wave followed by stabilization near the lows.
Bias: The market is currently neutral-to-bullish, depending on key supports. As long as price holds above the $3,322–$3,330 swing-lows, dips are considered buying opportunities. Notably, an order block/demand zone around $3,357–$3,360 appears to be holding well and attracting buyers. On the upside, $3,400 acts as a strong resistance level. A break above $3,400 would shift the bias firmly bullish, while a break below $3,338 would suggest bearish momentum returning.
🔑 Key 4H Support & Resistance Levels
Resistance:
• $3,400 – Major round number and recent high
• $3,434–$3,435 – Next resistance above $3,400
• $3,451–$3,452 – Recent swing top
• $3,500 – All-time-high level
Supply Zone:
• $3,388–$3,394 – Minor resistance and previous support turned supply
Demand Zone (Order Block):
• $3,357–$3,360 – Major 4H demand area showing strong buyer interest
Support:
• $3,338 – Critical support level below the order block
• $3,322–$3,323 – Multi-source key swing support
• $3,280–$3,300 – Lower targets if support fails
• $3,260 or below – Worst-case downside projection if breakdown accelerates
📈 1-Hour Intraday Trade Setups
Buy the Dip
• Entry: $3,357–$3,360
• Confirmation: Bullish reversal candle on 1H
• Stop Loss: Below $3,336
• Targets: $3,380 → $3,400
Sell a Rejected Rally
• Entry: Near $3,400 (only if clear rejection is seen)
• Confirmation: Bearish reversal candle or price stalling
• Stop Loss: Above $3,400
• Targets: $3,360 → $3,330
Breakdown Short
• Entry: If price breaks below $3,338 with strong 1H close
• Stop Loss: Above $3,345
• Targets: $3,323 → $3,300
Bullish Breakout Trade
• Entry: Break and retest above $3,400
• Confirmation: Clean 1H close above $3,400
• Stop Loss: Just below $3,400
• Targets: $3,434 → $3,452
✅ Final Takeaway
Gold is currently trading inside a $3,330–$3,400 range. The best intraday opportunity is to buy dips into the $3,357–$3,360 demand zone with a stop below $3,330, targeting $3,400+. If support breaks, flip to short toward $3,320–$3,300.
