Gold BuysH4 structure we are bullish, M15 we chOch and wait for pullback then continue with buys. With the iraq wars, investors are looking for a save haven and saving their cash in gold. We are bullish for the week
Goldprediction
Middle East war, gold breaks through 3400 early next week
Hello everyone:
Let's analyze the gold price next week (June 23, 2025 to June 27, 2025)
📌Gold information:
Gold prices held steady on Friday, hovering around $3,369, and are expected to fall nearly 1.90% this week as the market digests U.S. President Donald Trump's decision to abandon immediate military action against Iran and turn to diplomacy. As of writing, XAU/USD fell 0.11%.
While easing geopolitical tensions helped boost risk sentiment, concerns that the United States may restrict allies operating semiconductor factories in China put additional pressure on gold, according to Bloomberg. Trump's restraint on Iran encouraged risk appetite and suppressed the appeal of this safe-haven metal.
What has President Trump been busy with in the past 24 hours? (2025-06-22)
1. Announced the successful airstrike on Iran's three nuclear facilities - Trump issued a message saying that he had successfully launched attacks on Iran's three nuclear facilities, including Fordow, Natanz and Isfahan. The main target Fordow nuclear facility was bombed with a full load of bombs. All fighter jets are returning safely. Iran's Fordow (nuclear facility) no longer exists.
2. Was willing to go to Turkey to negotiate with Iran in person - According to the AXIOS website, sources said that when Trump attended the G7 summit last Monday, Erdogan called and proposed to hold talks between US and Iranian officials in Istanbul the next day to explore diplomatic solutions to the war. Trump agreed, and he was willing to send Vice President Vance and White House envoy Vitkov, and even if necessary, he was willing to go in person. But it was later cancelled because Khamenei could not be contacted.
3. Threatening to strike Iran again if the conflict does not stop - According to Reuters, US President Trump said in a telephone interview that tonight was a stunning success and Iran should immediately achieve peace and stop the war, otherwise they will be hit again.
4. Saying that Iran will either usher in peace or fall into tragedy - Trump said that the US goal is to destroy Iran's nuclear enrichment capabilities and stop Iran's nuclear threat. Iran's facilities have been completely destroyed. Iran will either usher in peace or fall into tragedy. Many goals have not yet been achieved. Tonight's strike is the "toughest target". If peace is not achieved in the future, other targets will be accurately struck.
5. Warning Iran not to retaliate - Trump posted on social media: "Any retaliatory action by Iran against the United States will lead to a military response 'far beyond what we saw tonight.'"
6. US Democratic lawmakers call for Trump's impeachment - On the evening of June 21, local time, according to NBC, New York Democratic Congresswoman Alexandria Ocasio-Cortez said that President Trump's decision to attack Iran without the authorization of Congress "absolutely and clearly constitutes grounds for impeachment." She said that the US President's disastrous decision to bomb Iran without authorization was a serious violation of the Constitution and Congress' war powers.
📣Personal analysis:
Tensions in the Middle East escalate, and gold prices will continue to rise above 3400 at the beginning of next week
🔥 Technical:
Based on the resistance and support levels of gold prices on the 4-hour chart, Labaron identified the important key areas as follows:
Resistance: $3395, $3448
Support: $3302, $3255
⭐️ Note: Labaron hopes that traders can properly manage their funds
- Choose the number of lots that matches your funds

Gold Trade Setup - 22/Jun/2025Hi Traders,
I expect this pair to go Up after finishing the correction.
1) We are in uptrend and potentially correcting for further upside.
2) The current move can be just a part of a intermediate correction or can even go to break the top.
How to Enter : Look for engulfing with in the SL zone.

With the United States joining the war, can gold return to 3,500
💡Message Strategy
The United States has already participated in the war. On Saturday, the United States announced that it had carried out a devastating strike on Iran's nuclear facilities. Iran's nuclear facilities no longer exist, and emphasized that Iran must accept peace unconditionally.
After the strike, Iranian officials said that the US military bases and personnel in the Middle East will become legal total targets, and the United States and Israel will be severely retaliated.
After striking Iranian targets again, it was stated that Iran must accept peace talks and cannot retaliate. Obviously, the United States does not want to fall into the quagmire of the Middle East war, and Iran is unlikely to stop.
As a result, a new Middle East war has been formed, and the United States will be involved in this war anyway.
Once the war escalates, the capital market will dislike the huge waves again. Gold will enter the second half of the bull market.
After hitting the high of 3,500 in April, it has not been able to break through so far, but it has continued to fluctuate around the highs and has not fallen. A new support platform has been consolidated.
Gold will inevitably open higher next week, but whether it can continue to rise after opening higher depends on whether Iran launches a strong counterattack. If the counterattack is not strong enough or the losses caused are limited, the short-term increase in gold will still be limited, and it is more likely to be a volatile upward trend.
📊Technical aspects
From the 4-hour analysis chart, the support below is around 3340-45, and the resistance above is around 3380-85, which is also near the 5-day moving average of the daily line and the middle track of the 4-hour Bollinger band. Breaking through here will ease the short-term downward pressure, and we can continue to pay attention to the high point of Thursday near 3390 US dollars;
For the support below gold, we can pay attention to the intraday low of 3340 US dollars, and then pay attention to the weekly MA10 moving average of 3315 US dollars. The 5-day moving average has a trend of forming a dead cross, the MACD indicator has begun to form a dead cross, and the KDJ and RSI indicators have a dead cross upward. The short-term technical aspect shows that the gold price has a further upward trend.
💰Strategy Package
Long Position:3355-3365,SL:3345,
Short-term goals: 3380-3390

GOLDGOLD seems to be going upwards due to unrest in the world. Pullback is your opportunity for further upside.
Disclosure: We are part of Trade Nation's Influencer program and receive a monthly fee for using their TradingView charts in our analysis.

21/06/2025 || GOLD prediction || Bullish MomentumThrough my weekly Episode multi time frame analysis , you will get deep insights .
Market in on rising channel since last year and did not respect the 2960 milestone after breaking it,Seconldy the weekly candle rejected at 3335-3338 and closes above its previous structural support at 3330-3335.
our eyes will be at 3430 first then 3520 milestone on this next weekly candle

GOLD 1H CHART ROUTE MAP UPDATE & TRADING PLAN FOR THE WEEKHey Everyone,
Please see our updated 1h chart levels and targets for the coming week.
We are seeing price play between two weighted levels with a gap above at 3376 and a gap below at 3348. We will need to see ema5 cross and lock on either weighted level to determine the next range.
We will see levels tested side by side until one of the weighted levels break and lock to confirm direction for the next range.
We will keep the above in mind when taking buys from dips. Our updated levels and weighted levels will allow us to track the movement down and then catch bounces up.
We will continue to buy dips using our support levels taking 20 to 40 pips. As stated before each of our level structures give 20 to 40 pip bounces, which is enough for a nice entry and exit. If you back test the levels we shared every week for the past 24 months, you can see how effectively they were used to trade with or against short/mid term swings and trends.
The swing range give bigger bounces then our weighted levels that's the difference between weighted levels and swing ranges.
BULLISH TARGET
3376
EMA5 CROSS AND LOCK ABOVE 3376 WILL OPEN THE FOLLOWING BULLISH TARGETS
3395
EMA5 CROSS AND LOCK ABOVE 3395 WILL OPEN THE FOLLOWING BULLISH TARGET
3419
EMA5 CROSS AND LOCK ABOVE 3419 WILL OPEN THE FOLLOWING BULLISH TARGET
3440
BEARISH TARGETS
3348
EMA5 CROSS AND LOCK BELOW 3348 WILL OPEN THE SWING RANGE
3330
3306
EMA5 CROSS AND LOCK BELOW 3306 WILL OPEN THE SECONDARY SWING RANGE
3288
3271
As always, we will keep you all updated with regular updates throughout the week and how we manage the active ideas and setups. Thank you all for your likes, comments and follows, we really appreciate it!
Mr Gold
GoldViewFX

GOLD 4H CHART ROUTE MAP UPDATE & TRADING PLAN FOR THE WEEKHey Everyone,
Please see our updated 4h chart levels and targets for the coming week.
We are seeing price play between two weighted levels with a gap above at 3375 and a gap below at 3306. We will need to see ema5 cross and lock on either weighted level to determine the next range.
We will see levels tested side by side until one of the weighted levels break and lock to confirm direction for the next range.
We will keep the above in mind when taking buys from dips. Our updated levels and weighted levels will allow us to track the movement down and then catch bounces up.
We will continue to buy dips using our support levels taking 20 to 40 pips. As stated before each of our level structures give 20 to 40 pip bounces, which is enough for a nice entry and exit. If you back test the levels we shared every week for the past 24 months, you can see how effectively they were used to trade with or against short/mid term swings and trends.
The swing range give bigger bounces then our weighted levels that's the difference between weighted levels and swing ranges.
BULLISH TARGET
3375
EMA5 CROSS AND LOCK ABOVE 3375 WILL OPEN THE FOLLOWING BULLISH TARGETS
3439
EMA5 CROSS AND LOCK ABOVE 3439 WILL OPEN THE FOLLOWING BULLISH TARGET
3499
EMA5 CROSS AND LOCK ABOVE 3499 WILL OPEN THE FOLLOWING BULLISH TARGET
3561
BEARISH TARGETS
3306
EMA5 CROSS AND LOCK BELOW 3306 WILL OPEN THE SWING RANGE
3236
3171
EMA5 CROSS AND LOCK BELOW 3171 WILL OPEN THE SECONDARY SWING RANGE
3089
2995
As always, we will keep you all updated with regular updates throughout the week and how we manage the active ideas and setups. Thank you all for your likes, comments and follows, we really appreciate it!
Mr Gold
GoldViewFX

GOLD DAILY CHART ROUTE MAPHey Everyone,
Quick update on our Daily chart Goldturn channel setup.
Since our last post, price action has continued to play out within the structure as anticipated but with a new development: we’ve now had the challenge and rejection at the channel top. Price challenged the 3433 axis again but failed to lock above, confirming the resistance remains firm at this level.
To confirm a continuation higher into 3564, we’ll now need to see either a blue candle body close or the EMA5 cross and lock cleanly outside the channel. Without that confirmation, we treat any move to the top as a potential fade opportunity, not a breakout.
On the downside, daily support at 3272 remains intact and continues to anchor our range structure. As long as price holds above this level, we maintain our strategy of buying dips, especially when supported by our weighted Goldturn zones on lower timeframes (1H, 4H).
This rejection further validates the precision of our Goldturn channel. The structure continues to guide us effectively filtering the noise and keeping us on the right side of the setup.
Stay disciplined. The range is still in play until we get a clear break and hold above the top.
Watch 3272 and 3433 closely. The next move will hinge on whether bulls can finally break the ceiling or if sellers continue to defend this range top.
Let the market show its hand.
Mr Gold
GoldViewFX

GOLD WEEKLY CHART MID/LONG TERM ROUTE MAPHey Everyone,
Following up on our previous weekly update = last week we saw the expected correction play out with a move down for the EMA5 detachment touch, highlighted by the circle on the chart. This was a healthy pullback within the structure and aligns perfectly with the Goldturn methodology.
While we previously had the candle body close gap at 3482, that target still remains open and active. The move lower was not a breakdown but a technical retest, setting up the potential for continuation higher once momentum returns.
Support continues to hold at 3281, reinforcing our buy the dip strategy within the structure. The price remains guided by the channel and is still following the expected trajectory toward the long term gap target.
We'll be watching closely for renewed strength to drive back toward 3482, and any close above recent highs could reignite that move. Until then, structure remains bullish and contained.
Stay disciplined and let price do the talking.
Mr Gold
GoldViewFX

USDJPY ANalysis week 26Fundamental analysis
The Fed kept interest rates unchanged and forecast only a small cut in 2026-2027 due to concerns about high inflation. The number of officials opposing a rate cut this year increased. The Israel-Iran conflict escalated, the US may attack Iran but is waiting for Tehran's response, causing the Japanese Yen to appreciate thanks to its safe-haven role.
Japan and the US have not reached a trade deal, the risk of higher tariffs before the July 9 deadline. The US dollar is near a one-week high, supporting the USD/JPY pair, but investors remain cautious due to the lack of new economic data.
Technical analysis
USDJPY is rising quite strongly and reacting at the resistance zone of 146.200. There is a possibility of a price gap next week, so trading early will be quite risky. The trading range is expected to be clearer at the resistance and support zones. 146,800 and 147,700 are noted as the two important upper boundary zones. 145,400 and 144,400 will be important support zones with a very strong buyer force waiting.
Trading Signals

GOLD H4 Chart Weekly Update For 23 - 27 June 25Hello Traders,
welcome to the weekly update, as you can see that market was in range last week
as for now 3400 Psychological remains in focus if market breaks 3400 successfully the GOLD will rise towards 3440
only breaks below 3330 GOLD will leads towards 3250 possibly
FED Chair Powell Testifies due in the upcoming week
USPCE PRICE INDEX due on Friday
Disclaimer: Forex is Risky

The rebound is weak, is it expected to continue to decline? 📰 Impact of news:
1. Geopolitical situation
2. Pay attention to the impact of short-term trends of the US dollar and silver on gold
📈 Market analysis:
The weekly level large range sweep is still going on, with a focus on the space defense dividing line area of the 10-day moving average and the 3315-3310 area. After falling back to the lifeline in four hours, it continued to bend downward under pressure. During the sweeping decline, the suppression became more obvious. Whether there will be a wave of large-volume market, the pattern is expected to further open and guide the direction. In this process, note that the lifeline 3375 is also the resistance point determined by the last rebound last night. Use this as suppression to sweep the range below. On the whole, for the future gold, if it can maintain the rhythm of defending highs and breaking lows, and successfully closes at a low level today, then next week it is expected to further switch downwards to sweep space. Therefore, we will continue to focus on two support areas, one is 3345-3335, and the other is 3315-3310 after breaking
🏅 Trading strategies:
BUY 3345-3335
TP 3355-3365
SELL 3365-3375
TP 3345-3335-3315
If you agree with this view, or have a better idea, please leave a message in the comment area. I look forward to hearing different voices.
TVC:GOLD FXOPEN:XAUUSD FOREXCOM:XAUUSD FX:XAUUSD OANDA:XAUUSD

When will the price of gold fall?Market news:
In the early Asian session on Friday (June 20), spot gold fell narrowly and is currently trading around $3,360 per ounce. London gold prices fluctuated violently under the dual influence of the Fed's hawkish stance and geopolitical tensions. Powell's hawkish stance cooled the market's expectations for interest rate cuts. As a non-yielding asset, international gold is under obvious pressure under high interest rate expectations. In sharp contrast to the Fed's hawkish stance, geopolitical tensions have provided important safe-haven support for international gold prices. The escalation of the Israeli-Iranian conflict has not only exacerbated tensions in the Middle East, but also triggered market concerns about the global security environment. As a traditional safe-haven asset, gold is often sought after when geopolitical risks rise. In the short term, the continued escalation of the conflict between Israel and Iran may continue to drive safe-haven funds into the gold market, but the direction of the Fed's monetary policy and the specific implementation of the Trump administration's tariff policy will have a key impact on the medium- and long-term trend of gold prices.
Technical Review :
Gold maintained a volatile closing. The daily chart closed with alternating buying and selling for four consecutive trading days. There was no trend continuation. We will continue to pay attention to the 3350/3390 range during the day. Today's trading ideas are still short-term, selling at high prices and buying at low prices to participate in the volatile trend.So far this week, gold has been difficult to break out of the continuity of buying and selling. Yesterday, Thursday, under the temporary performance of gold's short-term dollar trend, we are optimistic that gold will fluctuate in the range, with the maximum range at 3350/3400, but there may often be a breakout on Thursday. Therefore, today we should pay attention to both trading within the range and the strength after the breakout.
Today's analysis:
Gold fluctuated overall yesterday due to the early closure of the US market, and the fluctuation was not large. However, gold as a whole is still biased towards selling. Gold is now weak in buying and rebounding, so there is a lot of room for gold selling. Next, we will continue to sell gold. If there is no particularly large profit to support gold, then gold buying may not cause any big waves in the short term. Gold 1-hour moving average continues to cross and sell downward. Gold selling is strong and there is still room for downward movement. After gold fell yesterday, the highest rebound was around 3378, and then it continued to fall back. After rebounding several times, it did not break through 3378 again. Gold continued to sell at high prices under pressure at 3378. Gold is now fluctuating and falling, and the center of gravity is constantly moving downward. With this trend, gold may accelerate downward at any time.
Operation ideas:
Short-term gold 3335-3338 buy, stop loss 3328, target 3370-3380;
Short-term gold 3360-3370 short, stop loss 3387, target 3330-3340;
Key points:
First support level: 3352, second support level: 3344, third support level: 3331
First resistance level: 3378, second resistance level: 3388, third resistance level: 3400

GOLD DAILY CHART UPDATEHey Everyone,
Great finish to the week across all our multi timeframe analysis.
We updated our 1H chart throughout the week catching the buys from the dips using our levels and ema5 cross and lock allowed us to track the movement with confirmation.
This is now an end of week update on our daily chart idea. This chart shows our perfect play into the channel top and then rejection for the movement down. We used our smaller timeframe charts to catch the bounces from this movement down.
Following up on our previous analysis, price action has continued to respect our Goldturn channel beautifully. The key takeaway here is that the channel levels are being respected with precision, validating the strength and reliability of our Goldturn channel framework.
We’ll be back now on Sunday with our multi-timeframe analysis and trading plans for the week ahead. Thanks again for all your likes, comments, and follows.
Wishing you all a fantastic weekend!!
Mr Gold
GoldViewFX

Perhaps 3300 or even 3280 is foreseeable!Obviously, gold is currently fluctuating downward, and in the short term, there is a certain support in the 3340-3330 area, so gold will not fall below this support area in one fell swoop, and it is still possible to rebound to the 3360-3370 area with the support of this area. If gold encounters resistance and retreats again after touching the 3360-3370 area, if there is no major good news, gold is likely to fall below the 3340-3330 area. After gold falls below this support area, the 3300 and 3280 areas are foreseeable.
So according to the above logic, I still hold a long position executed near 3345, and I am very much looking forward to gold reaching the 3360-3365 area;
If gold continues to rebound to the 3365-3375 area, I will try to short gold again; and look forward to the accelerated downward movement of gold!
The above is a preview of the performance of gold. There may be some deviations in the specific execution of transactions, because in short-term transactions, it is necessary to judge the true breakthrough and false breakthrough in advance, but I will still roughly follow the above preview process to execute the transaction! I also hope that this can provide some reference for everyone!

Gold Trading Strategy June 20Daily candle continues to show a struggle while the Sellers are dominating. Today there may be a deep sweep and then a recovery at the end of the day.
Yesterday's 3343 zone is reacting 5 prices in the direction of profit. Next support around 3323 pay attention to the next sweep. Pay attention to additional daily support at 3296 for today's buy strategy.
3362 gives a SELL Break out signal in the Asia-Europe session. If Gold closes back above 3362, then BUY to 3400 target the two upper resistance zones remain the same as yesterday at 3415 and 3443
Resistance: 3400-3415-3443
Support: 3323-3296
Break out: 3362

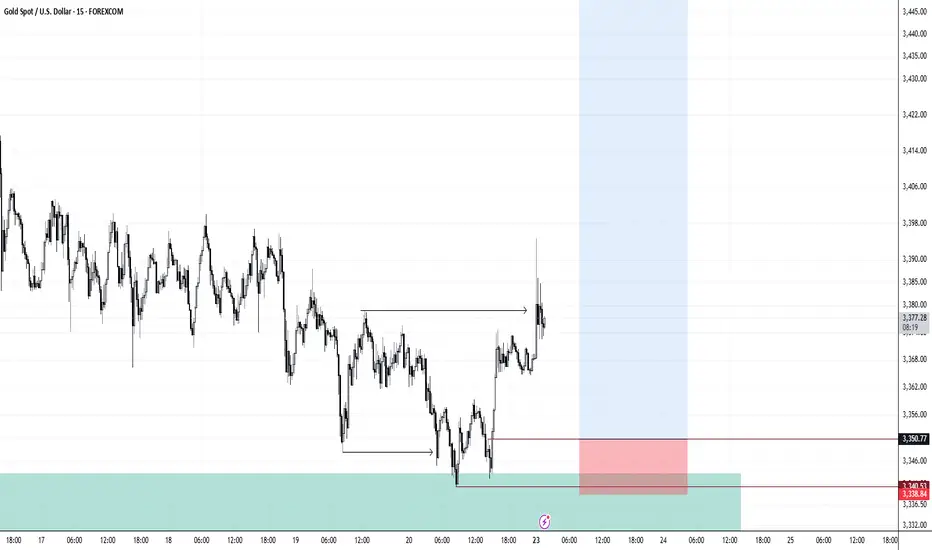
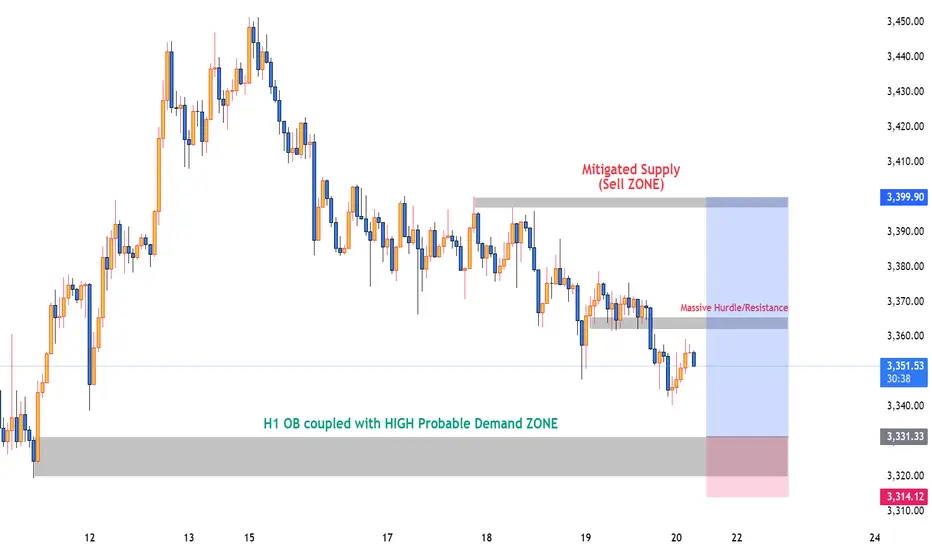
Gold XAUUSD Possible Move🚨 Trade Setup Alert
📍 H1 Orderblock Zone at 3330–3320
🔑 High-probability BUY setup after liquidity sweep 🟢
🎯 Target: 3362 and possibly 3396+
🛑 SL below 3315
📍 Mitigated Supply Zone at 3396–3400
🔻 Possible SELL setup if price rejects that level 🔴
🎯 Target: 3365 / 3340
🛑 SL above 3412
⚠️ Key Level: 3362–3365 must break to reach upper supply zone.
✅ A level viz. 3340 shared yesterday, I bought from 3340 and bagged +180 pips 💸
👀 Watch price action closely near these zones for confirmation.
📊 Trade with proper risk management! 💼
Gold Eyes Breakout from Ascending Channel Toward $3,500📈 Chart Analysis
1. Rising Channel Structure
Gold (XAU/USD) has been trading within an upward-sloping channel, marked by the blue trendlines connecting interior lows and highs, culminating at point C (~$3,497). The latest bounce off the lower channel near “B” reinforces bullish bias – if this trendline holds, another leg higher toward resistance around $3,497–$3,500 is likely.
2. Support & Resistance Confluence
The purple trendline and the dotted horizontal green level (~$3,498) converge near the projected breakout point. This synergy provides a strong pivot zone — a successful breakout would validate targets near channel highs.
3. Harmonic Pattern in Play
The chart displays a bullish harmonic structure (likely a Bat or Gartley formation), with retracement ratios (0.719, 1.627) anchoring reversal areas. These reinforce the bounce at B and the potential move toward point C.
4. Trade Scenarios
Bullish Scenario (primary): A bounce off the trendline triggers a rally to the channel top and resistance zone ($3,497–$3,500).
Bearish Caution: A drop below the trendline invalidates the pattern, potentially bringing prices back to horizontal support around $3,296 or even $3,120, as indicated at point A.
🛠️ Technical & Market Context
Technicals: Daily trend remains bullish as long as price holds above ~$3,340–$3,350, with resistance forming in the $3,380–$3,400 range
Fundamentals: Geopolitical tension (e.g., Middle East conflict) and safe-haven inflows continue to underpin gold — though Citi expects prices to eventually correct toward $3,300–$3,500 mid‑term
.
Sentiment: Some analysts advocate “selling the rallies,” especially into the $3,450–$3,500 zone . But central banks’ ongoing buying and potential Fed rate cuts support a stronger floor
.
✅ Trade Strategy
Scenario Entry Zone Target Stop Loss Placement
Play the Bounce ~$3,350–$3,360 $3,497–$3,500 Below trendline near B zone (~$3,320)
Breakout Trade On momentum above $3,400 $3,497–$3,550 Below breakout (sub-$3,380)
Bearish Trigger Break & close below trendline Back to $3,296 / 3,120 Just above trendline ($3,360)
🔍 Summary
Gold remains in a structurally bullish setup inside an ascending channel. The confluence of harmonic reversal, strong trendline support, and pending fundamental catalysts presents a high-probability opportunity to push toward the $3,500 area—provided the trendline and $3,340–$3,350 support hold. A drop below would invalidate the bullish outlook and favor deeper retracement.

Gold (XAU/USD) 4-Hour Analysis- 20 June 2025On the 4-hour chart, gold has been trading in a fairly wide range.
The market has not clearly broken down, and many analysts see it as still structurally bullish as long as key support holds. Currently price is pulling back toward a confluence of support around $3,353–$3,355 (a zone overlapping a trendline and prior demand).
In other words, buyers have defended roughly the 3,340–3,355 area recently. Resistance lies just above in the $3,370–$3,380 region, with a major psychological pivot at $3,400. One analyst notes gold is “boxed between resistance at $3,450 and support at $3,340–$3,335”, so the immediate bias depends on these zones.
A clean break above 3,380–3,400 would signal bullish continuation (targeting 3,450+), while a drop below the 3,340–3,350 support zone would shift the bias bearish.
Overall, the market structure on H4 is mixed-to-bullish: we see higher swings in larger timeframes, and only a minor short-term down leg so far. As one analysis notes, gold remains “structurally bullish” and an upside break could chase the $3,500–$3,550 area.
Key Zones and Levels (4H)
Strong Support (Demand) Zone: ~$3,340–$3,355. This zone (around the recent swing lows) has attracted buying. Analysts mark $3,350–$3,355 as a key buy zone. Breaking below ~$3,340 would be a warning, putting 3,300 as the next floor.
Supply Zone / Resistance: ~$3,370–$3,380. This is the near-term resistance cluster (multiple analysts cite 3,370–3,380 as key). A rejection here would keep gold rangebound.
Major Pivot: $3,400. This round number is acting as an important hurdle. A decisive close above $3,400 would open the door to the $3,434–$3,450 area (prior highs). Conversely, failure at $3,400 can push price back toward the support zone.
Larger Resistances: If the uptrend resumes, look to ~$3,450 (April swing high) and beyond. Many long-range targets point to $3,500+ in a strong bull move.
Secondary Supports: Below the main support zone, watch ~$3,300 and down at $3,281 (the 50-day moving average). These act as deeper floors if weakness continues.
4-Hour Bias
In plain terms, as long as $3,340–$3,355 holds as support, the bias tilts bullish or neutral. We can say bullish bias above that zone: buyers will look to enter on pullbacks there. If price stays under $3,370, gains will likely be capped short-term. A break above $3,380/$3,400 would confirm a bullish breakout. On the flip side, a break below $3,340 shifts us to a bearish bias, with attention turning to lower support levels. On indicators, shorter-term momentum has eased (recent RSI is flattening around 60), suggesting some fatigue. But the longer-term trend is up, supported by strong safe-haven demand (central bank buying, geopolitical risk).
In summary: neutral-to-bullish on 4H, favor buyers near support but cautious near overhead supply.
Intraday (1H) Setups
Zooming into the 1-hour chart, we look for trades that align with the above bias. The clearest setups involve buying around demand zones and selling near supply areas:
Buy the Dip (~$3,344–$3,355): Wait for gold to dip into the 3,340–3,350 area. If you see a bullish price-action signal (e.g. a clear hammer or bullish engulfing candle), that’s a potential buy. Place a stop just below (~$3,335). Initial targets are around $3,370–$3,380 (near resistance). For example, one analysis suggests: “Buy XAU/USD at 3,344–3,348, TP 3,365–3,370, SL 3,335”.
Sell the Rally (~$3,375–$3,380): If price runs up to $3,375–$3,380 and shows signs of stalling (e.g. bearish candle), consider a short. Stop would be just above (~$3,385), with a target back down toward $3,355–$3,360 or the 1H demand zone. (One example from analysis: “Sell XAU/USD at 3,375–3,380, TP 3,355–3,360, SL 3,385”.) This aligns with fading the high of the range.
Breakout Strategy: If momentum is strong and gold breaks convincingly above ~$3,380–$3,400 on the 1H, one can enter long on the breakout. The next resistances are ~$3,434 and $3,450.
Stops should be very tight in that case (just under the breakout candle).
Risk Management: Keep position sizes small (1–2% risk). Use stops under/above the structural levels. Always wait for a clear 1H candle signal before pulling the trigger, to avoid false moves.
Key 1H levels: We can cite the strong short-term zones: support ~$3,344–$3,348 and resistance ~$3,375–$3,380.
If price skims these areas, watch carefully for a signal to buy or sell as described above. If 1H breaks below $3,340, be ready for a move toward the lower demand zone (around $3,335) or even $3,300–$3,280.
Takeaway
Gold is currently trading between ~$3,340 and $3,380 on the 4H chart. The simplest guidance is to trade the range: buy on dips near $3,340–$3,355 with stops just below, aiming for the $3,370–$3,380 area, and sell near $3,375–$3,380 if rallies stall. Maintain a bullish tilt as long as that $3,340+ support holds, but be ready to switch bearish if gold decisively closes under ~$3,340.
Single Takeaway: Treat ~$3,340–$3,355 as a key demand zone – a bounce here would be a high-probability long entry (targeting $3,370–$3,380), whereas a break below would turn the bias lower.

Gold Spot / U.S. Dollar (XAU/USD) 4-Hour Chart4-hour chart displays the price movement of Gold Spot against the U.S. Dollar (XAU/USD) from early June to mid-June 2025. The price, currently at $3,350.76, has experienced a recent decline of $19.76 (-0.59%) as of 01:06:10. The chart highlights a downward trend with a shaded area indicating a potential support or resistance zone between $3,310.41 and $3,374.21. Key price levels are marked, showing fluctuations between $3,300.00 and $3,374.21 over the observed period.

GOLD (XAUUSD) – Wave b Complete? Preparing for Wave c RallyGold tapped into the key demand zone and swept sell-side liquidity (SSL) beneath wave (iii) lows.
A five-wave decline appears complete, with wave (v) of b terminating just below the o.618 fib extension at 3344.86.
🟢 Wave c projection now in focus — looking for a 5-wave impulsive rally to develop.
Targeting the Sell Zone between the 0.5–0.764 retracement (3395.87–3425.07).
🧠 Structure Notes:
✅ Imbalance Zone (IMB) formed during the breakdown has now been tapped
🔻 SSL swept + bullish reaction = potential change of state
🟢 Wave (i) and (ii) projection underway – price needs to maintain structure above 3357.43 for bullish continuation
Targets: 3408.81 (0.618 Fib)
Invalidation below: 3340.31
Momentum and RSI divergence support reversal

The bear market is over? Short at high and long at low📰 Impact of news:
1. The interest rate remains unchanged and leads to new lows in the short term
2. Geopolitical tensions provide support for risk aversion
📈 Market analysis:
Due to the early closing yesterday, the volatility of the US market was limited and the market seemed relatively flat. From a technical perspective and the current trend, 3340 is a key defensive support level. If it retreats to this level, you can consider going long. If the gold price continues to rise and reaches 3375, from the perspective of trading strategy, you can choose to place a short order here. Focus on the resistance line of 3370-3375 during the day, and pay attention to the support of 3345-3335 below.
🏅 Trading strategies:
SELL 3370-3375
TP 3360-3355-3345
BUY 3345-3335
TP 3360-3370
If you agree with this view, or have a better idea, please leave a message in the comment area. I look forward to hearing different voices.
OANDA:XAUUSD FX:XAUUSD FOREXCOM:XAUUSD FXOPEN:XAUUSD TVC:GOLD
