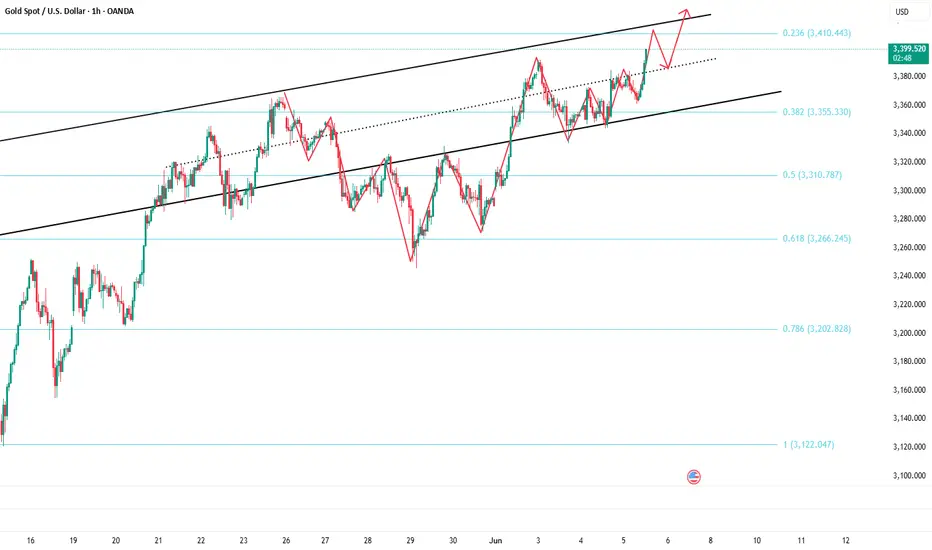
Gold Overview Strategy June 6The 3-candle D1 cluster did not close above 50% of the main bullish candle on Friday last week. Today's main view will be to BUY to 3413.
Today's resistance is around 3413 for the SELL strategy of the US Session. The Asian-European session is looking for a BUY point. There was just a nice BUY wave around 3363 where the price swept liquidity to 3359.
3382 is the target for the BUY order and this area can SELL Scalp in today's Asian-European session for a recovery wave because today's target is up to 3413 according to the bullish structure.
In the direction of Gold Down, contrary to our analysis, the support zone 3341 and support 3324 will support the upward force of gold prices.
The breakout boundary zone 3382 and 3341. Pay attention to breaking out from important resistances, then do not trade against the trend.
Resistance: 3373-3382-3399-3413
Support: 3357-3341- 3325
Goldprediction

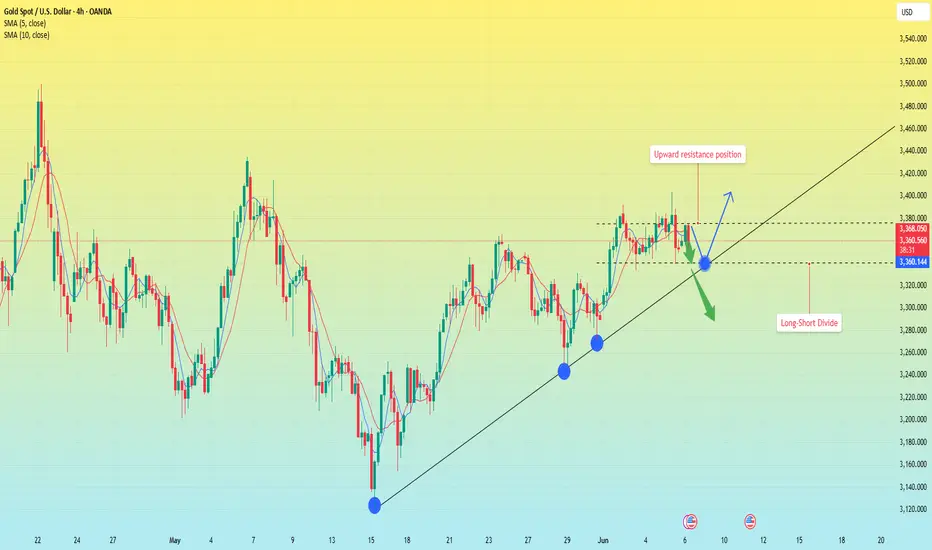
Long and short battle break out before NFP,gold operation layout📰 Impact of news:
1. NFP data released
2. Geopolitical situation worsens
3. Trump and Musk start a war of words
📈 Market analysis:
During today's U.S. trading session, we need to pay close attention to the impact of NFP on the market. Bros who trade independently must do a good job of risk control. The gold 1H chart shows that the current gold price is suppressed by the downward opening of the Bollinger Bands. Gold shorts dominate in the short term, and the MACD indicator has a tendency to form a death cross. At the same time, the 5-day moving average and the 10-day moving average form a death cross and move downward, indicating that the gold price is still facing adjustment pressure in the short term. Looking at the 4H chart, we can find that although gold is currently rising on the 4H trend line, gold has not yet fallen back to the right level. Therefore, we cannot rule out the possibility that gold will continue to fall back in the future. The key resistance level above is 3390-3400, and the support level below is 3350-3340, with a focus on the important support level of 3330. Participate in high-altitude and low-multiple in the European session today, and consider retreating to 3350-3340 to place longs
🏅 Trading strategies:
BUY 3350-3340
TP 3365-3385-3395
If you agree with this view, or have a better idea, please leave a message in the comment area. I look forward to hearing different voices.
TVC:GOLD FXOPEN:XAUUSD FOREXCOM:XAUUSD FX:XAUUSD OANDA:XAUUSD

Before the non-agricultural data, gold is waiting for the trendToday, the market will focus on the US non-agricultural employment data. The market expects that 130,000 new jobs will be added and the unemployment rate will remain unchanged at 4.2%. If the non-agricultural data is far worse than expected, it may continue to hit the US dollar and stimulate a sharp rise in gold prices. On the contrary, if it is higher than expected, it may also cause the US dollar to rebound, and gold will continue to maintain the possibility of low consolidation.
Yesterday, the US stock market collapsed across the board due to the debate between Trump and Musk. Therefore, I am worried that Trump will continue to make remarks to boost the US stock market today. Once the US stock market rebounds again, gold may continue to fall, or remain at a low level for consolidation.
From the 4-hour chart, it can be seen that gold has been rising along the 4-hour trend line. However, from the current chart, gold has not yet stepped back. Therefore, it is not ruled out that gold will continue to step back to 3330-3340 and then choose a direction again. 3330-3340 is a critical position. Once it falls below 3330 again, it is very likely to directly touch 3300. On the contrary, if it stabilizes at 3330-3340 again, then gold will definitely stabilize above 3400 if it goes up again.
Secondly, from the perspective of the US dollar:
The bottom divergence structure appears here in the 4-hour chart. Therefore, once the divergence of the US dollar takes shape, it will also cause gold to return to a low level again.
Therefore, be careful when going long on gold today. The position where you can go long today is in the range of 3330-3340. Secondly, if gold falls below 3330 today, it will test around 3300, so another long position for gold is around 3300. On the contrary, if it falls below 3300, there will be no chance to go long on gold, and the subsequent decline may accelerate.
Gold----Sell near 3384, target 3362-3339Gold market analysis:
Yesterday's gold surged and then fell. The daily line finally closed negative, but it did not close before the previous low point, nor did it break the key support. The daily line formed a combination of one negative and one positive. The recent market is like this, ever-changing, without a fixed trend. A rebound can easily rise by 30 points. The Asian session rebounded from 3339 to 3372, easily breaking the 3363 pattern of great pressure. The daily line pattern looks like a shock and breaks 3339, which is bearish. Today's short-term thinking is to rebound first and then bearish. Yesterday's decline was too much, and a technical rebound is needed. The rebound is our opportunity to sell. In addition, the big drama is the NFP data in the evening. Before this data, the gold market will not have too much unilateral action, and the possibility of repair is greater. In addition, today is the time to close the weekly line. If nothing unexpected happens, this week will still close with a positive line, so gold will continue to be bought for a long time next week, and it will continue to rise.
The first suppression position we focus on in the Asian session is 3372, and the stronger one is around 3388-3384. These two positions are important positions in the Asian session. Gains and losses are critical. In addition, the daily line has not turned short. There is still a possibility of buying and rising again. If the buy stands above 3384, it may stabilize and rise again. If it stands above, we must adjust our thinking and buy to see new highs.
Support 3339, 3352, suppression 3372, 3388, and the strength and weakness line of the market is 3352.
Fundamental analysis:
The terrible ADP data made the market not optimistic about non-agricultural data. We estimate that today's non-agricultural data will still be relatively miserable. The market's expectations support gold and suppress the US dollar.
Operation suggestions:
Gold----Sell near 3384, target 3362-3339

Non-agricultural data is coming. Disrupt the market?Market analysis:
The market once again staged a long-short trend yesterday. Due to the intensification of geopolitical risks, gold has been advancing all the way. Because of the easing of Sino-US trade relations, prices have fallen sharply. From the current market point of view, non-agricultural data is the key today. After a sharp drop in the early morning, it fluctuated sideways and maintained a small rebound.
According to the ADP data on Wednesday, there is a high probability that the data will be bullish today. The support in the early trading will focus on around 3345. Under the condition that the upward trend remains unchanged, the current market prompts a risk of retracement, but it will not prompt shorts to enter the market; before the non-agricultural data, it is still a low-multiple idea.
Non-agricultural data analysis:
Non-agricultural, recently affected by tariff conflicts, employment is very bad, especially Wednesday's ADP data, which is far below expectations, and this month's non-agricultural is expected to be 130,000. Although the expectation is lower than 177,000 last month, this number is still relatively high compared to ADP.
If the data released is higher than 177,000, it will be bearish for gold, but in terms of tariffs and ADP, this possibility is extremely small. The data is higher than 130,000 and lower than 177,000, which is also likely to be bearish for gold.
If it is lower than 130,000, gold may take this opportunity to rise sharply.
I think according to Wednesday's ADP, today's non-agricultural data is likely to be lower than 130,000, and the market will rise.
Positions to pay attention to today:
First support level: 3345, second support level: 3330, third support level: 3300
First resistance level: 3375, second resistance level: 3390, third resistance level: 3410
Operation strategy:
Aggressive trading-currently long at 3370, after the release of non-agricultural data, the gold price is likely to rise above 3400 points, which is also our profit range.
Steady trading-long at around 3350, the profit range is still at 3400 points after the release of non-agricultural data.

GOLD Intraday M30 Chart For 6 June 25As you can see that Market still is in strong range and we are still waiting for clear breakout
NFP main event of the day and remains watchable
If Market break 3335 successfully today then it will move towards 3310
above 3345-50 market remain slightly Bullish
Disclaimer: Forex is Risky

Gold Price Analysis June 63 D1 candles closed without breaking through 50% of the previous bullish main candle. Today's main view will be BUY up to 34xx
Today's resistance is around 3413 for the SELL strategy of the US Session. The Asian and European Session is looking for a BUY point. There was just a nice BUY beat around 3363 where the price swept liquidity to 3369.
3382 is the target for the BUY order and this area can SELL Scalp in today's Asian and European session because today's target is up to 3413.
In the direction of Gold Down, contrary to the analysis, the support zone 3341 and support 3324 will support the upward force of gold prices.
Breakout boundary zone 3382 and 3341. Note that the break out does not block the train

Non-farm data is expected to help gold recover from its decline! Gold prices rose sharply in the Asian and European sessions yesterday, and fell in the US session. The roller coaster-like trend at the end of the day gave up all the gains during the day, falling below the 3350 mark and touching the 3339 line. The daily pattern showed a trend of first rising sharply and then falling sharply. The technical daily chart has been alternating between positive and negative for four consecutive trading days. The New York market fell sharply and tested the 7-day moving average, but the price is still running above the 10-day moving average/7-day moving average.
The Bollinger Bands on the short-term four-hour chart closed, the RSI indicator's middle axis flattened, and the hourly chart's four-hour moving average was glued. From a technical perspective, gold intraday trading is arranged with a volatile mindset, and the intraday range is arranged with reference to 3328/3388. Today's fundamentals focus on the non-agricultural employment data released by the New York market. The previous value was 177,000, and the market estimate was only 130,000. According to the estimate, it is bullish for gold/silver.
This year has always emphasized that 2025 is a strong year for gold, and gold may enter an acceleration period of long-term structure this year. Tariff trade policies, geopolitical tensions, the Federal Reserve's interest rate decision, the decline in confidence in U.S. debt, and the increase in global central bank purchases have all affected the trend of gold as a strong safe-haven tool, and gold will have room to rise. Therefore, as long as the overall environment remains unchanged, gold is still an absolute bullish trend. Therefore, no matter how it is adjusted, now is an opportunity to enter the long position.
Gold fluctuated in the 3332-3392 range in the first three days of this week. During this period, our high-altitude and low-multiple layout was completed as expected. Then, today gold will remain in this range and fluctuate upward. If it rises above 3400 and stabilizes, it will look to 3500 above; if it breaks through 3330, it will look to 3280 below. Pay attention to the fluctuations before the release of non-agricultural data. Non-agricultural data will cause an increase in liquidity, so try to avoid it.
Key points:
First support level: 3342, second support level: 3328, third support level: 3303
First resistance level: 3376, second resistance level: 3388, third resistance level: 3410
Operation ideas:
Buy: 3340-3343, stop loss: 3332, target price: 3360-3370;
Sell: 3387-3390, stop loss: 3400, target: 3370-3360;

Gold is getting ready for another uptrend!Market news:
In the early Asian session on Friday (June 6), spot gold fluctuated slightly higher and is currently trading near the 3360 mark. London gold prices rose and fell on Thursday. Earlier in the session, silver broke through the $35 mark, hitting a 13-year high, driving the international gold price to break through the 3400 mark, hitting a nearly four-week high of around $3403/ounce, but then due to the signal of easing trade tensions released by the leaders of China and the United States!At the same time, data showed that the number of initial jobless claims in the United States increased for the second consecutive week. Now all eyes turn to Friday's non-farm payrolls report. Trump again called on Federal Reserve Chairman Jerome Powell to cut interest rates on Wednesday. And the easing of trade tensions directly affected the performance of safe-haven assets. The decline in gold prices reflects the market's optimistic expectations for the progress of Sino-US trade negotiations, weakening the attractiveness of gold as a safe-haven asset!The market is closely watching the upcoming non-farm payrolls data and the Fed's meeting resolution on June 17-18 to judge the short-term direction of gold prices. On the whole, international gold still has long-term investment value under the current global economic and geopolitical uncertainties. In the short term, it may fluctuate in a relatively high range, waiting for more guidance from economic data and policy signals.
Technical Review:
Gold closed alternately in the first four trading days of this week. Yesterday, gold rose sharply in the Asian and European sessions, and fell back in the US session. The roller coaster at the end of the session gave up all the gains during the day and fell below the 3350 mark to touch the 3339 line. The daily line pattern turned from a big positive to a big negative K and closed above 3350. Technically, the daily chart has alternated between positive and negative for four consecutive trading days. The US session fell sharply and tested the MA7-day moving average, but the price is still running above the MA10/7-day moving average. The Bollinger band of the short-term four-hour chart closed, the RSI indicator's middle axis flattened, and the hourly chart's four-hour moving average was glued. The technical side of gold intraday trading is arranged with a shock idea, and the intraday range refers to the 3328/3388 layout. Fundamentals today focus on the non-agricultural data released at 20:30 in the evening. The previous value was 177,000, and the market estimated value was only 130,000. According to the estimated value, it is bullish for gold and silver.
Today's analysis:
This year, it has been emphasized that 2025 is a strong year for gold. Gold may enter an accelerated buying structure this year. Tariff trade policies, geopolitical tensions, the Federal Reserve's interest rate decision, the decline in confidence in US bonds, and the increase in global central bank purchases have affected gold as a strong hedging tool. There will be room for growth. Therefore, as long as the overall environment remains unchanged, gold is still an absolute buying trend. Therefore, no matter how it is adjusted, it is an opportunity to buy into the warehouse. This week, gold remained in the range of 3332-3392 for the first three days. During this period, we sold at a high price and bought at a low price, which was also considered to have completed the expectations. Then, on Thursday and Friday, gold will remain in this range and look up. If the rise breaks through and stabilizes at 3400, the upper side will look at 3500. If it breaks through 3330, the lower side will look at 3280. Look for fluctuations before non-agricultural data, and then look at the impact of non-agricultural data.
Operation ideas:
Short-term gold 3340-3360 buy, stop loss 3330, target 3380-3400;
Short-term gold 3387-3390 short, stop loss 3400, target 3350-3330;
Key points:
First support level: 3342, second support level: 3328, third support level: 3303
First resistance level: 3376, second resistance level: 3388, third resistance level: 3410

XAUUSD BUY IDEAGold tapped a strong Demand Zone, rejecting with bullish momentum despite overall bearish conditions. Low volume + MSS confirms a potential bounce.
Entry: 3,352.79
SL: 3,338.04
TP1: 3,370.00
TP2: 3,388.00
TP3: 3,415.00

XAU/USD(20250606) Today's AnalysisMarket news:
The European Central Bank cut three key interest rates by 25 basis points. Lagarde hinted that the rate cut cycle will end, and the market is no longer fully pricing in another 25 basis point rate cut this year.
Technical analysis:
Today's buying and selling boundaries:
3365
Support and resistance levels
3428
3404
3389
3340
3325
3301
Trading strategy:
If the price breaks through 3365, consider buying, the first target price is 3389
If the price breaks through 3340, consider selling, the first target price is 3325

XAUUSD – Bearish Outlook from Resistance Zone📊 XAUUSD – Bearish Outlook from Resistance Zone
🕒 Date: June 5, 2025
💰 Instrument: Gold (XAUUSD)
📍 Current Price: 3,352.730 USD
🟨 Key Resistance Level
🔴 Price has sharply reacted from the 3,375–3,400 USD zone, highlighted as a strong resistance area.
📉 This zone has previously triggered significant sell-offs, confirmed again by the current bearish rejection (red arrow 🔻).
📉 Bearish Market Structure
The price structure suggests a classic lower high rejection scenario with potential for further downside:
🔻 Immediate Drop Expected
After rejection from resistance, the price shows early signs of breakdown. A minor pullback is expected before continuation.
🧭 TP1 – First Target Zone:
📍 3,245.560 USD
This level aligns with a previous demand area (light red box), likely to act as temporary support or reaction point.
🎯 TP2 – Final Bearish Target:
📍 3,127.527 USD
This blue demand zone is a major support level, previously a strong rally base (green arrow 🟢). Expect buyers to step in here again.
🔄 Trade Idea Summary
💼 Setup Type: Resistance Rejection
🛑 Bias: Bearish
📍 Entry Zone: ~3,350–3,360 USD (confirmed rejection)
🎯 Take Profit 1: 3,245.560 USD
🎯 Take Profit 2: 3,127.527 USD
🔒 Stop Loss: Above 3,400 USD (outside resistance zone)
📌 Observations:
🔁 The market repeated its previous pattern: bouncing from the blue demand zone and rejecting at the yellow resistance zone.
🧱 A solid breakdown below TP1 could accelerate movement toward TP2.
🔍 Watch for any bullish reaction around TP2 for potential reversal setups.
📉 Bias: Bearish
📆 Outlook: Short-term to mid-term swing

Is there still hope for the bull market to rise today?📰 Impact of news:
1. Progress made in talks between China and the USA
📈 Market analysis:
In view of the non-agricultural data to be released on Friday, the market is expected to maintain a volatile consolidation trend before then. From the daily level: the Bollinger Bands open gently, the gold price is running below the upper track 3414, and the MACD golden cross is running slowly, suggesting that the bullish momentum is weak. At the hourly level, the short-term short position is strong, and there is a certain rebound demand. Therefore, we pay attention to the 3343-3333 support line below, focusing on the 3300 support. After the gold price falls below the 3360 support, the 3360 position will suppress the gold price in the short term.
🏅 Trading strategies:
BUY 3343-3333
TP 3360-3370-3380
SELL 3360-3370
TP 3330-3320
If you agree with this view, or have a better idea, please leave a message in the comment area. I look forward to hearing different voices.
OANDA:XAUUSD FX:XAUUSD FOREXCOM:XAUUSD FXOPEN:XAUUSD TVC:GOLD

Gold is long near 3350 in the US market
It was at 3361 the previous second, and it reached 3348 the next second. The market was directly washing up and down. You said it would fall. It broke through 3400 directly when it rose, but then fell again. It fell directly below the 3350 bullish dividing point when it fell. The current point is around 3353.
Friday is the big non-agricultural data, and we are waiting for the non-agricultural data to be laid out again tomorrow!
Gold: BUY GOLD zone: light position operation (can add positions in batches)
$3344- $3354 SL $3339
TP around3400- 3410

GOLD 1H CHART ROUTE MAP UPDATEHey Everyone,
As anticipated, the market structure continues to respect our key levels and EMA5 dynamics to the letter.
After the clean bounce from 3334 into 3359, price did indeed push back toward 3389 for the retest, just as outlined. Once again ema5 failed to cross and lock above 3389, confirming rejection again. It’s important to highlight that price did retest 3389 exactly as projected, completing the range once again.
Crucially, no further EMA5 cross and lock above 3389 was seen, reconfirming the rejection and driving price back into the lower Goldturns, which we will now look for support and bounce off these levels.
The structure continues to unfold with precision, showing once again how effective our level based framework is when paired with EMA5 confirmations. This setup keeps us well aligned with market momentum.
As always, we remain focused and continue to buy dips using our support levels, capturing those 20 to 40 pip opportunities. As we’ve proven time and again, each level gives enough of a bounce for a quality entry and exit.
We encourage everyone to backtest our levels, we’ve shared them weekly for the past 3 years , and the data speaks for itself. These levels continue to work brilliantly with both short/mid term trends and countertrends.
BULLISH TARGET 3305 – ✅ DONE
EMA5 CROSS AND LOCK ABOVE 3305 WILL OPEN THE FOLLOWING BULLISH TARGETS
3334 – ✅ DONE
3359 – ✅ DONE
3389 – ✅ DONE (retested as forecasted)
EMA5 CROSS AND LOCK ABOVE 3389 WILL OPEN THE FOLLOWING BULLISH TARGET
3428
EMA5 CROSS AND LOCK ABOVE 3428 WILL OPEN THE FOLLOWING BULLISH TARGET
3478
BEARISH TARGETS 3271
EMA5 CROSS AND LOCK BELOW 3271 WILL OPEN THE FOLLOWING BEARISH TARGET
3227
EMA5 CROSS AND LOCK BELOW 3227 WILL OPEN THE SWING RANGE
3185
3146
Stay sharp, manage risk, and trust the levels. We’ll continue providing updates as the structure develops further.
Thank you again for all your likes, comments, and continued support.
Mr Gold
GoldViewFX

The long strategy has been successful, pullback and go long📰 Impact of news:
1. European Central Bank deposit facility rate in the eurozone as of June 5
2. Initial jobless claims data
3. Non-farm payroll data
4. Worsening geopolitical situation
📈 Market analysis:
At present, the gold price has broken through the previous highs of 3392 and 3395. There is no obvious peak signal in the short term. At the same time, as the gold price continues to rise, the lower support will also move up in the short term, and the 4HMACD has a golden cross trend. In the short term, pay attention to the 3385 support below and the 3410 resistance above. The 1H indicator is close to the overbought area. We still need to be vigilant about the risk of rising and falling. If the gold price retreats to 3390-3385, we can consider going long with a light position.
🏅 Trading strategies:
BUY 3390-3385-3375
TP 3400-3410
If you agree with this view, or have a better idea, please leave a message in the comment area. I look forward to hearing different voices.
OANDA:XAUUSD FX:XAUUSD FOREXCOM:XAUUSD FXOPEN:XAUUSD TVC:GOLD

Is there still a chance for a bull market in gold's decline?📰 Impact of news:
1. European Central Bank deposit facility rate in the eurozone as of June 5
2. Initial jobless claims data
3. Non-farm payroll data
4. Worsening geopolitical situation
5. Watch the impact of the dialogue between Trump and Xi Jinping on gold
📈 Market analysis:
This round of geopolitical conflict caused an upward breakthrough, but the price has cooled down due to the negotiations between China and the United States. The current market is swaying at 3374. In fact, gold has not yet taken a more obvious direction. After all, tomorrow, Friday, is a key node in the data market game. At the 4H level, today's European session has reached the 3404 line, and encountered resistance and pressure here. The current retracement is in line with our expectations, and we expect to go long. As long as the key position of the middle track is maintained, it will continue to rise after being pulled down. At present, I still hold long orders.
🏅 Trading strategies:
BUY 3390-3385-3375
TP 3400-3410
If you agree with this view, or have a better idea, please leave a message in the comment area. I look forward to hearing different voices.
TVC:GOLD FXOPEN:XAUUSD FOREXCOM:XAUUSD FX:XAUUSD OANDA:XAUUSD

Beware of fake gold price rises and real falls
📊Technical aspects
International gold rebounded from the bottom on Wednesday and closed up strongly again. On Wednesday morning, the gold price fell to 3345 and then rebounded quickly.
During the Asian session, the gold price reached 3370 and then fluctuated downward. In the afternoon session, the gold price reached 3350 and then fluctuated upward. During the European session, the gold price reached 3365 and then expanded the intraday decline.
On the eve of the opening of the US session, the gold price reached 3340 and then rebounded. During the US session, the gold price expanded the intraday increase and reached 3385 before a slight decline.
The number of ADP employment in the United States in May was 37,000, which was 110,000 lower than the market expectation and the previous value was 62,000.
Data is lower than expected, gold is rising? As far as gold is concerned, it is only in a wide range of fluctuations and there is still no clear direction.
Through the above trend, we can clearly recognize that gold has insufficient upward momentum. Gold can no longer meet the current short-term profit, and there is no need to deliberately pursue it. Our most important goal is to seize the market of 100-200 US dollars.
💰 Strategy Package
Short Position:3375-3380

Gold Price Analysis May 6D1 Frame
It is not surprising that the price has increased again. If this momentum continues, the 3408 level can be reached today.
H1 Frame
The uptrend is clear, heading towards the area above 3400.
3363 is a good support zone, suitable for BUY orders in the Asia - Europe session.
3344 is an important level. If broken, the short-term uptrend will be broken and we need to wait for a new wave.
Resistance to watch
3382 is the nearest resistance zone in today's session.
3397 is an area prone to false breaks (old peaks). The price may react slightly here before reaching the 3408 level.

Trading strategy in US sessionGold price in the short term of the US session. The pulling of the h1 candle's wick creates an important liquidity zone of 3373. When h1 closes above this zone, it confirms that the US session will be a bullish session and can reach 3398 at the end of the session. If it closes below 3373, the BUY zone will be noticed at the support reaction in the European session around 3362.

Gold Potential UpsidesHey Traders, in today's trading session we are monitoring XAUUSD for a buying opportunity around 3,370 zone, Gold is trading in an uptrend and currently is in a correction phase in which it is approaching the trend at 3,370 support and resistance area.
Trade safe, Joe.

Gold Breaks Out of Bullish Flag >> Eyes on $3,480 and $3,720Alright, so looking at this 4-hour chart of Gold, there's a really clean bullish flag pattern that’s just broken out, which is a strong continuation signal.
You can see that after that big push upward, the price consolidated inside a downward (sloping channel for a few weeks. That’s pretty classic behavior. a strong move followed by a period of rest where the market cools off a bit, but without giving up too much ground. That’s what forms the "flag."
Now, the exciting part is that we’ve just broken out of that channel to the upside, and it’s not just a breakout for the sake of it, it’s supported by an inverse head and shoulders right at the top of the channel. That’s a double confirmation that buyers are stepping in with conviction.
The chart also marks two potential targets:
The first target is around $3,480, which is a reasonable measured move based on the height of the flag.
The second target is around $3,720, which would be a more extended continuation if the momentum kicks in.
As long as the price holds above the breakout area (around $3,320–$3,340), this setup looks solid. If we pull back and retest that area and hold, that might be a great long entry with those two targets in mind.
If price drops back into the channel, though, that could mean the breakout was a fakeout, so that level is key.

Gold is expected to continue to 3410-3420At present, gold has risen to around 3395 in the short term, breaking through the short-term high of around 3392, and there is no clear peak signal; and after breaking through the previous high of around 3392, there is no need to worry about the suppression of the technical double top structure for the time being. From this point of view, gold still has the potential to continue to rebound in the short term, and is even expected to reach the 3410-3420 area; this morning, gold has not fallen below 3360 during the adjustment process. As gold rises, the lower support area gradually moves up. The current short-term support area is in the 3385-3375 area.
Today's trading strategy:
1. Consider shorting gold when it first touches the 3410-3420 area, TP: 3395-3385
2. Consider trying to go long gold in small batches when gold falls back to the 3385-3375 area, TP: 3395-3405