Gold is under pressure! What is the key to breaking the deadlock
📌 Core driving events
The conflict between Iran and Israel has entered the fifth day. Air raid alerts in Tel Aviv are frequent. The fire on a cruise ship in the Strait of Hormuz has exacerbated the panic of energy transportation. Safe-haven buying supports gold prices;
Trump's contradictory statement of "peace talks + tough" (may send executives to meet but demand "unconditional surrender") has exacerbated the market's disagreement on the direction of the conflict, and risk aversion has fluctuated repeatedly.
The Federal Reserve will announce its interest rate decision today. The market expects it to remain unchanged at 4.25%-4.50%, but Powell's statement on rate cuts will affect the trend of the US dollar (Trump continues to pressure for a 1 percentage point rate cut).
📊Comment Analysis
1-hour chart: 3396 becomes the intraday strength and weakness watershed
The Asian morning session hit a high of 3396 US dollars and fell back. This point is the previous high pressure point. If the intraday rebound does not break through this position, the bearish thinking will be maintained;
💰Strategy Package
Set gold price:
🔥Sell gold area: 3390-33396 SL 3402
TP1: 3380 US dollars
TP2: 3375 US dollars
🔥Buy gold area: $3374-$3368 SL $3362
TP1: 3390 US dollars
TP2: 3400 US dollars
⭐️ Note: Labaron hopes that traders can properly manage their funds
- Choose the number of lots that matches your funds
Goldprediction

Gold-----Sell near 3405, target 3390-3360Gold market analysis:
Yesterday's daily line closed with a big negative line, which was basically a day to kill the buying. Today's idea is to sell in the short term. The daily and weekly trends have not yet turned to selling. Although the daily line closed with a big negative line yesterday, its shape and indicators have not completely turned to selling. There is still motivation to buy in the later stage. In addition, Iran and Israel are still fighting. It is still difficult to see a deep decline in the short term. We estimate that today's Asian session will rebound slightly and then fall. If today's daily line continues to fall again, it may enter a new short-term selling mode. We are just a follower. We follow the short-term. If the short-term trend is bearish, we will rebound and sell. The daily line closes the negative Asian session and waits for the opportunity to sell.
In the Asian session, we pay attention to the suppression of the 3410 position. It is the suppression position of the shape, the suppression position of the 1-hour moving average, the central axis position of yesterday's big drop, and the suppression position of the daily line. If the Asian session stands on 3410, it may bring a new technical rise in buying. After all, the shape of the daily line is still buying. Secondly, if it breaks 3382, it can continue to sell it with a small rebound. 3405 is also a suppression, and it is also considered to sell when it is close.
Pressure 3405 and 3410, support 3282, the strength and weakness dividing line 3400.
Fundamental analysis:
Yesterday, Iran and Israel started bombing each other again, and the situation began to escalate.
Operation suggestion
Gold-----Sell near 3405, target 3390-3360

Gold is weak, and there may be a low point yet to come!According to the current structure, gold is obviously in a weak position. Gold has failed to break through the high point of the previous wave after multiple rebounds during the day. 3400 has become a new round of pressure area; and gold has just accelerated its decline and fell below 3370. For the current trend, falling below 3370 will weaken the bullish sentiment to a certain extent and indicate that there is further room for decline, so I think gold should have a low point, and the low point we should first pay attention to is in the range of 3365-3355.
So in terms of short-term trading,
First, we can try to short gold with the short-term resistance area of 3395-3405;
But if gold first retreats to the support area of 3365-3355, we can first choose to go long on gold.

Have you caught up with this golden opportunity?The 4-hour K-line pattern of gold shows that the upward trend remains intact, focusing on the strong support range of 3360-3365 (technical resonance with the 5-week moving average). Before the price effectively breaks below the support band, the bulls still have upward momentum, otherwise the trend may reverse. The 3365-3400 range is maintained for intraday fluctuations. The gold operation strategy recommends arranging long orders in the 3370-3375 area when the price falls back, and adding positions to long positions if the support of 3360-3365 is broken.
Operation strategy: Gold recommends going long near 3370-3375 now, and adding positions to long positions in the support area of 3360-3365 when the price breaks, with the target of 3380-3390.
If you still lack direction in gold trading, you might as well try to follow my pace. The strategy is open and transparent, and the execution logic is clear and definite, which may bring new breakthroughs to your trading. The real value does not rely on verbal promises, but is verified by the market and time.

Will ASIA favor BULLS or BEARS?Two “if-this-then-that” scenarios
If price pushes above the recent swing high (~3 430–3 435)
→ Look for a move toward the 50% retracement zone at 3 415–3 416 (our next upside target).
If price drops below the recent swing low (~3 356–3 357)
→ It’ll likely slide down to the 21-day EMA at 3 342, which has acted like a magnet/bounce area.
Why the 21-day EMA matters
It’s sloping up beneath price (green trendline), so dips into it often spark fresh buying.
A buy-limit order around 3 342 gives you a low-risk entry with the trend still intact.
Overall bias
As long as gold stays above that rising trendline/21 EMA, the bulls remain in control.
Break the swing high → more upside.
Break the swing low → deeper pullback into support.

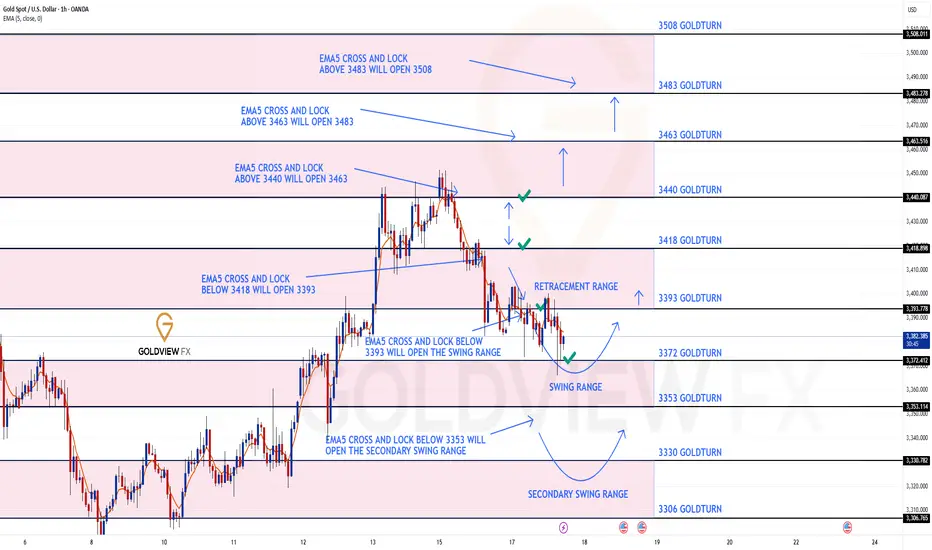
GOLD ROUTE MAP UPDATEHey Everyone,
Another great day on the markets with our chart idea playing out, as analysed!
Yesterday we started with our Bullish target at 3440 hit, followed with no EMA5 cross and lock, confirming the perfect rejection and showcasing the accuracy of our levels. This rejection went on to hit our Bearish target, followed by EMA5 cross and lock opening 3393, which was also hit perfectly.
🔄 Update:
After testing 3393, we got the EMA5 cross and lock, opening the swing range. The first level was tested perfectly and gave the bigger bounce. Let’s see if it completes the full swing back to 3393, or if it goes for the full swing test below.
We will keep the above in mind when taking buys from dips. Our updated levels and weighted levels will allow us to track the movement down and then catch bounces up.
We will continue to buy dips using our support levels, taking 20 to 40 pips. As stated before, each of our level structures gives 20 to 40 pip bounces, which is enough for a nice entry and exit. If you back-test the levels we shared every week for the past 24 months, you can see how effectively they were used to trade with or against short/mid-term swings and trends.
🌀 The swing ranges give bigger bounces than our weighted levels - that's the difference between the two.
BULLISH TARGET
3440 - DONE
EMA5 CROSS AND LOCK ABOVE 3340 WILL OPEN THE FOLLOWING BULLISH TARGETS
3463
EMA5 CROSS AND LOCK ABOVE 3463 WILL OPEN THE FOLLOWING BULLISH TARGET
3483
EMA5 CROSS AND LOCK ABOVE 3483 WILL OPEN THE FOLLOWING BULLISH TARGET
3508
BEARISH TARGETS
3418 -DONE
EMA5 CROSS AND LOCK BELOW 3418 WILL OPEN THE FOLLOWING BEARISH TARGET
3393 DONE
EMA5 CROSS AND LOCK BELOW 3393 WILL OPEN THE SWING RANGE
3372 - DONE
3353
EMA5 CROSS AND LOCK BELOW 3353 WILL OPEN THE SECONDARY SWING RANGE
3330
3306
As always, we will keep you all updated with regular updates throughout the week and how we manage the active ideas and setups. Thank you all for your likes, comments and follows, we really appreciate it!
Mr Gold
GoldViewFX
Gold continues to fall. Will there be a lower point?Gold is still under pressure at the integer mark of 3400. During the US trading session, the lowest point reached around 3366. For the current trend, it fell below the short-term support area of 3375, so the market has the possibility of further downward movement to test the support of 3350.
Today, Iran launched missiles again, but there was no threat to Israel at all, and all the missiles were intercepted. Under the current trend of further decline, the support position that needs to be paid attention to is 3350. At this position, you can try a long strategy, and the early support point of 3400 above has turned into an upward pressure point.
Short-term operation strategy:
Buy near 3350, stop loss 3340, profit range 3380-3390.
Above, you need to pay attention to the important pressure level of 3390-3400. The market changes violently, and you can take profits at the right position. Avoid rapid changes in market conditions and losses.

Gold maintains bullish trend
💡Message Strategy
Gold rebounded in shock before the US market, and the market rose. Previously, gold recorded the largest single-day drop in a month (1.4%) on Monday. After the sudden situation in the Middle East and US President Trump's warning to Tehran, the market's risk aversion demand heated up again, pushing gold prices to rebound in the Asian session.
The two-day interest rate meeting of the Federal Reserve has also become the top priority of the market. Tensions in the Middle East have heated up again. According to Reuters, Israel's air strikes on Iran's state-run TV station, Iran's threats to launch the most violent missile attack in history, and the fire of three oil tankers near the Strait of Hormuz have caused market concerns about the escalation of geopolitical conflicts. US President Trump left the G7 summit early and convened a national security meeting, which increased market risk aversion.
At the same time, ETF holdings have increased significantly. Data shows that ETFs increased their gold holdings by 136,000 ounces on the previous trading day, and the net purchase volume has reached 6 million ounces this year, reflecting that funds still have strong confidence in the future of gold. SPDR Gold ETF recorded a single-day net inflow of US$285 million last Friday, the largest scale in weeks.
In the US macroeconomics, the market generally expects the Federal Reserve to keep interest rates unchanged this week, but the focus is on Powell's speech and changes in the dot plot. As expectations of further interest rate cuts in 2025 heat up, the US dollar is still under pressure near a three-year low, and analysts believe that this will form structural support for gold in the medium term.
📊Technical aspects
The gold daily candlestick chart shows that the current trend is in a typical "rising wedge" pattern. Prices have been rising steadily along an upward trend line this year, while the upper side is suppressed by strong resistance in the 3420-3430 area. The current market is in a wait-and-see state.
The current gold market sentiment is in a "highly sensitive" stage. On the one hand, risk aversion once pushed gold to rebound rapidly, reflecting the market's extremely high pricing sensitivity to geopolitical risks; on the other hand, traders are still uncertain about the outlook for the Fed's policy, and the expectation that interest rates will remain unchanged has been fully priced in, but there are large differences in the future path of interest rate cuts.
If the results of the FOMC meeting are hawkish or Powell sends a signal that there will be no interest rate cut, and the market's risk aversion sentiment eases, gold may fall back to the key support area of 3350-3360 US dollars. Traders are closely watching the changes in the Federal Reserve's monetary policy and geopolitical situation, and at the same time be alert to the risks of "false breakthroughs" and sharp pullbacks.
💰 Strategy Package
Trend: Upward trend
Support: Around 3360.00
Resistance: Around 3420.50
Long Position:3365-75
Stop loss at 3350, take profit around 3400-3420, and trailing stop loss of 300 points.

Falling below 3380,testing 3365,the low position remains bullish📰 Impact of news:
1. Geopolitical tensions in the Middle East
2. Iran nuclear talks
3. Retail sales data
📈 Market analysis:
After rebounding to the 3400 line, gold encountered resistance and fell back to test the support level of 3380. Although it was very close to the point of 3405 we gave, I did not enter the trade because gold has been in the middle section in the short term and has not rebounded to the ideal point.
There are too many long orders at high levels in gold. The international situation is so tense that gold is still slowly declining, but the geopolitical situation is still continuing. In addition, the retail sales data is bullish. Then, as the trading strategy given at noon, it is expected to test the short-term support of 3365-3355 below. I will consider going long in this range
🏅 Trading strategies:
BUY 3365-3355
TP 3380-3390-3400
If you agree with this view, or have a better idea, please leave a message in the comment area. I look forward to hearing different voices.
TVC:GOLD FXOPEN:XAUUSD FOREXCOM:XAUUSD FX:XAUUSD OANDA:XAUUSD

Continue the rally, get ready for gold to return to 3443
⭐️Gold News:
Gold prices (XAU/USD) fell for the second consecutive trading day on Tuesday, retreating from the gains in the early Asian trading hours, which had briefly pushed above $3,400. A slight rebound in the US dollar (USD) continued to put pressure on the precious metal, acting as a major resistance. However, the downside for gold seems limited due to escalating geopolitical tensions in the Middle East and growing market expectations that the Federal Reserve (Fed) will further cut interest rates in 2025.
Meanwhile, the ongoing air conflict between Israel and Iran has entered its fifth day, exacerbating concerns about further escalation in the region. This ongoing geopolitical uncertainty supports demand for safe-haven assets such as gold. Investors also remained cautious ahead of the Federal Open Market Committee (FOMC)'s two-day policy meeting, the outcome of which could affect the next move of non-yielding gold.
⭐️Technical analysis:
Gold price gets liquidity from the support level below: 3385, 3373 completed, short-term downward trend breaks, gold price will soon return to above 3400.
Set gold price:
🔥Sell gold area: 3443-3453 SL 3458
TP1: $3435
TP2: $3422
TP3: $3407
🔥Buy gold area: $3358-$3350 SL $3345
TP1: $3368
TP2: $3376
TP3: $3390
GOLD is in Retracement GOLD is in bullish trend and it can make a retracement so that would be around 3260

Buy GoldPrice is at a major Daily resistance,but becuz of the war between Israel and Iran, price may spike below to take out traders, then continue pushing upwards. However , all this is possible if this region hold support, if it does, I'd look to see a pattern been formed on the 1hr tf that indicates bullish momentum, if this doesn't happen, then there's a previous weekly resistant that price may fall in order to tap. But the most important thing is having a good psychology, that's what makes you a good trader, we can say so much about the market direction,but it should be noted that, things do change, anything can happen, so while waiting for the right setup or while anticipation for buys, only those with a strong and disciplined mindset will survive the chaos... Happy Trading 💹

Forward-looking trading, focus on 3380 support📰 Impact of news:
1. Geopolitical tensions in the Middle East
2. Iran nuclear talks
3. Retail sales data
📈 Market analysis:
Gold prices are currently in a narrow range of fluctuations again, and the signal of Iran restarting nuclear negotiations has weakened risk aversion, triggering a correction in gold prices during the session, but tensions in the Middle East remain an uncertain factor. In the short term, we still need to focus on the breakthrough of the 3380 support line. If the 3380 support line is strong, we can still maintain a long trading idea in the short term and look to 3400. On the contrary, once it falls below, it is expected to look to the 3350 line. Pay attention to the breakthrough of 3400 on the upside. If the Asian and European sessions cannot effectively break through this short-term resistance, gold will continue to fluctuate.
🏅 Trading strategies:
BUY 3380-3370
TP 3390-3400-3450
SELL 3400-3390
TP 3380-3370-3350
If you agree with this view, or have a better idea, please leave a message in the comment area. I look forward to hearing different voices.
OANDA:XAUUSD FX:XAUUSD FOREXCOM:XAUUSD FXOPEN:XAUUSD TVC:GOLD

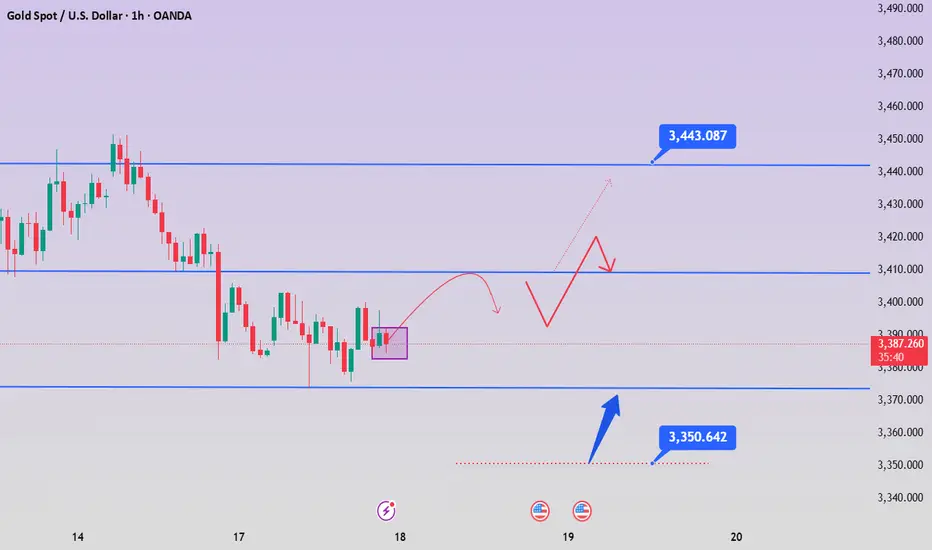
Gold on the Rise! – Bullish Setup in Focus The chart shows a repeating consolidation‑then‑breakout pattern, with Gold forming ascending swing structures, consolidating in rectangles (green), then riding higher along a rising trendline (purple). Price has just bounced off that trendline again, signaling a possible new leg up—potentially targeting the upper range near $3,448–3,450. A clear breakout above that level could open the door toward $3,500+.
📍 Trading Plan
🎯 Entry
Long on breakout above recent consolidation highs (~$3,440–3,448).
Alternatively, buy the dip near the purple trendline (~$3,385–3,390), with confirmation (hammer candle, bounce).
🛑 Stop‑Loss
For breakout: just below the top of the rectangle consolidation (~$3,389).
For trendline entry: slightly below recent swing low (~$3,358–3,360).
🎯 Profit Targets
Primary: upper rectangle level (~$3,448–3,450).
Extension: historic all‑time high region (~$3,500) → next major zone.
🎥 Path
Potential minor pullback toward trendline.
Bounce establishes support.
Surge toward top of range.
Breakout with trend continuation to new highs.
📊 Trade Risk & Reward
Target ~60–100 pts above entry, stop ~50 pts below → ideal Risk:Reward ≥ 1:1.2.
📌 Key Levels to Monitor
Level Role
$3,360 Swift dip support (green base line)
$3,390–3,400 Trendline confluence zone
$3,440–3,450 Breakout area & top of rectangle
$3,500 Next major resistance/all‑time high
🧭 Market Context & Drivers
Broad uptrend remains intact amid geopolitical tensions, especially the Israel–Iran situation, which continues to support safe-haven flows
Markets are positioning ahead of Fed’s June 18 decision; dovish signals could fuel continuation toward new highs (~$3,500+)
.
Technical structure reflects bullish momentum—ascending wedge patterns with shallow dips and strong trendline bounces
.
✅ Summary
Bias: Bullish – uptrend intact.
Strategy: Go long on dip near trendline or on breakout above $3,445.
Stop‑Loss: Just below last swing low ($3,360).
Targets:
Near-term: $3,448–3,450
Medium-term: $3,500+

GOLD/USD Bearish Rejection at Resistance ZoneGOLD/USD Bearish Rejection at Resistance Zone 📉🟥
📊 Technical Overview:
The chart for GOLD/USD shows a clear price action behavior between a well-defined resistance zone (~3,480–3,510) and a support zone (~3,260–3,280).
🔻 Bearish Signals:
The price has tested the resistance zone multiple times (highlighted with red arrows and orange circles) but failed to break above it, indicating strong selling pressure.
The current price action suggests another lower high formation, which is a bearish signal 📉.
Recent candles are rejecting the upward move, pointing to potential downside movement.
🟩 Support Confirmation:
Previous reactions from the support zone (green arrows) show that buyers have consistently stepped in near the 3,260–3,280 range.
This level remains a key demand zone where a bounce might be expected.
🔁 Outlook:
If the price continues to reject the resistance and follows the pattern, we might see another drop towards the support area.
A break below the support zone would confirm a bearish breakout and could open the door to deeper downside targets.
📌 Conclusion:
GOLD/USD is trading within a range, but the repeated failures at resistance suggest bearish momentum might take control in the short term. A move back toward the support zone is likely unless a breakout above resistance occurs.
📉 Resistance: 3,480–3,510
🟩 Support: 3,260–3,280
🔍 Bias: Short-term Bearish unless resistance breaks

Is gold a short-term correction or a bull market turning point?Market news:
The London gold price has experienced a significant correction after hitting an eight-week high. Spot gold fell more than 1% on Monday, wiping out all the gains of last Friday. However, the escalation of geopolitical tensions in the Middle East, especially the continued conflict between Israel and Iran, still provides support for international gold prices. The upcoming Federal Reserve policy meeting has become the focus of market attention.The continued tension in the Middle East is an important driving factor for the recent fluctuations in spot gold. The conflict between Israel and Iran has escalated significantly since June 12. Israel's air strikes on the Iranian National Radio and Television Building and the Natanz uranium enrichment plant have caused serious damage to Iran's nuclear facilities. In addition to geopolitical factors, the policy trends of the Federal Reserve also have an important impact on international gold.For gold, the Federal Reserve's maintenance of high interest rates usually puts pressure on its price, because gold, as an interest-free asset, is less attractive in a high-interest rate environment. However, geopolitical risks and rising inflation expectations may offset some of the negative impacts, causing gold prices to remain volatile in the short term. Investors should pay close attention to the latest developments in the situation between Israel and Iran, the results of the G7 summit, and the Federal Reserve's economic forecasts, while being wary of the short-term impact of market sentiment and technical factors on gold prices. The monthly rate of US retail sales (commonly known as "horror data") will also be released on this trading day, and investors also need to pay close attention!
Technical review:
Technically, the daily price of gold is still running above the MA10/7-day moving average at 3364, the RSI indicator is above the value of the middle axis 50, and the price is running in the upper track of the Bollinger Band channel. The short-term four-hour chart MA10/7-day moving average high 3420 dead cross opens downward, the price pulls back to the middle track of the Bollinger Band, and the RSI indicator retreats to the middle axis. The short-term formation is a bearish shock and fall, but the gold price is still in the buying structure channel on the daily and weekly charts. The main idea of today's trading is to sell at a high price and buy at a low price! Gold began to pull back when the situation eased. The fermentation of this round of news was relatively restrained by large funds, and did not test the high point of 3500 upwards. Overall, the increase in gold prices was not large, and there was still a process of pulling. The fundamentals have not changed, and gold is still in a bull market. As we said before, if we keep above the key point of 3400, gold will continue to be bought. Now that it has fallen below 3400, the short-term has gone out of the small-level top, and the market is no longer so strong. For our short-term operations, the short-term correction of gold prices should focus on the daily cycle MA5 support and the weekly level MA5 support to buy!
Today's analysis:
Gold continues to weaken in the short term. After the rapid decline last night, the rebound strength is not strong at all. It is obvious that there is a large selling pressure above. For the market that broke the original upward trend, we also said last night that the decline is not very large. It just changed from buying to shock. Our intraday operations can be sold in the short term first!Although gold has fallen below 3400, the short-term direction has changed, but the general direction has not changed. It is still buying. In the future, we still have the opportunity to look at the high point of 3500, but we have to wait for the bottom to stabilize before we go to buy the bottom. I will say later that in the current market, we can only follow the trend. We will do whatever the market goes!
Operation ideas:
Buy short-term gold at 3383-3385, stop loss at 3372, target at 3420-3440;
Sell short-term gold at 3420-3423, stop loss at 3432, target at 3390-3370;
Key points:
First support level: 3383, second support level: 3372, third support level: 3353
First resistance level: 3418, second resistance level: 3430, third resistance level: 3450

Gold above the resistanceGold on weekly broke above the resistance at 3360 after 9 weeks, now its time to rally again.

Gold has recently broken below its 4-hour bullish Fair Value GapGold Market Analysis (In-depth & Strategic Overview):
Gold has recently broken below its 4-hour bullish Fair Value Gap (FVG) and is currently trading beneath its Consequent Encroachment (CE) level — a signal that short-term bullish momentum has weakened.
In the latest 4H candle, the market swept the liquidity resting below the previous day's lows, a classic move to trap early sellers and collect stop-losses. Right after this liquidity grab, the price touched the daily bullish FVG, found support there, and then managed to close back inside the 4H FVG. This action reflects a temporary defense by buyers — but the battle is far from over.
📌 Key Levels to Watch:
$3401: This is a critical resistance level. If the market successfully closes above $3401, it could signal a bullish continuation, paving the way for an upward move.
$3389: This is a crucial support level. If price breaks below $3389, it would likely lead to further downside movement, opening the door for deeper corrections.
⏳ Current Strategy:
The best move right now is to wait and watch how the market reacts to these key levels. A breakout above $3401 would confirm strength and potential bullish continuation. Conversely, a breakdown below $3389 could trigger a fresh wave of selling pressure.
🚨 Until one of these levels is clearly broken, the market may remain in a state of indecision or range-bound movement.
🔍 Always DYOR – Do Your Own Research!
Stay informed, manage your risk wisely, and avoid emotional decisions.

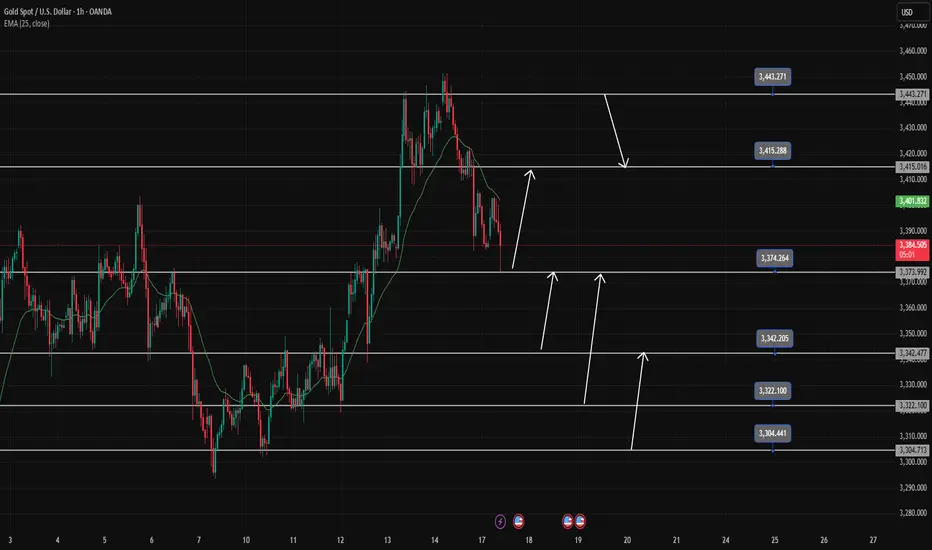
Gold (XAU/USD) 4H Technical Outlook-17 June 2025Gold’s 4-hour chart shows a clear uptrend: price is making higher highs and higher lows, trading above key moving averages and an upward trendline
Analyst ManiMarkets notes “a remarkably robust and sustained uptrend… printing higher highs and higher lows” since late 2024. The nearest major hurdle is around the $3,500 all-time high.
The current structure remains bullish: we have not seen a sustained break of the uptrend, so the overall bias is bullish. In Smart-Money terms, recent price action shows no bearish break of structure on 4H (no BOS), and price is simply consolidating near highs – a bullish sign.
Key zones to watch:
Demand/Order Block (~$3,374–3,380): Around $3,375 is a swing-low and past demand area. It lines up with the 4H EMA50 and 1H EMA200, a classical support confluence.
A strong bullish “order block” (heavy buying zone) sits here – a typical smart-money support area.
Pivot Point (~$3,389): Using the classic pivot formula
On the recent 4H range gives Pivot ≈ 3,389. This acts as a short-term balance point.
Resistance (≈$3,400–3,405): Gold has multiple prior highs around $3,400–3,405 (e.g. the overnight high ~$3,405 and the last swing high ~$3,405) which have been repeatedly tested. Traders are watching a break above ~$3,405 for follow-through. (A recent idea noted gold “bounced off support” near $3,390 and is “looking for a clean sweep of the highs at 3405”.)
Major Resistance ($3,500): The all-time peak around $3,500 is a big psychological barrier.
We expect stiff supply if price approaches 3,500.
Using these levels, the pivot-based support and resistance on the 4H chart are:
Pivot Point: ~$3,389
R1: ~$3,406 (Pivot + 1×range)
R2: ~$3,421 (Pivot + 2×range)
R3: ~$3,437 (Pivot + 3×range)
S1: ~$3,374 (Pivot – 1×range)
S2: ~$3,357 (Pivot – 2×range)
S3: ~$3,342 (Pivot – 3×range)
(These are rough levels using the standard formula on the last 4H high/low.)
Beyond numbers, price-action is key: we look for bullish patterns at support (e.g. bull-engulfing or pin-bar at ~$3,375–3,380) and cautious action near resistance. A brief “liquidity grab” happened at the $3,375 area recently (price wiggled below and then shot back up), which in Smart-Money jargon sweeps stops.
That suggests larger players may have been absorbing buying interest. In short, the tape looks healthy for bulls unless $3,375 breaks decisively. A break of the $3,400–3,405 highs would be a bullish BOS (break of structure), targeting the next supply zone.
Trade Setups (1H, Aligned with Bullish Bias)
Below are three high-probability long setups on the 1-hour chart (in line with the 4H uptrend).
Each is sized for a ~$10 stop from the entry zone.
Buy near $3,374–3,380 (Demand Zone):
Entry: $3,374–3,380 area (around Pivot S1 and the recent swing low).
Direction: Buy.
Stop: ~$3,364 (just below this zone, ~$10 lower).
Targets: ~$3,402 (near Pivot R1/previous high), and then ~$3,420 (around next resistance).
Reason: This zone is a confluence of support – it was a recent 4H low and aligns with EMAs (1H EMA200/4H EMA50)
It acts like a “bull order block” where buyers stepped in
A strong bounce from here keeps the bullish structure intact.
Trigger: Look for a bullish reversal candle on 1H (e.g. an engulfing or pin-bar) forming near $3,375. This confirms rejection of lower prices and signals a buy setup.
Chart: Example 1H gold chart. Blue shaded area marks the ~$3,374–3,380 buy zone (Pivot S1/EMA support). A bullish reversal candle here would trigger a long entry, targeting $3,402 then $3,420.
Buy break-&-retest at ~$3,402–3,408:
Entry: After a close above ~$3,405, look to buy on a pullback into $3,402–3,408 (just above the old high).
Direction: Buy.
Stop: ~$3,392 (about $10 below the entry zone).
Targets: ~$3,430 (next swing high) and ~$3,450 (round level/upper channel).
Reason: A decisive move above ~$3,405 would mark a BOS (break of the prior high), shifting structure higher. That resistance then becomes support on a retest. This is a classic “breakout retest” entry. (As noted, highs around 3,405 have been tested repeatedly, so breaking them signals strength.)
Trigger: Wait for a 1H candlestick to close firmly above 3,405, then buy on the next pullback into the $3,402–3,408 range with a bullish candle or dip-buy signal.
Buy on pullback to ~$3,385–3,390 (minor higher low):
Entry: $3,385–3,390 if price dips but holds above the 4H pivot (~3,389).
Direction: Buy.
Stop: ~$3,375 (below the entry zone, about $10 down).
Targets: ~$3,420 and ~$3,450 (same as above levels).
Reason: If the market skips Setup 1 and 2, any 1H pullback that still holds above the pivot (creating a higher-low) is another opportunity. Buying this higher-low keeps us aligned with the 4H uptrend. Essentially, we allow price to re-test the pivot area as new demand.
Trigger: A bullish reversal pattern on 1H in the $3,385–3,390 area (for example, a hammer or bullish engulfing) would mark a higher-low and signal a long entry.
Each setup has a tight stop (~$10) just beyond the support zone, and logical profit targets at nearby resistance levels. All assume the 4H trend stays intact. If support fails (e.g. a clean break under $3,374), be ready to reassess.
Takeaway: Gold’s 4H trend is bullish, so focus on buying dips into identified support zones (not shorting). Use tight stops beyond those zones and aim for the next resistance. In practice, that means looking to go long around ~$3,375–3,380 and ~$3,405 (on a clean breakout), riding any bullish continuation toward $3,430–$3,450, while managing risk at each step.

Citigroup predicts a decline in gold prices? Blacklisted?Information summary:
Citigroup analysts predict that by the second half of 2026, gold will fall back to around $2,500-2,700, with a significant reduction in investment demand, improved global economic growth prospects, and a decline in the factors that led to the rise in gold prices due to the Fed's interest rate cut.
My point of view is: blacklist Citigroup. Since last year, they have predicted that the highest point of gold prices will exceed $4,000, and they have constantly changed the forecast point in the middle, and now they even point out that the price will fall below $3,000, which is completely unreliable.
Market analysis:
In the early Asian session, it also rose strongly, and it seems that there is a lot of upward momentum, but $3,405 is the pressure position for the top and bottom conversion, and the rise in the morning is a lure. At this position, it fell rapidly, reaching a minimum of around $3,373.
The Asian market seemed to rebound strongly in the morning, but the MA5 and MA10 moving averages showed a downward trend. This kind of market cannot wait for a decline to go long, but it is also a repeated wash-out shock. The first focus below is the 3375-3370 area, followed by 3360. The short-term trend is still dominated by wash-out shocks.
The short-term important focus position is around 3405. 3405 is used as the dividing point between long and short positions. A short-selling strategy is carried out near this position. Pay attention to the 3375-3360 area below.

Gold Price Analysis June 17The D1 candle shows profit-taking by the sellers, pushing the price back below 3400. In the current context, the pullback is only short-term and has not confirmed the reversal, but long-term Buy signals can still be noticed at important support zones.
Today, there are many price zones that can BUY Gold, so wait for confirmation before placing an order. Gold is heading towards the first support around 3375-3373. This is also the Breakout zone. If it breaks out, Gold will go to 3343-3341 to be able to BUY (pay attention to sell break). If there is a sweep to 3343 and then bounces and closes above the 3373 breakout zone, it confirms that the uptrend will continue strongly in the near future.
The next BUY support zone to pay attention to is 3322-3320 and the 3305-3303 zone.
The BUY order target is always pushed further back to 3415 or 3443.

Gold trading strategy June 17D1 candle shows profit taking by sellers pushing the price back below 3400. In the current context, the pullback is only short-term and has not confirmed the reversal, but long-term Buy signals can still be noticed at important support zones.
Today, there are many price zones that can BUY Gold, so wait for confirmation before placing an order. Gold is heading towards the first support around 3375-3373 (this zone has just reacted 100 pips). This is also the Breakout zone. If it breaks this zone, Gold will reach 3343-3341 before it can BUY.
Note that to sell break 3373 and the SELL resistance point must wait for 3415 and the daily resistance 3443-3445
If there is a sweep to 3343 and bounces and closes above the 3373 breakout zone, it confirms that the uptrend will continue strongly in the near future.
The next BUY support zone to pay attention to is 3322-3320 and the 3305-3303 zone. The BUY target is always pushed further back to 3415 or to the peak around 3443.
SUPPORT: 3373;3342;3322;3304
RESISTANCE: 3415;3443
Geopolitics and Fed policies dominate the trend of gold prices
📌 Gold news
On Monday, boosted by the risk aversion of the Iran-Israel war, the gold price hit a high of 3452, but the continuity was not strong, and a series of other adjustments appeared; let's briefly sort it out:
1: Adjustment: Adjustment is normal. If the market rises, if the risk aversion does not continue to exert force, then the gold price can only return to technical adjustments. Therefore, Monday's adjustment trend and the decline trend are normal!
2: Risk aversion trend: The risk aversion trend will not be reversed for the time being! Once the war starts, it will not end easily; unless the interests of both sides are not damaged, the two sides agree to a ceasefire, but at present, the hope and probability are relatively small, so the risk aversion trend is the mainstream of the current global market;
3: The direction of the Iran-Israel war is nothing more than a few possibilities:
A: The war expands, the surrounding countries stand in line, and the US and Western imperialism join the battlefield; the war expands rapidly! At the same time, Iran is forced to block the Strait of Hormuz! This is a manifestation of escalating war;
B: Both sides, as well as the forces behind them, have calculated their interests, reached an agreement, and agreed to end the war conflict; this mainly depends on Iran's attitude; is it "powerful and unyielding", continuing to oppose the United States and imperialism; or is it pro-American, completely changing its identity, or changing its identity to submit to Israel and the United States;
To sum up: risk aversion eased slightly on Monday, but the overall global market is still risk-averse; technical adjustments are normal trends; but don't completely ignore the importance of risk aversion and risk aversion control because of technical adjustments; in addition, the subsequent results of the Middle East war are nothing more than the above two; what determines all this is the attitude of both sides;
📊Comment Analysis
Although the gold price fell below 3400 and the short-term trend changed, the general direction still remains bullish. In the future, it is still expected to hit the high point of 3500, but it is necessary to wait patiently for the bottom to stabilize before choosing the opportunity to buy the bottom. The current market is changing rapidly, and investors should adhere to the principle of following the trend and flexibly adjust their trading strategies.
💰Strategy Package
Short-term gold 3383-3393 long, stop loss 3372, target 3420-3440;
Short-term gold 3420-3430 short, stop loss 3435, target 3390-3370;
⭐️ Note: Labaron hopes that traders can properly manage their funds
