Oil Extends Rally as Israel-Iran Conflict Stokes Supply FearsBrent jumps 5.5 %, bullion hits fresh records, but analysts still see $65 crude by Q4 if key shipping lanes stay open
The crude-oil market loves nothing more than a geopolitical headline, and the one that flashed across terminals this past weekend was a whopper: escalating hostilities between Israel and Iran. Within minutes of the first wire stories, Brent crude vaulted 5.5 % to an intraday high of $76.02 a barrel—its largest single-session pop since Russia invaded Ukraine in early 2022—before giving back part of the gain to settle just under $76. West Texas Intermediate (WTI) traced a similar arc, peaking at $74.11 and closing fractionally lower.
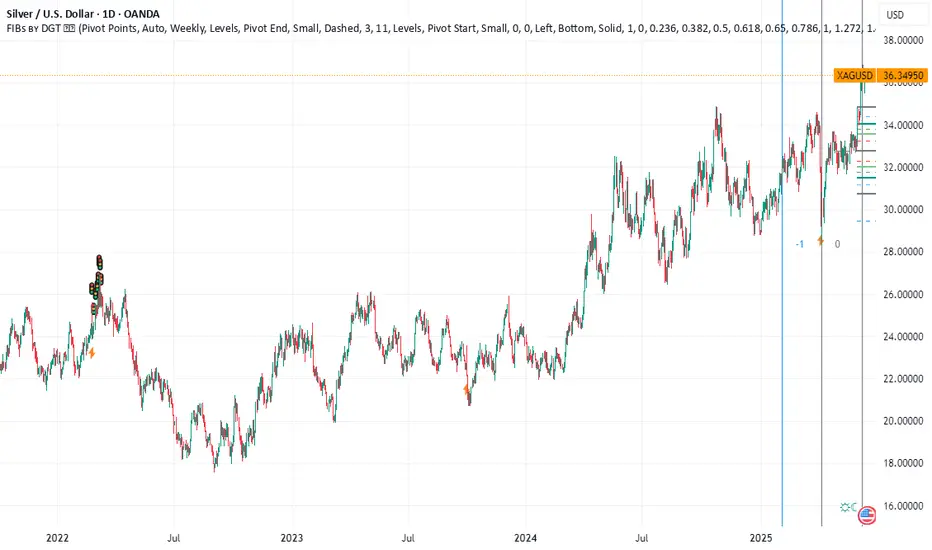
At the same time, investors stampeded into traditional havens. COMEX gold pierced $2,450 an ounce for the first time, while silver sprinted above $33—blowing past the decade-old high set during the meme-metal frenzy of 2021. The twin moves in energy and precious metals underscore how fragile risk sentiment has become even as global demand growth, OPEC discipline, and U.S. shale resilience point to a more balanced physical market later this year.
Below we dissect the drivers of crude’s latest surge, explore the scenarios that could push prices back toward—or away from—the $65 handle by the fourth quarter, and explain why bullion refuses to loosen its grip on record territory.
________________________________________
1. What Sparked the Spike?
1. Tit-for-tat escalation. Reports of Israel striking Iran-linked assets in Syria and Iran responding with drone attacks near the Golan Heights raised fears of a direct Israel-Iran confrontation—a worst-case scenario that could spill into the Strait of Hormuz and threaten 20 % of global seaborne oil.
2. Thin pre-holiday liquidity. Monday volume was 30 % below the 20-day average with several Asian markets closed, exaggerating price swings and triggering momentum-chasing algos.
3. Options market gamma squeeze. Dealers short upside calls scrambled to hedge as spot pierced $75, accelerating the melt-up. Open interest in $80 Brent calls expiring in June ballooned to 45,000 contracts—four times the 3-month norm.
________________________________________
2. How Real Is the Supply Risk?
While the headlines are chilling, physical flows remain intact for now:
• Strait of Hormuz: No tankers have been impeded, insurance premia have widened only 25 ¢ per barrel—well below the $3 spike seen after the 2019 Abqaiq attack in Saudi Arabia.
• Iraqi-Turkish Pipeline: Still shuttered for unrelated legal reasons; volumes have been offline since March 2023 and are therefore “priced in.”
• Suez Canal / SUMED: Egyptian authorities report normal operations.
In short, the rally is risk premia, not actual barrels lost. That distinction matters because premia tend to deflate quickly once tension plateaus, as the market witnessed in October 2023 after Hamas’s initial assault on Israel.
________________________________________
3. Fundamentals Point to Softer Prices by Autumn
Four forces could push Brent back into the $65–68 corridor by Q4 2025 if the geopolitical situation stabilizes:
Force Current Status Q3–Q4 Outlook
OPEC+ Spare Capacity ~5.5 mbpd, most in Saudi/UAE
Ability to add 1–2 mbpd if prices spike
U.S. Shale Growth 13.3 mbpd, record high +0.6 mbpd y/y, breakeven $47–55
Refinery Maintenance Peak spring turnarounds remove 1.5 mbpd demand Units restart by July, easing crude tightness
Global Demand +1.2 mbpd y/y (IEA) Slows to +0.8 mbpd on OECD weakness
Add seasonal gasoline demand ebbing after August, and the supply-demand balance tilts looser just as futures curves roll into Q1 2026 deliveries—a period typically beset by refinery slowdowns and holiday travel lulls.
________________________________________
4. Scenario Analysis: Three Paths for Brent
1. Escalation (20 % probability)
• Direct Israeli strike on Iranian territory → Tehran targets Hormuz traffic
• 3 mbpd disrupted for one month
• Brent overshoots to $100+, backwardation widens above $10
• Biden releases 90 mb from the SPR; OPEC signals emergency meeting
2. Containment (60 % probability)
• Hostilities remain proxy-based in Syria/Lebanon; shipping unscathed
• Risk premium bleeds off; Brent drifts to $70–72 by July
• By Q4 oversupply emerges; prices test $65
3. Detente (20 % probability)
• U.S.-mediated cease-fire; hostages exchanged
• Iran de-escalates to focus on reviving JCPOA talks
• Risk premium collapses; Brent revisits mid-$60s by August and low-$60s into winter
________________________________________
5. Why Gold and Silver Are On Fire
The precious-metals rally is less about oil and more about real yields and central-bank buying:
• Real 10-year U.S. yield sits at 1.05 %, down from 1.55 % in February, boosting gold’s carry cost competitiveness.
• PBoC & EM central banks added a net 23 tonnes in April—the 17th straight month of net purchases.
• ETF inflows turned positive for the first time in nine months, adding 14 tonnes last week.
Silver benefits from the same macro tailwinds plus industrial demand (solar panel capacity is growing 45 % y/y). A tight COMEX inventory cover ratio—registered stocks equal to just 1.4 months of offtake—amplifies price sensitivity.
________________________________________
6. Cross-Asset Implications
1. Equities: Energy stocks (XLE) outperformed the S&P 500 by 3 % intraday but could retrace if crude fizzles. Miners (GDX, SILJ) may enjoy more durable momentum given new-high psychology.
2. FX: Petro-currencies CAD and NOK rallied 0.4 % vs. USD; safe-haven CHF gained 0.3 %. JPY failed to catch a bid, reflecting carry-trade dominance.
3. Rates: U.S. 2-year yields slipped 6 bp as Fed cut odds edged up on stagflation fears, but the move lacked conviction.
________________________________________
7. What Could Invalidate the Bearish Q4 Call?
• OPEC+ Discipline Frays: If Saudi Arabia tires of single-handedly absorbing cuts and opens the taps, prices could undershoot $60—but Riyadh’s fiscal breakeven (~$82) makes this unlikely.
• U.S. Election Politics: A new White House may re-impose harsher sanctions on Iran or ease drilling restrictions, tilting balances either way.
• Extreme Weather: An intense Atlantic hurricane season could knock Gulf of Mexico output offline, squeezing physical supply just as refineries demand more feedstock.
________________________________________
8. Trading and Hedging Playbook
Asset Bias Vehicles Key Levels
Brent Crude Fade rallies toward $80; target $68 by Oct ICE futures, Jul $70 puts Resistance $78.80 / Support $71.30
WTI Similar to Brent NYMEX CL, calendar-spread (long Dec 24, short Dec 25) Resistance $75.20
Gold Buy dips if real yields fall below 0.9 % Futures, GLD ETF, 25-delta call spreads Support $2,390
Silver Momentum long until $35; tighten stops Futures, SLV ETF, 2-month $34 calls Resistance $36.20
Energy Equities Pair trade: long refiners vs. short E&Ps ETFs: CRAK vs. XOP Watch crack spreads
Risk managers should recall that correlation spikes under stress: a portfolio long gold and short crude looks diversified—until a Middle-East cease-fire nukes both legs.
________________________________________
9. Macro Backdrop: Demand Still Fragile
Even before the flare-up, oil demand forecasts were slipping:
• OECD: Eurozone PMIs languish below 50; German diesel demand –7 % y/y.
• China: Q2 refinery runs flatlining; teapot margins < $2/bbl.
• India: Bright spot with gasoline demand +9 %, but monsoon season will clip growth.
On the supply side, non-OPEC production is rising 1.8 mbpd this year, led by Brazil’s pre-salt, Guyana’s Stabroek block, and U.S. Permian efficiency gains. Unless Middle-East barrels exit the market, the call on OPEC crude will shrink from 28 mbpd in Q2 to 26.7 mbpd in Q4, forcing the cartel to decide between market share and price.
________________________________________
10. Historical Perspective: Geopolitical Risk Premiums Fade Fast
Event Initial Brent Jump Days to Round-Trip Barrels Lost?
2019 Abqaiq Attack +15 % 38 < 0.2 mbpd for 30 days
2020 U.S.–Iran (Soleimani) +5 % 10 None
2022 Russia-Ukraine +35 % Still elevated > 1 mbpd rerouted
Based on precedent, a 5–7 % surge without real supply disruption typically unwinds within six weeks.
________________________________________
11. Outlook Summary
• Base Case: Containment; Brent averages $70–72 through summer, melts to $65–68 Q4. Gold consolidates above $2,350; silver churns $30–34.
• Bull Case (Oil): Hormuz threatened; Brent $100+, gas prices soar, Fed forced to juggle inflation vs. growth.
• Bear Case (Oil): Cease-fire + soft demand; Brent breaks $60, OPEC+ grapples with fresh round of cuts.
•
________________________________________
12. Conclusion
The Israel-Iran flashpoint has injected a fresh geopolitical premium into oil and turbo-charged safe-haven metals, but history suggests emotion-driven rallies fade quickly when physical barrels keep flowing. Unless missiles land near Hormuz or an errant drone strikes a Saudi export terminal, the structural forces of rising non-OPEC supply and cooling demand should reassert themselves, dragging Brent back toward the mid-$60s by year-end.
For traders, that means respecting the tape today but planning for mean reversion tomorrow—selling gamma-rich call structures in crude, rolling stop-losses higher on bullion longs, and watching like hawks for any hint that shipping lanes are no longer merely a headline risk but a tangible bottleneck. Until that line is crossed, the smart money will treat each price spike not as the dawn of $100 crude, but as an opportunity to hedge, fade, and position for a calmer, cheaper barrel in the months ahead.
Goldprediction
GOLD/USD – Bullish Reversal Pattern FormingGOLD/USD – Bullish Reversal Pattern Forming 🟢📈
📊 Chart Analysis:
The chart shows a strong Inverse Head and Shoulders pattern forming, which is a classic bullish reversal signal:
🔹 Left Shoulder and Right Shoulder – Marked with orange circles, both found support near the 3,263 level (purple line), suggesting strong buying interest at this zone.
🔹 Head – The lowest point in between the shoulders, also bouncing from support.
🔹 Resistance Zone – Marked with red arrows around 3,500–3,520. This zone has rejected price action multiple times in the past.
🔹 Support Zone – Marked below 3,200, where previous consolidation and buying took place.
📈 Projected Move:
The neckline breakout suggests a potential move toward the 3,520+ level. A minor pullback is expected before continuation. If price breaks above resistance, we could see a strong bullish rally.
📌 Key Levels:
Support: 3,263 🟩
Resistance: 3,500–3,520 🟥
Potential Target After Breakout: 3,550+ 🎯
✅ Bias: Bullish above 3,263 support
⚠️ Invalidation: A break below the neckline would cancel the bullish setup

Gold (XAU/USD) Analysis - 16 June 20254H Chart: Market Structure & Bias
Gold’s 4-hour chart shows a bullish structure: price has been making higher highs and higher lows (a valid Break of Structure/BOS)
No bearish Change of Character (CHoCH) signal is present to suggest a reversal, so the overall bias remains bullish. In other words, the trend is intact and buyers still dominate. Key moving averages (not shown) also slope upward, reinforcing a “buy the dip” bias. We note that price recently stalled near 3427–3435, forming a small consolidation. This clustered area around the recent high acts as a near-term supply (resistance) zone (a possible order block where big players sold).
On the downside, prior support is visible around 3380–3400, where buyers stepped in on earlier pullbacks. In summary, the 4H bias is bullish, with dips into demand areas likely to attract buying interest.
Support/Demand Zones: At ~3380–3400 there is significant buying interest (a demand zone), as well as a minor support band around 3330–3350. These areas coincide with key Fibonacci retracements (around 50–62% of the last rally), making them high-probability bounce zones.
Resistance/Supply Zones: On the upside, the 3420–3435 range is resistance (recent swing high and a bearish order-block area).
Farther above, 3470–3485 is a major resistance cluster (around prior highs and a 61.8% extension), where supply may re-emerge.
Key Zones (4H Chart)
Buy Zone 1 (Demand): 3380–3400. This zone acted as support on prior pullbacks and aligns with ~50%–62% Fibonacci retracement levels. It represents a demand area (many buy orders), so bounces are likely here.
Buy Zone 2 (Support): 3330–3350. A deeper support area where buyers piled in previously. It coincides with the 61.8% Fib retrace of the last leg, making it a strong multi-purpose support/demand zone.
Sell Zone 1 (Supply): 3420–3435. This marks the recent 4H swing high and a potential bearish order block.
It has already capped rallies, so price may stall or reverse here on a retest.
Sell Zone 2 (Resistance): 3470–3485. A higher cluster of resistance (major psychological level and Fib extension) where selling could appear if gold extends its rally. This is a logical profit-taking area.
Each of these zones is a range (not just a line) to allow for some trade flexibility. We watch for price action (like pin bars or breakouts) within these ranges to signal entries.
1H Chart: Trade Setups
Buy at 3385–3395 (Long).
Entry Zone: 3385–3395 (just above the lower demand zone).
Stop-Loss: ~10 USD below the zone (around 3375).
Take-Profit: 3420 (minor resistance) and 3460 (next supply cluster).
Reason: This zone combines the 4H demand area and ~50% Fib support.
We expect bulls to defend this zone.
Trigger: Wait for a bullish reversal candle on 1H (e.g. a strong bullish pin bar or engulfing candle with a long lower wick). Such a candle (long-tail wick) at support indicates a liquidity grab by buyers. Alternatively, a clear 1H BOS above the last minor swing high would confirm strength and serve as a breakout entry.
Buy on 3425–3430 breakout (Long).
Entry Zone: Break above 3425–3430 (just above the recent 4H high).
Stop-Loss: ~10 USD below entry (around 3415).
Take-Profit: 3480–3490 (next resistance zone).
Reason: A push through the 3420–3435 supply zone would show buyers overcoming sellers. This would keep the uptrend running. The breakout opens room toward the 3470–3485 resistance area.
Trigger: Enter on a 1H bullish breakout/close above 3430 (a new higher high) – i.e. a bullish BOS confirming continued uptrend. Optionally look for a pullback to 3425 as a retest entry if the breakout is swift.
Buy at 3330–3340 (Long).
Entry Zone: 3330–3340 (deeper support zone on 4H).
Stop-Loss: ~10 USD below the zone (around 3320).
Take-Profit: 3380 (first target), then 3420.
Reason: This is a strong support/demand area (4H 61.8% Fib support). A drop here would be a deeper pullback – a higher-risk entry with a bigger reward if buyers step in.
Trigger: Look for a clear bullish reversal on 1H (e.g. hammer/engulfing candle) or a shift in structure (price fails to make a new low and instead forms a higher low). A bullish candlestick in this zone implies demand is defending it.
Each setup is aligned with the 4H bullish bias (we’re looking for long opportunities at support zones or breakouts). The ~$10 stops are set just beyond the defined entry zone, giving each trade a favorable risk/reward.
Takeaway: Gold’s 4-hour trend is up. We favor buying near the identified demand/support zones (or on a confirmed breakout above recent highs) and targeting the next resistance levels. Use tight stops (~$10 beyond each zone) and aim for 2:1+ reward on these high-probability setups.
Trade with the trend and respect the key zones above.

Geopolitical conflict re-emerges, price points to 3500?Information summary:
The powder keg of the Middle East situation exploded. A new round of fierce fighting between Israel and Iran has pushed the global financial market into a risk-averse storm. In just one day, gold soared. In the early Asian session on Monday, the price of gold was unstoppable, hitting a nearly seven-week high of $3451/ounce. Under the dark clouds of geopolitical conflict, gold bulls are in full swing, and the $3500 mark seems to be within reach.
In addition, the market will face two major tests this week: the monthly rate of US retail sales and the highly anticipated Federal Reserve interest rate decision.
Technical analysis:
At the daily level, the MA10, MA7, and MA5 moving averages are diverging upward, the RSI indicator turns upward, and the gold price is running steadily in the upper and middle track area of the Bollinger band. In the four-hour cycle, the moving average forms a golden cross arrangement and the opening continues to expand. The price continues to rise along the MA10 daily moving average, and the Bollinger band also maintains an upward opening shape.
The current market is dominated by geopolitical risks in the Middle East, and the gold price is consolidating at a high level. If the situation does not change, the gold price will most likely remain above $3,400 today, and it is even very likely to refresh the historical high of $3,500 today and tomorrow. Therefore, before the trend changes, the long strategy is still the best choice.
Operation strategy;
Buy near 3420, stop loss 3410, target 3460-3470.

Is this week a chance for gold to break through 3,500?
⭐️Gold Information:
Gold prices surged for the third consecutive trading day on Friday as geopolitical tensions intensified after Israel launched a military strike on Iranian targets, including nuclear facilities and key leaders. The escalation of the situation triggered widespread risk aversion in global markets, stimulating demand for safe-haven assets. As of the time of writing, XAU/USD was trading at $3,431.
Gold surged to a five-week high of $3,446 before giving up gains as traders took profits before the weekend. Geopolitical turmoil, coupled with dovish signals released by recent US inflation data, reinforced expectations that the Federal Reserve may begin to cut interest rates later this year - despite improved consumer confidence. These factors together support the bullish momentum of gold.
⭐️Personal Comment:
Continued military tensions next week are a big driving force for gold prices to continue to break through 3,500
. 🔥 Technical aspects:
Based on the resistance and support levels of gold prices in the H4 framework, the following important key areas can be identified:
Resistance: $3488, $3502, $3562
Support: $3382, $3342

XAU/USD(20250617) Today's AnalysisMarket news:
Trump: The United States may still intervene in the Iran-Israel conflict. If Iran launches an attack on the United States, the United States will "fight back with all its strength on an unprecedented scale." Iran and Israel should reach an agreement.
Technical analysis:
Today's buying and selling boundaries:
3419
Support and resistance levels:
3486
3461
3445
3394
3378
3353
Trading strategy:
If the price breaks through 3445, consider buying in, the first target price is 3461
If the price breaks through 3419, consider selling in, the first target price is 3394

Gold (XAUUSD) – Lower TF Wave (B) Top in Place? Higher TF Conflu⚠️ Price has now completed what appears to be a clean 5-wave advance into the key supply zone — potentially completing wave ((C)) of (B) on the lower timeframe.
• Wave ((ii)) = expanding flat
• Wave ((iv)) = expanding triangle
• Final ((v)) push into supply with RSI/MACD divergence
A breakdown below 3435 could confirm the reversal into wave (C). Downside fib targets align around 3400, 3350, and 3280.
A marginal high can’t be ruled out, but structure is now favouring bears short term.

GOLDGOLD is highly influenced by geopolitics right now, if the war escalates it could continue moving upwards towards 3500.
Disclosure: We are part of Trade Nation's Influencer program and receive a monthly fee for using their TradingView charts in our analysis.

GOLD - Near to his resistance region? Cut n reverse area??#GOLD.. .market just reached near to his current resistance region that is around 3451-52 to 3460-61
Keep close that mentioned region and keep in mind that is our ultimate region and only short expected below that.
Note: we will go for cut n reverse abo w that region on confirmation.
Good luck
Trade wisely

Gold (XAUUSD) Weekly Forecast - 16 to 20 June 2025🔥 Gold (XAU/USD) Weekly Outlook | June 16–20, 2025
🧭 Macro & Geopolitical Context
Israel–Iran war (Operation Rising Lion) has escalated: Israeli strikes on Iran’s nuclear and missile infrastructure on June 13, followed by Iranian missile/drone retaliation, have sharply intensified regional conflict .
The safe‑haven bid is in full swing: spot gold surged toward $3,500, breaking $3,400 last week, driven by risk‑off flows and a weaker US dollar .
🧩 Fundamental Catalysts
1. Fed dovish tilt: May CPI/PPI prints came in soft, lifting expectations for rate cuts. No change is expected at the June 18 meeting, but the Fed’s dot‑plot and Powell’s tone offer upside triggers .
2. Technical breakout: Gold has reclaimed key levels—23.6% Fibonacci (~ $3,377) now acts as support, with the next resistance zones at $3,450 → $3,500 .
3. Bank & analyst sentiment: Goldman Sachs sees potential for $3,700 by year-end; Bank of America projects a path toward $4,000/oz .
📊 Technical Setup & Levels
Support: $3,400; next down at $3,377 (23.6% Fibo) and $3,325 (21‑day SMA) .
Resistance: $3,450 → major barrier $3,500 (all‑time high).
Momentum: RSI around 62—leaves room for further upside .
Catalysts to Monitor
June 18 Fed meeting: Dot‑plot, Powell’s press conference.
Any Iran retaliation or widening of the conflict.
Short‑term US data: June CPI, PPI, Retail Sales (especially mid‑week).
USD strength or weakness—dollar reversal could clip gold gains.
Follow for more updates
#XAUUSD #GOLD #Goldanalysis #WeeklyAnalysis #trade

Gold's Wild Ride: Must-Know Price Predictions for Next Week!I can write a lot of smart words but lets make it short, like and sub from you for that)
3 options that i can see:
1- dump to Gap at 3292 then bounce target PWH or higher
2 - move a bit lower till PWL and then all the way up till PWH or ATH
3 - cancel all longs, move down below , break 3250 lvl with fvg and second shift on 4h time frame and then gold will keep going lower all the way down to 3k (Low-probability)
Risk aversion escalates, prices continue to rise?Information summary:
On the last trading day of last week, gold rose again under the stimulation of risk aversion. The gold market is shrouded in risk aversion in the Middle East. In the short term, the trend of gold is still supported by risk aversion and may continue to rise. At present, the relationship between Israel and Iran has not been eased; there is the latest news: Iran may retaliate against the air strikes it suffered this time. This will provide momentum for the rise of gold.
Market analysis:
Gold 1 hour shows that the moving average forms a golden cross and diverges upward, and the bullish trend of gold is still there. After the rise of gold risk aversion, gold has adjusted sideways in the short term, but it is still oscillating strongly at a high level; it is still in the process of rising. The short-term fluctuation of gold is the adjustment in the process of rising, and it will continue to rise at any time. After the gold bulls broke through 3400, they have been stabilizing above this position, so the strategy for next week is still to buy on dips.
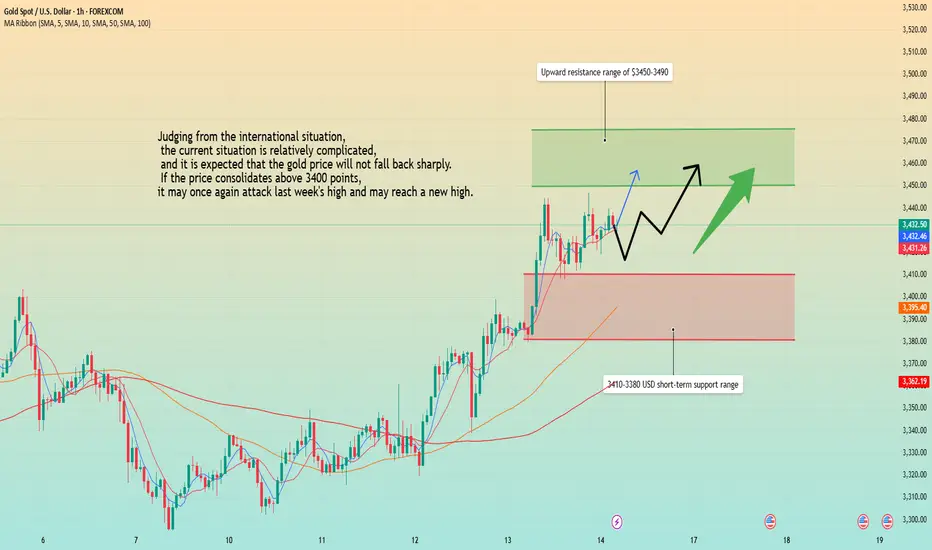
However, it should be noted that if the international situation suddenly changes, the price may not fall back, but directly rush to a new high.
In addition, if the international situation eases and falls below 3400, we must adjust the operation strategy in time to avoid losses.
Important positions:
Resistance levels: 3450, 3475, 3490
Support levels: 3410, 3400, 3380
Operation strategy:
Buy near 3410, stop loss at 3400, win range above 3450 points.
There are still 7 hours left before the Asian market opens. I hope my analysis can help all traders gain something in the gold market.
"Due to the economic crisis, the gold market may open with a gap"Due to the economic crisis, the gold market may open with a gap tomorrow."
This upward trend is attributed to increased demand for gold as a safe-haven asset amid geopolitical uncertainties. The conflict has also led to a spike in oil prices and a decline in global stock markets, further enhancing gold's appeal .

XUA/USD) Bullish trand support level Read The captionSMC trading point update
Technical analysis of (XAU/USD) on the 30-minute timeframe, incorporating a support zone and trendline confluence strategy. Here's a breakdown
---
Analysis Summary
Key Technical Elements:
1. Uptrend Channel:
Price is trading within a rising channel.
Higher highs and higher lows indicate bullish momentum.
2. Support Zones:
Key Support Level (near 3,400): A horizontal support zone has been marked where price previously bounced (confirmed by green arrows).
Trendline Support: This upward sloping trendline adds confluence to the horizontal support zone.
3. EMA 200 (3,377.96):
Acts as a dynamic support level.
Price is well above the EMA, supporting bullish sentiment.
4. Projected Price Move:
The chart anticipates a dip back to the support area (~3,400), followed by a bullish bounce.
Target is clearly defined at 3,504.01, with a measured move of about +103.36 points from the support.
5. RSI Indicator:
RSI is around 57, which is neutral to slightly bullish.
No overbought/oversold signal yet – supporting potential for more upside.
---
Bullish Bias Reasoning:
Confluence Zone: Horizontal + trendline + EMA 200.
Healthy Price Structure: Higher lows being maintained.
Momentum Indicator (RSI) supports continuation.
---
Risks / Considerations:
If price breaks below the confluence support (~3,400), bullish invalidation may occur.
Monitor for false breakouts or heavy selling pressure near resistance.
Mr SMC Trading point
---
Trading Plan
Buy Zone: Around 3,400 (support confluence).
SL: Below the trendline/EMA – e.g., 3,370 or lower.
TP: Around 3,504 (target zone marked).
Please support boost this analysis)

Is 3500 gold still far away?
💡Message Strategy
Gold prices rose overall this week, with bulls showing strength. This was mainly due to the positive CPI data from the Federal Reserve, the escalation of tensions in the Middle East, the uncertainty of trade tariffs, and strong long-term support from fundamental demand, which led to the continued strong trend of gold prices.
As risk aversion rebounded, gold prices rose rapidly, hitting the upper track of the Bollinger Band, which also caused gold prices to rise by more than 3.6% this week.
📊Technical aspects
As geopolitical tensions in the Middle East intensify over the weekend, gold prices may continue to benefit from risk aversion next week, and gold prices are expected to target $3,500/ounce at the beginning of next week
The key support point is 3408. The current price has broken through and stabilized above 3400, and is expected to run above this level for a period of time. When the first market correction tests around 3420, you can continue to buy. Judging from the cycle operation, there is a high probability of a high-level oscillation market in the 3500/3400 range. Before the Fed's results are announced on Thursday, you can sell high and buy low in this range.
💰 Strategy Package
Long Position:3420-3430
Combined with the current tense situation, you can buy light positions at the opening price, and add positions to make up for the rise when the market falls back to the target point. Don't blindly chase the short position.

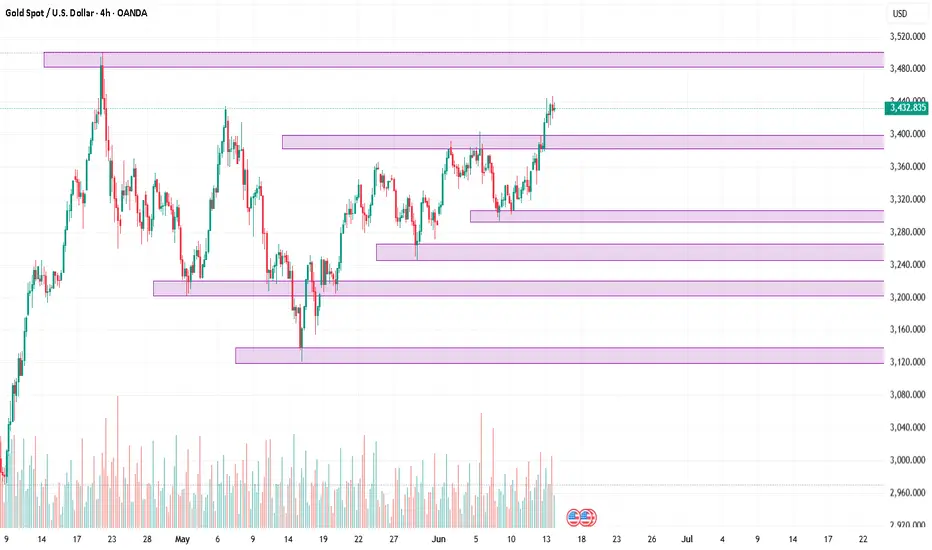
GOLD 4H CHART ROUTE MAP UPDATE & TRADING PLAN FOR THE WEEKHey Everyone,
This is an update from last weeks 4H chart route map, as levels are still valid and playing out as analysed. I have only updated the swing ranges accordingly.
3376 and 3438 was hit perfectly last week with ema5 cross and lock confirmation. We are now looking for ema5 cross and lock above 3438 for a continuation into 3498. Failure to lock above will follow with a rejection into the lower Goldturns for support and bounce inline with our plans to buy dips.
We will see levels tested side by side until one of the weighted levels break and lock to confirm direction for the next range.
We will keep the above in mind when taking buys from dips. Our updated levels and weighted levels will allow us to track the movement down and then catch bounces up.
We will continue to buy dips using our support levels taking 20 to 40 pips. As stated before each of our level structures give 20 to 40 pip bounces, which is enough for a nice entry and exit. If you back test the levels we shared every week for the past 24 months, you can see how effectively they were used to trade with or against short/mid term swings and trends.
The swing range give bigger bounces then our weighted levels that's the difference between weighted levels and swing ranges.
BULLISH TARGET
3376 - DONE
EMA5 CROSS AND LOCK ABOVE 3376 WILL OPEN THE FOLLOWING BULLISH TARGETS
3438 - DONE
EMA5 CROSS AND LOCK ABOVE 3438 WILL OPEN THE FOLLOWING BULLISH TARGET
3498
EMA5 CROSS AND LOCK ABOVE 3498 WILL OPEN THE FOLLOWING BULLISH TARGET
3551
BEARISH TARGETS
3302
EMA5 CROSS AND LOCK BELOW 3302 WILL OPEN THE FOLLOWING BEARISH TARGET
3235
EMA5 CROSS AND LOCK BELOW 3235 WILL OPEN THE SWING RANGE
3171
3113
EMA5 CROSS AND LOCK BELOW 3113 WILL OPEN THE SECONDARY SWING RANGE
3045
2987
As always, we will keep you all updated with regular updates throughout the week and how we manage the active ideas and setups. Thank you all for your likes, comments and follows, we really appreciate it!
Mr Gold
GoldViewFX

GOLD DAILY CHART ROUTE MAPHey Everyone,
Following up on our previous analysis, price action has continued to respect our Goldturn channel beautifully. After the strong move to 3272, we saw another push toward the channel top near 3433. This time, the ascending movement to the channel top was completed perfectly, hitting inline with our 3433 axis target.
The key takeaway here is that the channel levels are being respected with precision, validating the strength and reliability of our Goldturn channel framework. 3272 continues to provide solid support, and price remains well-contained within our defined range, reaffirming our strategy of buying dips near the lower end rather than chasing strength at the top.
We will now look for a break above the channel and then support to form above the channel top to confirm a continuation higher. However, failure to lock above the channel will likely result in a rejection back into the range, reinforcing the significance of these key levels.
We remain focused on trading within this structure, using our weighted Goldturns to guide entries on the lower timeframes (1H and 4H). As long as the range remains intact, we’ll continue to target quick 30–40 pip intraday moves while keeping an eye out for a breakout setup.
This is the beauty of our Goldturn channels, drawn using weighted averages rather than pure price action. This method helps us filter out noise and stay on the right side of the market, avoiding common traps.
Keep a close eye on how price behaves around 3272 and 3433. A clean break and sustained hold above the channel top could shift the game, but until that happens, we stick to the range plan.
Let’s stay patient and disciplined.
Mr Gold
GoldViewFX

GOLD WEEKLY CHART MID/LONG TERM ROUTE MAPHey Everyone,
Following up on last week’s chart update, we saw another perfect test of the channel top, right in line with our Goldturn Channel expectations. The new weekly candle completed the channel top challenge with precision.
Our weekly chart idea is now playing out perfectly. We continued to get strong support above 3281, followed by another hit onto the 3387 channel top. But this time, we got something new: a body close above 3387, which confirms the gap to 3482 as active. We’ll now look for that 3482 target to be hit, ascending inline with the channel top.
Any rejection around these upper levels will likely see price retrace to find support at lower Goldturn levels. These are opportunities we’ll be watching closely to buy back in.
Price action remains well-contained between 3281 and 3387, but with that recent close above 3387, we’re now shifting focus toward higher expansion. The structure is rising, and the channel is guiding price beautifully, offering more room for smart, calculated positioning.
As long as we hold above the half-line and especially above 3281, we stay in buy-the-dip mode, favouring long setups from intraday Goldturn zones for quick 20–40 pip scalps or more extended swing entries when structure permits.
Should we see a failure to maintain above 3387 or a close back below 3281, we’ll reassess potential movement toward the lower channel boundary. Until then, the structure remains bullish within the channel and price is following our path perfectly.
The Goldturn methodology continues to prove its worth, cutting through noise, filtering out the fake outs, and keeping us on the right side of the market.
Stay sharp, stay patient.
MR GOLD
GOLDVIEWFX

GOLD/USD Bullish Breakout PotentialGOLD/USD Bullish Breakout Potential 🚀📈
🔍 Chart Analysis (June 15, 2025):
The GOLD/USD price action shows strong bullish momentum after a successful breakout above the previous resistance zone (now turned support) around $3,400. This level had previously acted as a key resistance multiple times (evidenced by the price rejection in early June), but has now been flipped into a support zone. The chart highlights two major elements:
📌 Key Highlights:
✅ Support Zone:
The $3,390–$3,410 range is now a confirmed support area after price broke above and retested it. This zone was previously tested multiple times (marked by arrows) and is expected to act as a launchpad for further upside.
🎯 Target Point:
The projected bullish target lies in the $3,610–$3,640 range. This level has been highlighted as a potential area where price might face resistance again.
📈 Bullish Projection:
A bullish continuation is expected if the price remains above the $3,400 level. The chart suggests a possible pullback to support before continuation towards the target zone.
⚠️ Technical Outlook:
As long as price holds above support, the bias remains bullish.
A drop below $3,390 would invalidate this bullish scenario and call for reassessment.
Conservative entry may wait for a confirmed bounce from support.
🔮 Summary:
Bullish bias is active for GOLD/USD with a short-term target around $3,620. Watch the $3,400 support closely for confirmation of the upward momentum.

Analysis of gold price trend next week!Market news:
Weak U.S. inflation data released earlier this week reinforced expectations that the Federal Reserve will cut interest rates, increasing the appeal of spot gold. It hit a two-month high. The geopolitical tension in the Middle East has caused investors to flock to safe-haven assets. Earlier, Israel's air strikes on Iran have once again raised concerns about a wider conflict in the Middle East. In terms of physical gold, demand in major Asian centers weakened this week due to a sharp rise in prices, and the Indian gold price broke through the important psychological level of 100,000 rupees. As geopolitical tensions in the Middle East intensified over the weekend, gold prices may continue to benefit from risk aversion next week, and London gold prices are expected to target $3,500/ounce at the beginning of next week! Next week will also be affected by the Fed's decision and Powell's speech. In addition, U.S. President Trump will visit Canada from June 15 to 17 to attend the G7 Leaders' Summit. His speech at that time may also affect the fluctuation of international gold prices, which is worth paying attention to.
Technical Review:
From the market point of view, the overall bottoming and rebounding trend of gold this week has undoubtedly laid a strong foundation for buying. It is understandable to follow the trend and rise. However, since the gold price fell back at the end of the week and closed near 3433, I think it is necessary to make a short-term decline judgment on the market trend at the beginning of the week. As the gold price continues to rise, various graphics have formed very obvious and strong support, among which the 3419 line and the 3400 mark shown by the upper track of the daily Bollinger Band are the most important. Once the gold price can stabilize above this area today, the daily support will definitely continue to rise, which will also lay a more favorable foundation for buying to steadily hit new highs. Combined with the risk aversion demand caused by risk events, it is not an exaggeration to expect the gold price to approach the 3500 mark next week! But if the short-term reversal is sold, the 3400 mark is taken, and the daily MACD indicator forms a dead cross green column and continues to increase in volume, then the possibility of selling down to the daily 5-day moving average will be increased. However, whether this possibility can be realized needs to be judged in combination with more factors. After all, the overall trend of gold is still rising. If the adjustment is too strong, it will not only break the trend, but also cause the gold price to fall into a weak trend below 3400 in the short or medium term.
Next week's analysis:
Gold rose again on Friday under the stimulation of risk aversion. Gold was directly bought at 3413 on Friday, and the circle of friends also directly prompted to buy. Gold rose and harvested as expected. Gold has been shrouded in risk aversion in the Middle East these two days. In the short term, the trend of gold is still supported by risk aversion, and it may go up a level. If risk aversion is not relieved at the weekend, it will continue to buy next week. At present, the risk aversion sentiment of gold is constantly escalating, and buying is also strong and irresistible. So before there is a significant change, it is to continue to buy to the end, and the rise is not a top, and go with the trend. Gold's 1-hour moving average is still a golden cross with upward buying divergence, and the buying power of gold is still there! After the rise of gold's safe-haven, gold adjusted sideways in the short term, but it is still oscillating strongly at a high level. Now it is still in the process of rising. If there is no bad news to make gold fall and break, then the short-term volatility of gold is an adjustment in the process of rising, and it will continue to rise at any time. After gold buying breaks through 3400, gold buying sticks to the 3400 line, so if it falls back to 3400 next week, it will continue to buy on dips. If the risk aversion of gold eases and falls below 3400, then we may readjust our thinking.
Operation ideas:
Buy short-term gold at 3405-3408, stop loss at 3396, target at 3450-3470;
Sell short-term gold at 3457-3460, stop loss at 3469, target at 3420-3400;
Key points:
First support level: 3422, second support level: 3405, third support level: 3390
First resistance level: 3446, second resistance level: 3458, third resistance level: 3472

Adjustment over? Uptrend coming?Information summary:
A new round of air strikes by Israel against Iran on Friday has significantly escalated the conflict in the Middle East. Investors have quickly poured into traditional safe-haven assets such as gold, U.S. Treasuries and the Japanese yen. The market's current first choice for hedging geopolitical risks is gold, not the U.S. dollar. The U.S. dollar index rebounded slightly this week, but it has not become the main target of safe-haven fund flows, and gold has dominated the flow of safe-haven funds.
Although risk aversion has become the main theme of the gold market this week, the Fed's policy trends are still the core variable affecting the long-term direction of gold prices. In this week's FOMC meeting, the Fed kept interest rates unchanged and hinted that it may only cut interest rates once this year. But Powell also pointed out that future policies will still depend on data, leaving speculation about reversals.
Market traders generally believe that if the future inflation data falls more than expected or the job market slows down, the Fed's stance may turn dovish again, and gold prices may therefore gain new upward momentum.
Trend analysis for next week:
The weekly bullish trend extends, and there is still a lot of room for growth. After a round of decline last week, the weekly line closed this week again in a very strong position, and the daily rising trend channel resumed its operation. From the market alone, the gold price trend has been stabilizing above the middle track, and the bulls continued to line up at the opening of Monday. From the indicators, the middle track has been extending upward. Since May, the price has continued to create highs in the rising channel and has a tendency to challenge the historical high position of 3500, indicating that there is still room for upward movement in the short term.
From the 1-hour chart, the price rose to 3447 and then made a short-term correction to 3420, and the correction has been sufficient. 3420-3415 forms the most important support area. If this position is touched, it is an opportunity for long trading; but the price may not fall back to the support line and rise directly. Before breaking the important neckline, no short strategy will be adopted at the beginning of next week. We can patiently wait for the opportunity to go long after the correction.
Operation strategy:
Buy at 3415-3420, stop loss at 3410, profit range at 3450-3455.

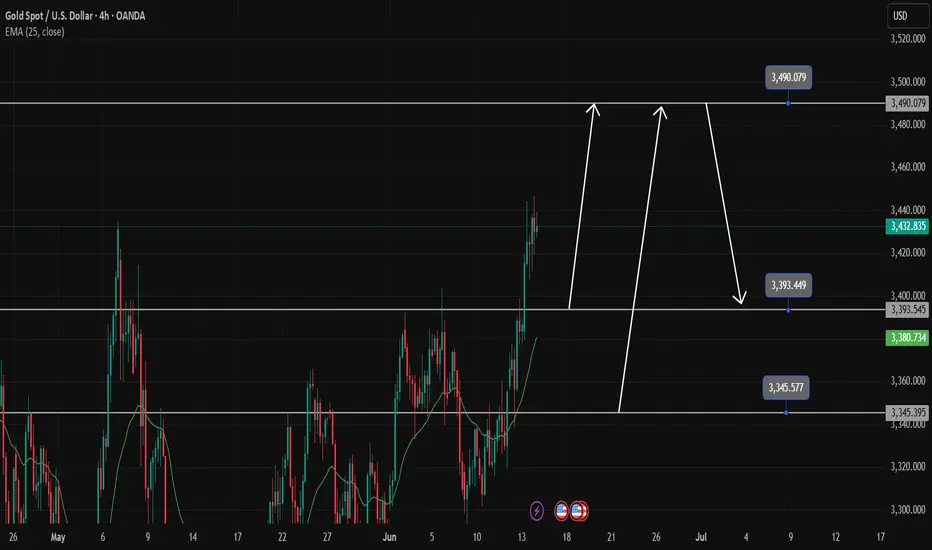
Gold price is sure to make ATH in the new weekGold confirms a long-term uptrend. The ATH 3500 zone is likely to have a reaction before 3490.
Any pullback in Gold next week is still considered a good opportunity to Buy Gold. And the bullish price gap is likely to continue on Monday.
3495 and 3345 are accumulated with many people waiting to Buy there, setting up a Buy signal with SL 10 price at the weekly support and resistance zones.
The possibility of breaking ATH next week is very high
Support 3393-3345
Resistance 3490
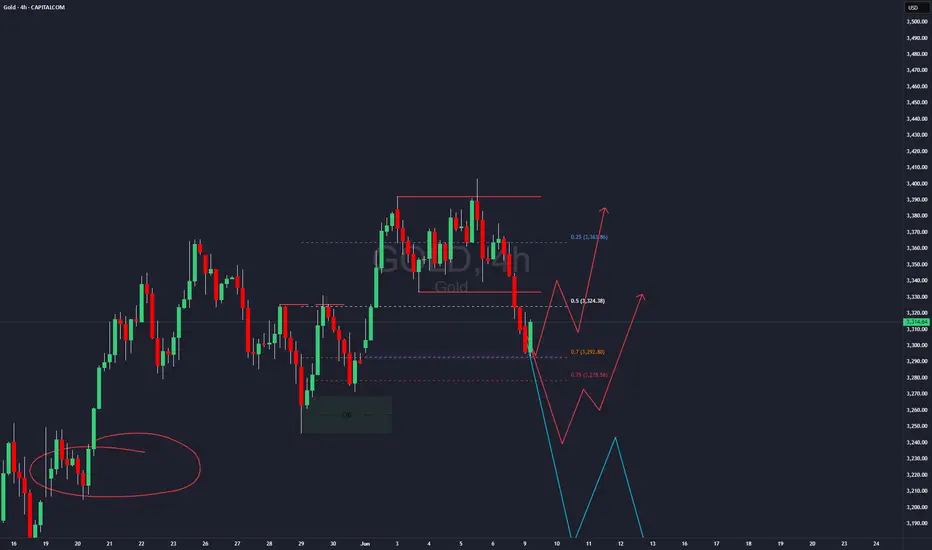
4-Hour Analysis for XAUUSD (14 June 2025)4-Hour Analysis: The Bigger Picture
Price Action & Market Structure
Current price is at $3432.835.
The market has printed a higher high above the previous swing at ~$3425.
Last Break of Structure (BOS): Occurred to the upside at ~$3412.
Recent CHoCH (Change of Character): None yet to the downside—bullish structure still intact.
Conclusion: Bullish Market Structure is dominant.
Fibonacci Levels
Measured from the swing low at $3362 to the recent swing high at $3437:
38.2% retracement: ~$3410
50% retracement: ~$3399
61.8% retracement: ~$3388
These are our retracement zones where demand is likely to step in.
Smart Money Key Concepts
Imbalance: Clean imbalance exists between $3408–$3415.
Bullish Order Block (OB): 4H candle at $3394–$3402
Liquidity Grab: Sweep below $3411 (old low) before reversal signals smart money accumulation.
Premium/Discount Zone: Current price is above 50% of last impulse → In premium zone (better to look for sells here until retracement).
Key Zones (Interaction Points)
Buy Zone Cluster (Discount Price)
Zone A (OB + 61.8% + Liquidity Pool) → $3385–$3402
Zone B (Imbalance + Fib 50%) → $3408–$3415
Sell Zone Cluster (Premium Price) – for retracements
Zone C (Last Supply + Swing Highs) → $3437–$3445
Zone D (Rejection Block + Liquidity Above) → $3455–$3462
4-Hour Bias: Bullish
We are in a bullish continuation phase. Ideal trades are buys from demand zones, aiming for new highs or liquidity sweeps above swing points.
Zoom-In: 1-Hour Chart – Trade Setups
Setup 1: Buy from Demand + OB Reaction
Entry Zone: $3394–$3402
Direction: Buy
Stop-Loss: $3384
Take Profit 1: $3430
Take Profit 2: $3445
Trigger Condition: Bullish engulfing or bullish BOS on 15-min chart after liquidity grab into the zone.
Reason: Overlap of OB, 61.8% fib, and clean liquidity pool below $3400.
Setup 2: Buy from Imbalance Tap
Entry Zone: $3408–$3415
Direction: Buy
Stop-Loss: $3398
Take Profit 1: $3432
Take Profit 2: $3440
Trigger Condition: CHoCH on 15m with FVG fill (imbalance closes with bullish follow-through).
Reason: Bullish continuation with low-risk entry within imbalance zone and close to 50% fib retracement.
Setup 3: Short from Supply Zone for Retracement
Entry Zone: $3455–$3462
Direction: Sell
Stop-Loss: $3472
Take Profit 1: $3432
Take Profit 2: $3415
Trigger Condition: Bearish engulfing or 1H CHoCH inside the zone.
Reason: Price likely to grab liquidity above highs before retracing; this is a countertrend scalp within premium pricing.
Final Takeaway:
“Stay bullish on Gold while it’s above $3394—but let price correct into demand before looking to join the trend.”