Gold (XAU/USD) Intraday Outlook – 12 June 2025Current Price: ~$3,373 (intraday) –
Gold is holding near recent highs after a sharp rally. Bullish momentum has improved markedly, fueled in part by favorable fundamentals (soft US CPI and geopolitical tensions lifting safe-haven demand)
On the charts, the short-term trend is upward, with buyers firmly in control following a breakout above prior resistance.
4H Trend & Key Levels
4H chart highlighting break of structure, demand (green) and supply (red) zones, and key intraday levels. Note the major demand zone that held around 3,214 (green) and the supply zone near 3,284 (red) which was a focal resistance. The 50% retracement of the prior day’s range (blue line near 3,274) acted as intraday resistance in that earlier session
Such annotations show where institutional activity likely set support (demand) and resistance (supply) areas. On the 4-hour chart, gold’s momentum is strongly bullish. The recent surge to 3375 pushed price above its 10-day moving average and widened the upper Bollinger Bands on both H1 and H4 – signs of a powerful uptrend. This came after gold cleared a major resistance around the $3,350 zone, which had capped prices earlier. With that barrier broken, the next upside target on the higher time frame is the $3,400 level (a notable psychological and technical hurdle)
In fact, it can be projected that a clean breakout above the ~3,380/3,390 zone could open the path toward $3,403 and even $3,430 in extension
Reflecting the next supply areas or Fibonacci extension targets above. Support levels on the 4H are stepping up as the trend rises. Previously, $3,320 (the last day’s high in late May) turned from resistance into support after the breakout. Now, immediate support is seen around $3,345–3,350, which corresponds to the top of the recent consolidation and roughly the 38.2% Fibonacci retracement of this week’s rally
Below that, the $3,330–3,335 zone (around the 61.8% retracement of the rally) is a secondary intraday support area
These levels also align with prior demand zones and the previous day’s lows, making them likely zones where buyers might step in on dips. Overall, as long as gold holds above the mid-$3,300s, the 4H bias remains bullish. The 4H structure shows higher highs and higher lows, and technical signals (price above short-term EMAs and an improving RSI) reinforce the short-term bullish outlook
Educational Note: In an uptrend, old resistance often becomes new support. Here $3,350 was a major resistance in the past and could serve as support if prices pull back. Traders also watch Fibonacci retracement levels within the up-move for potential bounce points – for gold, the 35-50% retracement zone of the latest swing (approximately $3,350 down to $3,330) is viewed as an attractive “buy-the-dip” area intraday.
On the 1-hour chart, gold has been oscillating upward within a rising channel. After each push higher, it has formed brief consolidations or bull flags that resolved to the upside.
For example, after the strong push to ~3375, price coiled in a classic bull flag pattern, hinting at momentum building for another breakout. This pattern of consolidation after a rally shows healthy bullish behavior – buyers pausing before continuing the move. Higher lows (HL) and higher highs (HH) are clearly present, indicating a steady uptrend structure on the 1H
In fact, gold’s price action has been “taking out liquidity then taking out highs and creating new highs,” leaving no sign of bear control so far. This means each time the price dips and grabs some stop-loss liquidity from weak longs, it quickly reverses and surges to a fresh peak – a hallmark of a strong trend supported by larger players. From an SMC perspective, we can spot where institutional traders may be active. Recently, gold retested a major demand zone in the low $3,300s and rocketed higher. Specifically, price dipped to about $3,297 (just below a prior support), which appears to have been a liquidity grab (fake-out) below the obvious support level
Smart money often drives price briefly below such a level to trigger stop-losses, then buys into that liquidity. Indeed, a strong bullish rejection off $3,297-3,300 occurred, indicating aggressive buying (accumulation) by big players at that historical support
This confirmed a solid demand zone, and bulls defended it vigorously – a clear sign that institutional demand underpins that area. After the fake-out and bounce, gold quickly resumed making higher lows, confirming the uptrend’s resumption. Now, the focus shifts to the overhead supply zone. Gold is trading just below $3,380–3,390, a zone that previously acted as major intraday resistance.
In past attempts, price sharply sold off from this area, suggesting it’s a pocket of supply (sell orders) or profit-taking for institutions. This makes $3,380-$3,390 a key decision point: if bullish momentum is strong enough to drive a clean break through this supply, we could see a swift move higher (as mentioned, targets in the low $3,400s become viable)
However, if gold struggles and prints bearish signals (e.g. aggressive wick rejections or a change in character to lower lows on 15m/1H) near 3380-3390, it may indicate that sellers are defending this zone again, potentially causing a pullback. Traders are watching closely to see if smart money will cap the price here or let it run. It’s worth noting that intraday liquidity has built up around certain levels. Minor equal highs around $3,375-3,377 were taken out earlier (as gold hit a weekly high of ~$3,377) ,and now liquidity might reside just above $3,390 (at buy stops of breakout traders) and below $3,340 (sell stops of longs). The path of least resistance intraday appears upward unless those lower support levels start breaking. As long as gold remains inside this rising structure, the bias is to buy dips rather than sell rallies. Only a clear break below the $3,337–3,340 support (recent range floor) would hint at a short-term trend shift down. Until then, bulls are in charge. Educational Note: Order blocks and supply/demand zones are areas where price saw a sharp move, indicating institutional orders. In gold’s case, an H1 demand block near $3,300 (origin of the recent rally) is such an area – price dipped into it and then launched higher
Conversely, the $3,380-$3,390 area is a supply zone from which price fell previously.
Watching price behavior at these zones (e.g. strong rejection vs. breakthrough) gives clues: a heavy rejection implies continued range or reversal, while a breakthrough suggests a new leg of trend.
Trade Setups
Buy on Dip (Bullish Setup):
If gold retraces into the $3,345–3,355 support zone, consider a long entry near ~$3,350 (a key Fibonacci support & prior breakout level)
A suggested stop-loss is just below $3,335 (to stay under the 61.8% retracement and recent swing low). Target the $3,375 area for partial profits, and $3,385–3,390 if momentum continues. This buy-on-dips approach aligns with the prevailing uptrend – as one analyst noted, “Gold below 3350 is an opportunity to buy on dips”
(Rationale: You’re buying at support in an uptrend, aiming for a retest of the highs.)
Sell Near Resistance (Bearish Setup):
If gold rallies toward the $3,390–3,400 zone but shows rejection (stalling candles or a bearish reversal pattern) at that resistance, one can consider a short entry around ~$3,395. Place a tight stop-loss above $3,405 (just beyond the major resistance). Target a pullback to about $3,370 first, and $3,350 on an extended drop. This trade fades a possible near-term top in case the supply zone holds. For instance, a suggested plan from another analyst was to “sell around 3397–3400” with stops above 3409, looking for a move back to the mid-$3,300s
(Rationale: You’re selling at an identified supply zone, expecting a short-term correction.)
Breakout Scenario:
For traders who prefer momentum plays, watch $3,380 on the upside and $3,340 on the downside. A 1H candle close beyond $3,380 with strong volume would confirm a breakout – you could then target ~$3,405 and above (trail stops as it goes)
Conversely, a drop below $3,340 might signal a bearish intraday reversal, opening downside targets near $3,315 and $3,300
If trading the breakout, ensure confirmation (no fake-outs) – wait for a retest if possible, and then ride the move. (This scenario is only for when price definitively exits the current range.)
Remember: The intraday trend is bullish, so lean toward long setups unless key supports break. Keep it simple – trade the price action you see. Gold can be volatile, so it's wise to use stop losses and not over-leverage. Happy trading! 📈✨
Goldprediction

Iran hardens steel, gold rises!
📣Gold news
On Thursday (June 12, 00:00 in the Asian morning, spot gold continued to rise, reaching a high of $3,377 so far, a new high this week. The lower-than-expected US CPI data in May increased the possibility of the Federal Reserve's interest rate cut in September, and the trend of the US dollar and the decline in US bond yields provided a favorable environment for gold prices. At the same time, tensions in the Middle East escalated on Wednesday, and Iran said it would attack US military bases in the Middle East if negotiations broke down. The sharp rise in geopolitical tensions in the Middle East has significantly increased the safe-haven demand for gold. Although the conclusion of the US-China trade agreement has eased some market pressure, the potential impact of tariff policies on inflation still needs to be vigilant. Looking ahead, investors need to pay close attention to Thursday's PPI data and the Fed's policy trends, while keeping an eye on the situation in the Middle East. Driven by risk aversion and expectations of loose monetary policy, the gold market still has room for upside in the short term.
📣Technical side:
Yesterday's CPI data was bullish. After a brief surge, it fell back to below 3330, and then fluctuated. The rise was not strong. Late at night, Trump again called on the Federal Reserve to cut interest rates by 100 basis points. Confidence in the Iran nuclear negotiations decreased. In the next one to two weeks, he will send a letter to trading partners to set unilateral tariffs. Uncertain risks increased. Gold rose in contact with the CPI data. In the short term, the price broke through the 3348-3353 suppression. Consider going low around this position during the day, looking at the 3383-89 suppression, stop loss 3337, pay attention to risks.
💰Strategy Package
Today's trading strategy: long around 3349. Stop loss 3337, take profit 3383
Short around 3370, stop loss 3374, take profit 3350
Trend value trading is the only way for all investors to make profits. There is no shortcut, and don't be lucky. Any investor needs to go through the process of loss, capital preservation, and profit from the beginning of entering the market. The market is definitely not a long-term paradise for speculators. A successful speculation does not mean that it can be successful from beginning to end. Only stable and continuous profits can make a person successful. There must be rules here. If you don't break the rules, you won't be eliminated.

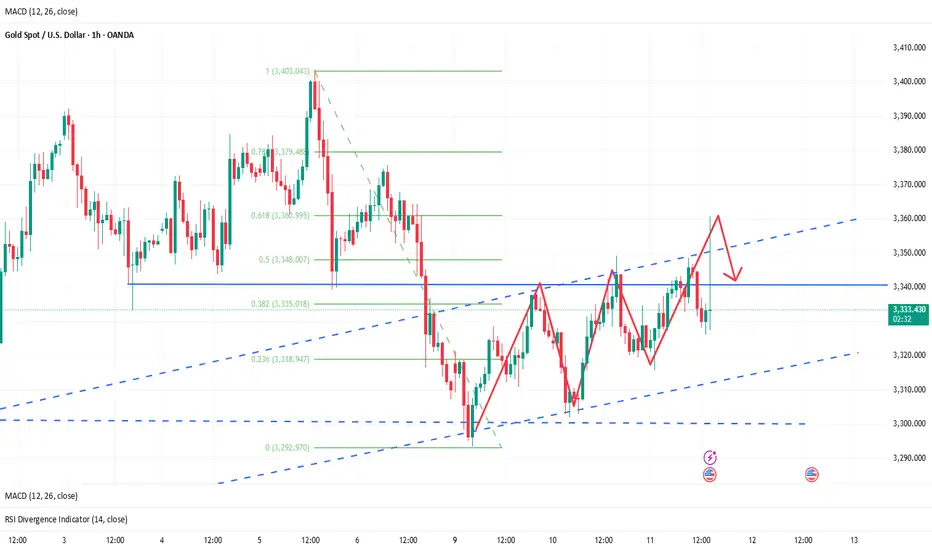
XAUUSD analysis - potential for pullback and continuationOANDA:XAUUSD is currently consolidating near $3,310 after a decisive breakdown below the ascending trendline, signaling a shift in the short-term structure from bullish to bearish. This breakdown was accompanied by strong bearish momentum, indicating that buyers have temporarily lost control of the market.
After the initial drop, the price is now attempting to retrace toward the 0.5–0.618 Fibonacci zone, with the 0.618 level located around $3,335. This zone also coincides with dynamic resistance from short-term moving averages (EMA cluster), making it an important confluence area. A rejection from this level would confirm a bearish retest, supporting the idea of a continuation toward the 1.618 Fibonacci extension near the $3,225 level.
However, if the price breaks and holds above $3,348, the bearish scenario will be invalidated, potentially signaling that buyers are regaining strength and may aim to reclaim higher resistance levels.
Traders are advised to wait for confirmation, such as a bearish engulfing candle, rejection wicks, or a surge in volume, before entering short positions. As always, this is a personal viewpoint, not financial advice. Trade with appropriate risk management.

Beware of the bull trap in gold.
📊Technical aspects
Gold fell to 3330 and then began to rebound. After the release of the US CPI data, gold rose rapidly. This is the time to test human nature and the true understanding of the market.
Is it the bulls coming or the positives being realized and the market continues to fall? Then many people may see the big rise and start chasing the rise, and then the market will once again make a big reversal as if it is a joke.
After the release of the US CPI data, gold continued to short at 3360-65. Gold fell as expected. Gold fell as it went up. This shows that the above section was a market that lured more buyers. The rebound will continue to be mainly short.
Since gold is now tempting to buy, it means that the main trend of gold is still short, so the rebound will continue to be short.
Gold closed with a long upper shadow in 1 hour, so gold is still a strong resistance area above 3350. The upper shadow just happened to surge upward with the help of data, which is the so-called false breakthrough. Gold rebounded to 3350-60 in the US market and continued to be short.
💰 Strategy Package
This is the charm of the market. Some people are always wavering between ups and downs, while others can always grasp the turning points. However, the prerequisite is to be able to see the trend clearly and follow the trend.
Short Position:3365-3370,3370-3380

XAU/USD(20250612) Today's AnalysisMarket news:
① The EU hopes that the trade negotiations will be extended beyond the suspension period set by Trump. ② Bessant: As long as "sincerity" is shown in the negotiations, the Trump administration is willing to extend the current 90-day tariff suspension period beyond July 9. ③ Trump will hold multiple bilateral talks during the G7 summit. ④ The total customs revenue of the United States in May reached a record high of US$23 billion, an increase of nearly four times year-on-year. ⑤ Lutnick: One deal after another will be reached.
Technical analysis:
Today's buying and selling boundaries:
3343
Support and resistance levels:
3388
3371
3360
3326
3315
3298
Trading strategy:
If the price breaks through 3371, consider buying in, and the first target price is 3388
If the price breaks through 3360, consider selling in, and the first target price is 3343

GOLD - at support ? What's next??#GOLD... perfect bounce as per our discussion.
Now market have 3360-61 as immediate supporting area.
Keep close and if market hold it in that case we can expect further push to upside.
Good luck .trade wisley

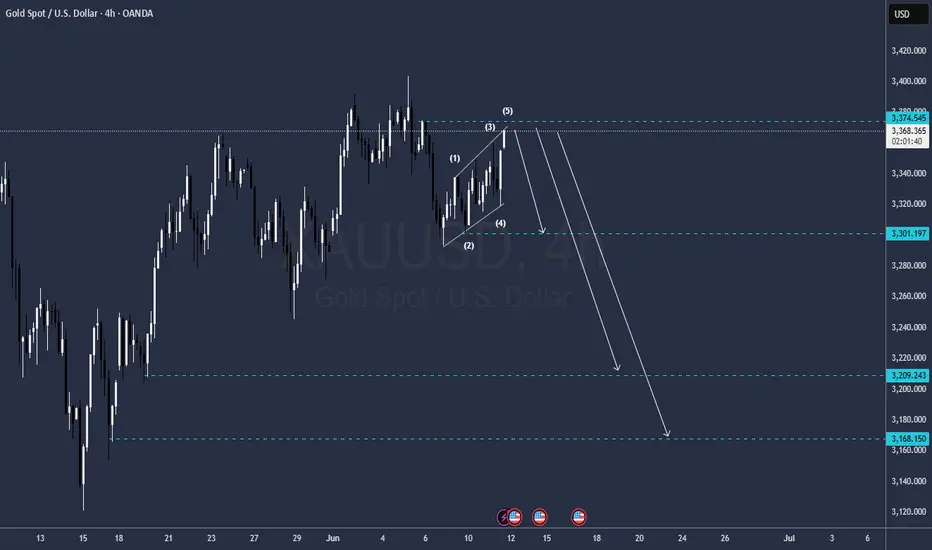
GOLD Short ScenarioHmm the way it is going up looks like a Diagonal so the fall should come
selling level 3375
targets in the chart
gg
How to arrange the gold price in the evening? Go long at 3330📰 Impact of news:
1. CPI data is profitable
2. The US CPI rose slightly in May, and Trump's tariff effect has not yet fully emerged
📈 Market analysis:
The trend line position of the 4H chart coincides and resonates with the middle track of the Bollinger Band, with 3326 as the watershed reference. This is why it is difficult to break below this point after repeated tests. Once it breaks below, the short-term trend is likely to fluctuate from strong to weak. However, the current support below is still strong at 3330-3326. The repeated rise and fall of data during the day also stopped the decline at this point. If the price does not lose here, the pattern of strong fluctuations will remain unchanged, and the bulls will gradually regain lost ground. At present, it is time for space. The operation suggestion for the future market is to continue to rely on the bullish trend above 3330, and 3330-3326 can be flexibly entered. At the same time, the RSI indicator is above 50 and there is still some space from the overbought zone. The signal is given that 3360, although the long upper shadow line K is closed, is very likely not the short-term top. After the sharp rise and fall in 1H, it went sideways and waited for the next wave of strength. If the night close is above 3326, the upper area will probably be 3350-3360. If the price can break through and stabilize this level, the upward pace will most likely accelerate to reach 3370-3380.
🏅 Trading strategies:
BUY 3330-3326
TP 3350-3360
If you agree with this view, or have a better idea, please leave a message in the comment area. I look forward to hearing different voices.
OANDA:XAUUSD FX:XAUUSD FOREXCOM:XAUUSD FXOPEN:XAUUSD TVC:GOLD
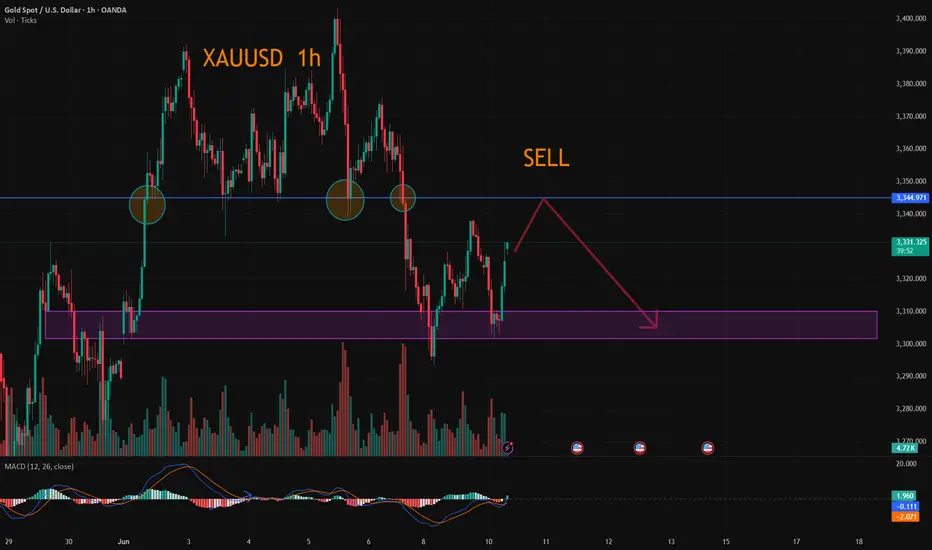
XAUUSD:Take a short position
Gold is currently under pressure around 3345 has been out of the decline, so today or the first short, the follow-up need to pay attention to a wave of decline after the rebound.
The current 3330-32 is also a short point.
Trading Strategy:
SELL@3330-32
TP:3315-10
↓↓↓ More detailed strategies and trading will be notified here ↗↗↗
↓↓↓ Keep updated, come to "get" ↗↗↗

Analysis of the latest gold price trends!Market news:
In the early Asian session on Wednesday (June 11), spot gold fluctuated in a narrow range and is currently trading at $3,330 per ounce. London gold prices rose and fell on Tuesday as the conflict between Russia and Ukraine continued and the World Bank also lowered its global economic growth forecast. Traders are closely watching the Sino-US trade negotiations, the results of which may ease trade tensions and boost the global economy, thereby reducing the demand for safe-haven assets, while the continued rise in US stocks has also suppressed the safe-haven buying demand for international gold.In the past few days, gold has fallen from its recent highs, mainly because the market has optimistic expectations for negotiations between China and the United States and Britain and Russia. If the United States and China reach a trade agreement, it will weaken the attractiveness of gold as a safe-haven asset. Gold is a hedge investment tool and usually rises during periods of geopolitical and economic uncertainty. The market is currently focusing on the upcoming US CPI data for May. Expected data show that inflation may rise slightly to 2.5%, with core CPI around 2.9%. If the data exceeds expectations, it may be bearish for gold in the short term; if inflation slows down, it will strengthen the market's expectations for the Fed to cut interest rates this year, which is bullish for gold prices.
Technical review:
Technical daily chart continues to close with alternating yin and yang cycles, the moving average is glued together, and the RSI indicator runs on the middle axis. The moving average of the four-hour chart is glued together, the price is adjusted near the middle track of the Bollinger Band, and the RSI indicator is flat. Gold rose above 3349 yesterday and fell back to 3320 in the early morning. After a sharp drop to 3315 in the Asian session, it needs to break the low point of 20 in the early morning and then quickly rise to 3331. Pay attention to the 3320 position in the Asian session. If 3320 stabilizes and moves upward, continue to look at the test of 3340/50 during the day. Otherwise, if it loses again or adjusts around 20 during the day, it will be regarded as a weak sell. Pay attention to 3306/3293 below. Gold technical aspects continue to be arranged with a shock idea. Under the premise that there is no news to stimulate the selling, gold continues to maintain low-price buying as the main technical aspect, and high-price selling as the auxiliary.
Today's analysis:
From the daily level, gold is in a high-level shock consolidation since the peak of 3500. The current highs of 3500, 3435, and 3403 are gradually moving down, and the lows of 3120, 3245, and 3293 are gradually rising. The shock range is gradually narrowing. The short-term market may continue to maintain shocks. If it breaks, it needs to wait for the direction of the breakthrough to be stimulated by major news!
So today's lock range is 3293-3360. It is recommended to sell at high prices and buy at low prices to treat shocks, mainly short-term or ultra-short-term, and do not chase ups and downs before the range is effectively broken.
Operation ideas:
Buy short-term gold at 3310-3330, stop loss at 3292, target at 3340-3360;
Sell short-term gold at 3350-3363, stop loss at 3362, target at 3300-3310;
Key points:
First support level: 3320, second support level: 3306, third support level: 3292
First resistance level: 3346, second resistance level: 3358, third resistance level: 3376
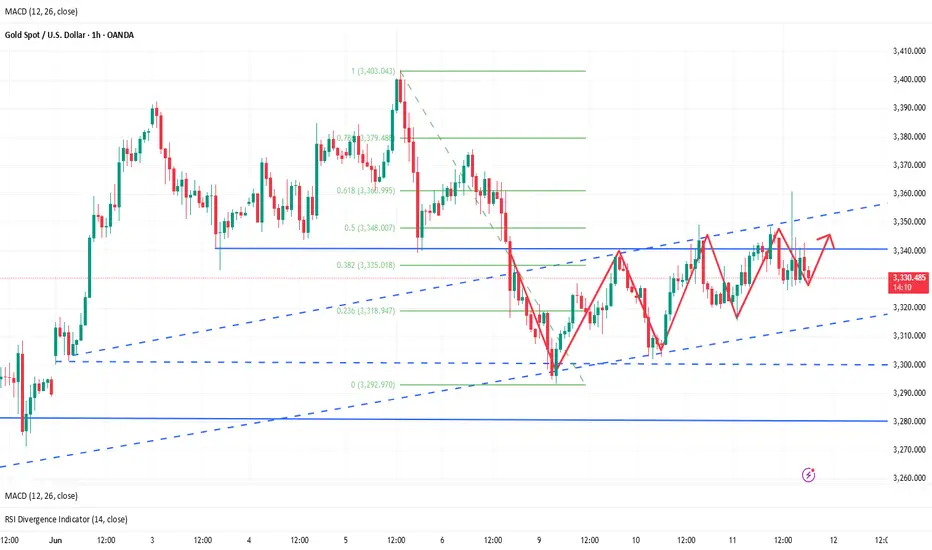
GOLD ROUTE MAP UPDATEHey Everyone,
Another solid day on the charts, with our analysis unfolding exactly as anticipated.
As mentioned yesterday, after the cross and lock above 3318, we identified a gap at 3352 that remained unfilled, acting as a magnet for price action. Since then, price has been consolidating in a tight range between 3318 and 3352.
Today, we saw a perfect move up, completing the target at 3352. From here, we’ll be watching for a confirmed cross and lock above 3352 for a continuation. If price fails to lock above, we could see rejections leading back into the lower Goldturns, where we’ll look for support and bounce.
We will keep the above in mind when taking buys from dips. Our updated levels and weighted levels will allow us to track the movement down and then catch bounces up.
We will continue to buy dips using our support levels taking 20 to 40 pips. As stated before each of our level structures give 20 to 40 pip bounces, which is enough for a nice entry and exit. If you back test the levels we shared every week for the past 24 months, you can see how effectively they were used to trade with or against short/mid term swings and trends.
The swing range give bigger bounces then our weighted levels that's the difference between weighted levels and swing ranges.
BULLISH TARGET
3318 - DONE
EMA5 CROSS AND LOCK ABOVE 3318 WILL OPEN THE FOLLOWING BULLISH TARGETS
3352 - DONE
EMA5 CROSS AND LOCK ABOVE 3352 WILL OPEN THE FOLLOWING BULLISH TARGET
3388
EMA5 CROSS AND LOCK ABOVE 3388 WILL OPEN THE FOLLOWING BULLISH TARGET
3428
EMA5 CROSS AND LOCK ABOVE 3428 WILL OPEN THE FOLLOWING BULLISH TARGET
3478
BEARISH TARGETS
3281
EMA5 CROSS AND LOCK BELOW 3281 WILL OPEN THE FOLLOWING BEARISH TARGET
3254
EMA5 CROSS AND LOCK BELOW 3254 WILL OPEN THE FOLLOWING BEARISH TARGET
3210
EMA5 CROSS AND LOCK BELOW 3210 WILL OPEN THE SWING RANGE
3179
3146
As always, we will keep you all updated with regular updates throughout the week and how we manage the active ideas and setups. Thank you all for your likes, comments and follows, we really appreciate it!
Mr Gold
GoldViewFX

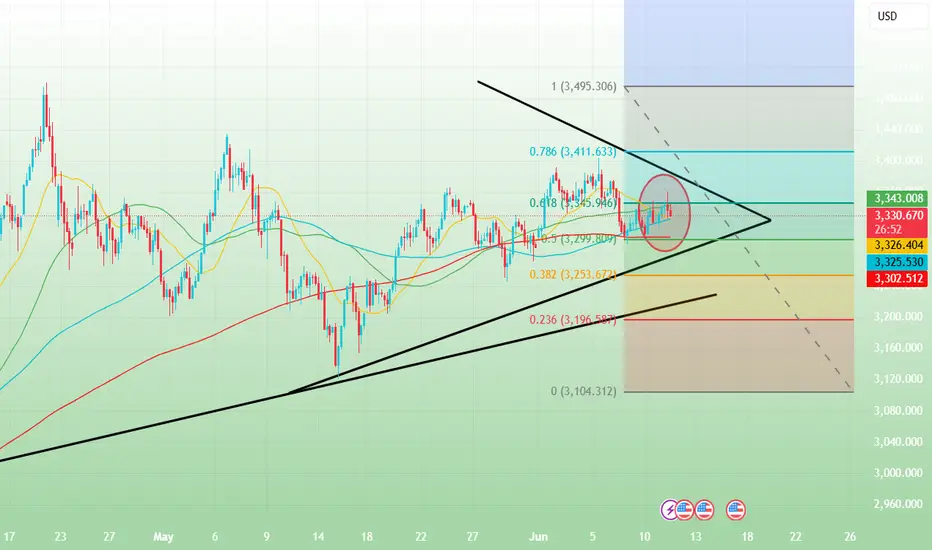
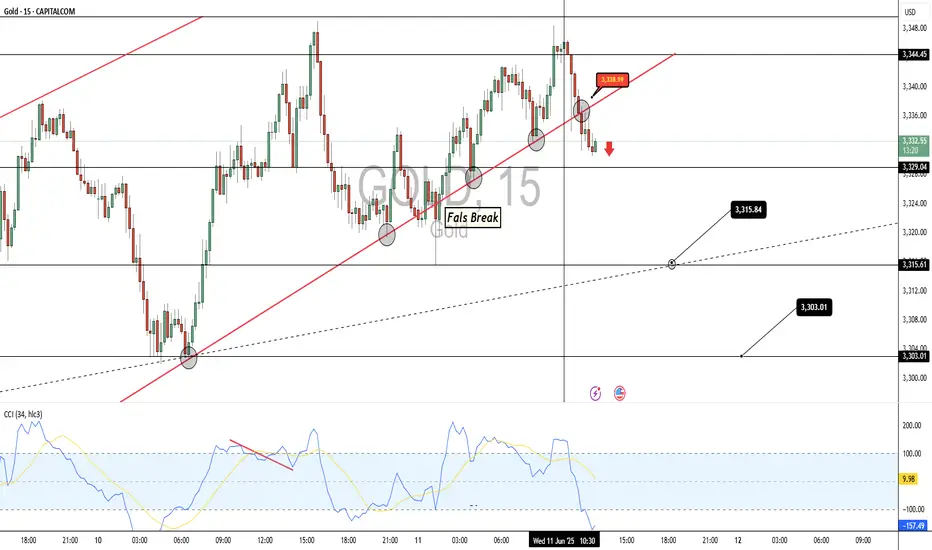
Clear Short opportuniy on Gold According to CCI Under Zero and -100
According to Breakout of Uptrendline
According to Divergence
To double Top ....etc
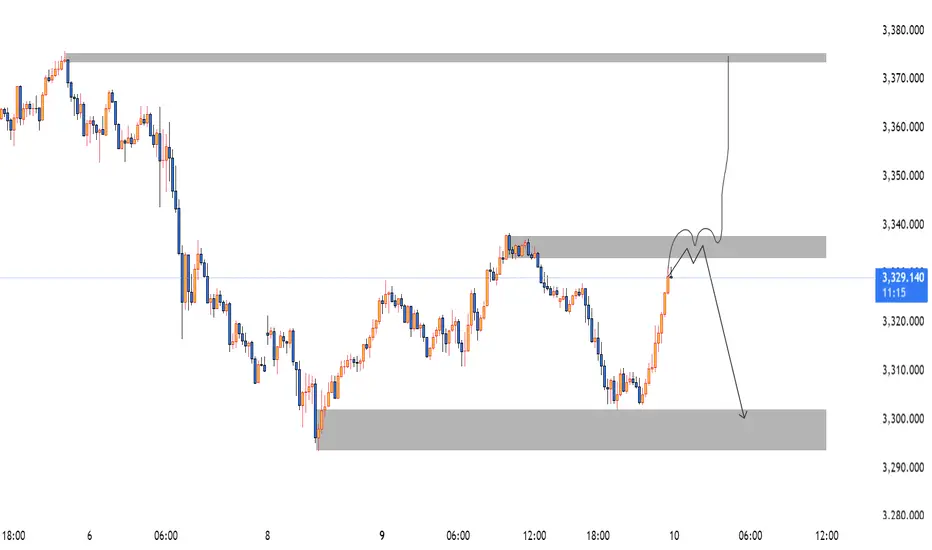
Gold/XAUUSD Move 9th June 2025🔍 XAUUSD Analysis – June 10, 2025
Market Structure:
Market remains in a bearish sequence, with lower highs and lower lows intact on the HTF.
The current bullish leg is corrective, retracing into a well-defined supply zone at 3333–3338.
This zone previously triggered strong selling pressure, marking institutional activity.
Key Supply Zone:
3333–3338: Strong supply zone aligning with previous bearish OB and unmitigated FVG.
Expecting a liquidity grab above intra-day highs, followed by rejection from this zone.
Invalidation Level:
If price closes above 3340 with strength (especially on M15/H1), the bearish bias is invalidated, and we may shift toward the upper supply zone around 3375–3380.
Target Zone:
3295–3305: Strong demand area from which the last impulsive move originated.
Also a logical draw for liquidity resting below prior lows.
💼 Trade Idea:
Type: Sell Limit
Entry Zone: 3333–3338
Stop Loss: Above 3344 (structure break buffer)
Take Profit 1: 3310
Take Profit 2: 3300
Risk-to-Reward: ~1:2+
🧠 Execution Plan:
Wait for price to enter the 3333–3338 supply zone.
Look for LTF confirmations: bearish engulfing, BOS, or CHoCH (M1/M5).
Enter short on confirmation with SL above zone and scale out at each TP level.
The US CPI data is coming soon
💡Message Strategy
During the New York trading session on Tuesday (June 10), spot gold staged a "high diving" trend, with the price of gold falling sharply by about US$30 from its high.
Regarding the Sino-US trade negotiations, US Commerce Secretary Lutnick said on Tuesday that the negotiations were progressing "very, very smoothly." He said he hoped the negotiations could be concluded on Tuesday night, but if necessary, they would continue on Wednesday.
📊Technical aspects
Yesterday's gold trend was still in line with my bearish thinking. In the short term, due to today's CPI data, we remained cautious yesterday and the trend was volatile and bearish. Today's heavy CPI data will break the volatility.
Today's idea is still to follow the trend and be bearish. Pay attention to the support near 3340. If it can still rise to 3350-60 during the day, it will be a good opportunity to open a short position.
If the data performance meets our bearish expectations, gold is likely to generate a profit margin of $100. Always pay attention to trading signals.
💰 Strategy Package
Short Position:3340-3355,3355-3365

How to plan for the positive effects of CPI data?📰 Impact of news:
1. CPI data is profitable
2. The US CPI rose slightly in May, and Trump's tariff effect has not yet fully emerged
📈 Market analysis:
The CPI data is bullish. The current gold price has risen to around 3360. We took profits at the 3330 level and exited the market, which once again confirmed the forward-looking nature of our trading vision. From a technical perspective, the RSI indicator in the short-term hourly chart is close to the overbought area. In the short term, pay attention to the upper resistance line of 3360-3365. If it rebounds to the 61.8% position and encounters resistance and pressure, consider shorting at high levels. On the contrary, if it effectively breaks through and stabilizes above, it is expected to touch the 3400 line. In the short term, pay attention to the lower support line of 3340-3330.
🏅 Trading strategies:
SELL 3360-3365
TP 3340-3330
If you agree with this view, or have a better idea, please leave a message in the comment area. I look forward to hearing different voices.
TVC:GOLD FXOPEN:XAUUSD FOREXCOM:XAUUSD FX:XAUUSD OANDA:XAUUSD
XAU/USD Bullish sign?Current scenario seem , next coming a bullish 3rd leg .Im entering a buy position .Holding till 3350$.
Considering 3340$ as a Resistance area if any reversal sign reflected then exiting there.
Pending orders are still existing in 3369$ so lets see. FX:XAUUSD

Gold CPI data forward-looking layout
📊Technical aspects
Gold trend from the perspective of technical analysis
From the daily technical chart, the gold price has experienced complex fluctuations. Although there have been ups and downs recently, it is still in a relatively high range. In terms of moving averages, short-term moving averages such as the 5-day moving average and the 10-day moving average show a certain entanglement trend, indicating that the short volume is relatively strong in the short term and the short trend is obvious.
From the MACD indicator, its double lines are running below the zero axis. Although the bar chart has shrunk, it still remains in the positive area, suggesting that the bullish force has weakened in the near future, but the overall market is still in a bearish market pattern, and the upward momentum is gradually fading. At present, the RSI value is further downward, indicating that the bearish force will gradually increase.
From the Bollinger Bands indicator, the gold price is currently running below the middle track of the Bollinger Bands, and the Bollinger Bands opening shows a slight narrowing sign. If the price falls below the middle track of the Bollinger Bands and continues to decline, the bearish trend may intensify. If the downward trend accelerates, gold still has a profit momentum of about $100
💰 Strategy Package
Short Position:3330-3340

Gold is in a state of shock again, the market is waiting for CPI📰 Impact of news:
1. May CPI data
📈 Market analysis:
Gold is still fluctuating, and the bulls and bears are currently in a stalemate. The market is waiting for the release of today's CPI data. From the 1H chart, the Bollinger Bands are narrowing, and the gold price is above the 3331 middle track. RSI is stuck at 55, and the MACD golden cross green column is narrowing. For short-term trading, pay attention to the resistance of 3340-3350, and the support of 3320-3310 below.
🏅 Trading strategies:
SELL 3340-3350
TP 3320-3310-3300
BUY 3320-3310
TP 3330-3345
If you agree with this view, or have a better idea, please leave a message in the comment area. I look forward to hearing different voices.
OANDA:XAUUSD FX:XAUUSD FOREXCOM:XAUUSD FXOPEN:XAUUSD TVC:GOLD

Gold fluctuates, awaiting CPI data.In Asian trading on Wednesday, traders are awaiting the release of the latest U.S. Consumer Price Index (CPI) data for May. Estimates suggest that prices are likely to rise as American households feel the impact of tariffs imposed by the Trump administration. But the easing between the world's two largest economies should have an adverse impact on safe-haven assets such as gold, and the lack of a downward trend in gold prices suggests that investors are waiting for more developments.
In terms of short-term trends, the gold 1-hour chart shows that gold prices remain in an upward channel with a low point. So from the trend, the current momentum for gold to rise will be stronger. The price pullback is giving opportunities to go long.
The change of thinking is actually following the trend. For the current operation, enter the market with the trend, and cover the position when it falls back or break through the profit position to cover the position. In a strong market, during the correction phase, the price is rising, and the amplitude of the correction is often small. The bulls retreated at the opening to accumulate momentum. Above is the pressure level of 3350-3360. Once it breaks through and stabilizes, it will accelerate the upward trend. Just follow the general trend of the market.
Operation strategy:
Go long when the price falls back to 3310-3320, stop loss at 3300, and profit range is 3345-3360.

XAUUSD:Wait for a short near 3345
Yesterday's bears around 3330 and the bulls around 3300 tips have been completed, today's rebound strength is slightly stronger, then the subsequent rebound height is expected to be higher;
Trading Strategy:
SELL@3345
TP:3310-3300
↓↓↓ More detailed strategies and trading will be notified here ↗↗↗
↓↓↓ Keep updated, come to "get" ↗↗↗
“Gold Eyes 4‑Hour Demand at $3,322” 11 June 2025Gold (XAU/USD) has consolidated near $3,332 after an SMC-style structure sweep above $3,338, which likely captured institutional liquidity before a clean CHoCH and pullback toward a key demand zone at $3,322–$3,328. This demand zone held firmly—on a bullish 4‑hour candle—indicating underlying strength.
Key technical confluences:
CHoCH above $3,322 confirms bullish structure.
Price above 200‑SMA and mid-Bollinger Band on 4H.
RSI (~55‑60) and MACD showing resumed bullish momentum.
✅ 4H Entry Strategy Breakdown
Bullish Retest
Wait for price to revisit $3,322–$3,328 with bullish candle formation → enter long.
SL just below $3,312; targets at $3,345 and then $3,355.
Breakout Option
If momentum pushes price above $3,353 resistance, follow the breakout with target zones extending to $3,365–$3,380.
Supply Rejection
Alternatively, watch for reversal patterns near $3,345–$3,353. A confirmed rejection opens a short trade down to $3,322.
Scalp Play
For quicker profits, scalp the bounce from the demand zone with tight stops and targets within the 4‑hour upper range.
Risk note: US CPI and trade headlines may inject volatility. Waiting for candle confirmation is critical to validate setups.

GOLD PAY ATTENTION TO BULISHXAUUSD (Gold) Technical Signal ⚠️ | Price action is forming a classic bull flag pattern, showing consolidation after a strong upward move. The flag is starting to 'blush' — early signs of momentum building for a potential breakout. If price breaks above the upper trendline with volume confirmation, we could see a continuation toward higher resistance levels. Traders, keep a close eye – gold may be preparing for its next leg up. #XAUUSD #GoldSignal #BullFlag #TechnicalAnalysis #ForexSignals #GoldBreakout #PriceAction"

ETH HIT THE LIKE TO MANIFEST THISETH/USD is teasing the breakout zone again... 👀
Are we finally ready for liftoff, or is it another fakeout? 🚀🔄
The chart’s looking spicy, and the energy feels right. 🌌
Hit that like to manifest the pump — we’re in this together. 💎🙏
Let’s speak green candles into existence! 📈✨
#ETH #Ethereum #CryptoVibes #ManifestMoneyMoves #ETHUSD #ToTheMoon"
