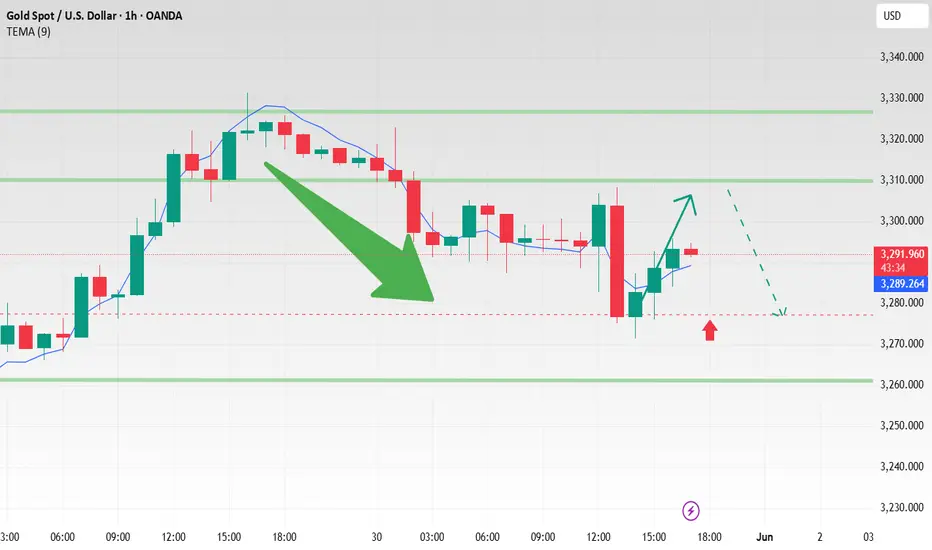
Gold retested as expected, what to do next?
Gold rebounded from 3308 in the US market and fell to 3272. The recent market is good-looking but difficult to do. The long and short positions are repeatedly washed. The monthly line basically closed at the cross star. Under the fierce game between long and short positions, the performance was balanced.
The short-term hourly line is only a single negative line that fell rapidly, and it does not have downward continuity. The high point of the US market rebound is around 3302. If you want to participate, you can go short when it reaches around 3302. As of press time, gold is accumulating strength around 3293. If you step back below, you can rely on the low point for defense.
⭐️ Note: Labaron hopes that traders can properly manage their funds
- Choose the number of lots that matches your funds
- Profit is 4-7% of the fund account
- Stop loss is 1-3% of the fund account
Goldprediction
Trade Idea:XAUUSD SHORT ( SELL STOP )🔍 Multi-Timeframe Analysis
📉 H4:
• Price is compressing below the 20 and 50 SMAs.
• Recent attempts to break higher failed to sustain; MACD is slightly bearish, hinting momentum is fading.
• Consolidation after the big push suggests potential for another leg down if support breaks.
🕒 M15:
• Strong bounce into resistance, now stalling at the underside of the previous structure (~3315–3320).
• 20 SMA is curling down and converging with the 50 SMA, signaling a potential momentum shift.
🕒 M3:
• Price just lost short-term bullish structure after failing to break 3318.
• Flattening and slight downward curl in the 20 SMA.
• Volume shows a slowdown on the bounce and heavier selling earlier in the day — signs of weakness.
⸻
✅ Trade Idea
Type: Sell Stop
Entry: 3308
Stop Loss: 3322
Take Profit: 3273
———
🧠 Why This Setup Works
• This is a momentum breakdown trade: placing a sell stop just below short-term support (3308) to catch the shift in momentum if price breaks lower.
• Price already rejected the high around 3318; if it pushes below 3308, it confirms that sellers have taken back control.
• There’s clean room down to 3273 — a previous reaction zone and recent demand level — offering a good risk-to-reward.
⸻
🛡️ Risk Management & Execution
• SL to BE Rule: Move stop loss to break-even once price reaches 3293 (15 points in your favor, 1R). That’s the halfway point to target and right above a small reaction zone that could cause a pullback.
• Invalidation Window: If price moves above 3325 before activating entry, cancel the trade idea. That would invalidate the lower-high structure and suggest momentum has shifted bullish again.
⸻
⏱️ Session Timing & Considerations
• NY session opens at 6:30 AM Pacific (PT).
• Ideally, this trade should activate and move by pre-New York to early NY session. If price stalls or consolidates near the entry level for too long into the session (after 9:30–10:00 AM PT), consider canceling or reassessing.
FUSIONMARKETS:XAUUSD

Gold price rebounded. Strategy is coming.Gold rose yesterday under the stimulus of risk aversion; gold did not continue the upward trend today, which means that the risk aversion sentiment of gold has been digested. The 4-hour moving average of gold formed a dead cross, and MACD also formed a dead cross. Then gold is likely to maintain the morning support position near 3290 for oscillation.
I think we can continue to short after gold rebounds. After the opening of the US market, the rise of gold has been under pressure at the 3310 line and cannot break through. Gold rebounded under pressure at 3310 and continued to short on rallies.
The market situation is changing all the time. We cannot always use the same trading strategy. If the price fails to rise, we will implement a short strategy; in line with the changes in the market, we can make profits faster.
Operation strategy:
Short near 3305, stop loss 3315, profit range 3270-3260.

GOLD 4H CHART ROUTE MAP UPDATEHey Everyone,
Great way to wrap up the week! We saw quite a bit of sideways ranging movement between our levels, and our 1H chart idea played out nicely throughout the week, and now we end the week with our 4H chart update.
As anticipated, the 4H chart followed through perfectly with our bearish target at 3312 hit first, followed by EMA5 cross and lock, which opened the Retracement Range. This range was reached with precision, and the absence of any further cross and lock confirmed strong support, leading to a bounce back to 3312, just as we expected in our buy the dip strategy.
We’ll be back on Sunday with our multi-timeframe analysis and trading plans for the week ahead. Thanks again for all your likes, comments, and follows.
Wishing you all a fantastic weekend!!
MR GOLD

Data is out. Gold is fluctuating.Information summary:
On Wednesday, US time, the Trade Court ordered an immediate halt to tariffs; the next day, the Federal Court of Appeals immediately resumed the policy. At the same time, the Trade Court was required to respond by June 5, and the government by June 9. Tariff policies are back and forth, and it is difficult to figure out. In other words, don't expect the US government to come up with any good news.
Today, the annual rate of the US core PCE price index in April was 2.6% in the previous value and 2.5% in the expected value. The expectation seen at the beginning of the week was 2.6%. Now the expectation is directly lowered. Is it to leave room for this announcement? If the increase is not higher than the previous value, it is not a significant increase, but it leaves room for interest rate cuts. For gold, the increase is not higher than the previous value, and the short position is limited.
This mediocre data can directly provide a basis for speculation on the current economic situation in the United States.
After yesterday's strong rise, with a very long lower shadow left on the middle track of the Bollinger Band, after stabilizing the middle track, the fast and slow lines further converged and flattened, indicating that the main funds are also hesitating. From this perspective, today's market may continue to fluctuate within the middle track.
At the same time, the closing line is also the most critical, which is around 3285-90 near the middle track.
Operation strategy:
Today's trading needs to pay attention to the cycle suppression position of 3315-3330 on the upper side, and the cycle support level of 3385-3380 on the lower side. This range can be maintained for scalping trading.
If the gold price breaks through strongly upward or downward, the new trend will be realized in a very short time, so traders need to make profits and stop losses in time.

Gold PCE data outlook
💡Message Strategy
Gold remained under pressure today, hovering around the $3,300 mark, mainly affected by the mild rebound of the U.S. dollar. As gold prices are highly sensitive to the U.S. dollar, a stronger dollar usually suppresses demand for gold. However, gold still remains above this week's low, indicating that there is still a lot of room for further decline.
Tim Waterer, chief market analyst at KCM Trade, said: "The market is hesitant to establish new gold long positions before the release of the US core PCE."
The market currently expects the Federal Reserve to cut interest rates by 50 basis points by the end of this year, and the first rate cut may begin in October.
📊Technical aspects
From a technical perspective, gold prices have been frustrated at the $3,320 resistance level, with a short-term bias to the downside. The momentum indicator on the 4-hour chart has turned negative, supporting gold prices to further test the $3,280 support level. If it fails, it may fall to the previous day's low of $3,250. If it breaks further, it may fall to the key psychological support of $3,200.
The rebound of the US dollar has put some pressure on gold, but the weak support of gold prices still shows a clear decline. Considering the rising geopolitical risks and the uncertainty of US policies, the market tends to maintain a short position in gold.
💰 Strategy Package
Long Position:3295-3300

Gold awaits tariff volatility!
📌 Driving Events
Gold rebounded from a weekly low near $3,245 and broke through the $3,300 mark on Thursday, boosted by optimism following a weaker-than-expected U.S. jobs report and a U.S. court ruling halting President Trump's proposed tariffs.
Gold fell on Friday as the dollar rose slightly, while investors await a U.S. inflation report that could provide further insights into the Fed's policy trajectory.
📊 Commentary Analysis
The market continued to fall for an hour, fluctuating back and forth, lacking continuity - it rose yesterday and fell today. Gold rebounded above $3,320 in early trading before retreating. On the weekly and daily charts, the trend is still dominated by range fluctuations rather than unilateral gains or losses.
I think shorting gold should be considered today, with support below at $3,280-3,270-3,260. However, prices may struggle to make new lows. As today is the monthly close, large fluctuations suggest that we should avoid chasing ups and downs.
💰Strategy plan
XAUUSD
Sell: 3330-3320-3310
tp: 3300-3290-3280

Monthly closing bet. Opening a falling gap?Information summary:
At 8:30 a.m. on Friday, U.S. time, the U.S. Bureau of Economic Analysis will release the personal consumption expenditure (PCE) price index for April. As the most favored inflation indicator of the Federal Reserve, the year-on-year change in the core PCE price index has a greater impact on policymakers.
If the data is released, the core PCE price index in April rises faster than expected, and the direct reaction of the market may lead investors to prefer the policy rate to remain unchanged in July. In this case, the U.S. dollar may gather strength, causing gold prices to fall before the weekend.
Market analysis:
Gold prices rose as high as 3322 in the early Asian session, and then fell without a dollar line. As of now, the lowest price has retreated to the 3290 U.S. dollar line. At present, it is not ruled out that gold will fluctuate widely; but the trend view is still biased towards the short side. The strength of the current rebound still depends on the strength of the European session. In the European session, the operation will focus on the vicinity of 3310 U.S. dollars first, and the pressure will still look down to 3280 U.S. dollars.
However, if the European session falls directly below $3,285, there is still room for decline, and the support is around 3,250. In addition, today is the last day of the monthly line closing, and the range of fluctuations has not yet left, so you can continue the short strategy.
Operation strategy:
Short around $3,310, stop loss at $3,320, and profit range around $3,250.

Gold Price Analysis May 30Candle D shows strong buying power on Thursday, most likely today Asia and Europe will decrease and the US session will return to the uptrend.
The bearish wave structure is heading towards 3280. This zone can be bought in Asia and Europe. In the US session, wait for the price reaction to break this zone, limit buying until the bottom of 3254.
Break 3254 confirms the downtrend and heads towards the two support zones 3238 and 3211
When the support zones bounce up, a nice bullish wave is formed and do not SELL Scalp until the 3320 zone. If you break, keep the BUY order up to 3343.

GOLD Intraday Chart For H1 30 May 2025Good Morning Traders,
As you can see that there are some strong zones mentioned on chart,
For Intraday all eyes between 3280-3300 zone,
If market clearly goes below 3280 then it will move towards 3250 else market sustains above 3280 it will move towards 3300 and after clear breakout of 3300 then move towards 3325 initially
Furthermore you can read the chart details carefully, Remember, Always Trade with SL
Today US PCE PRICE INDEX due today
Monthly Closing Due Today as well
Disclaimer: Forex in Risky

GOLD / XAUUSD TodayGOLD is still bearish.
For me are two potential setups.
On screen. If first not profitable I will looking next one.
This is just my view

GOLD - at today ultimate support, short below #GOLD... perfect move as per our analysis and now market just reached at his today ultimate supporting area, that is 3289 again.
Keep close that area and keep in mind guys that below that market can take a dip towards our further supporting areas.
So keep close and only short below 3289
Good luck
Trade wisely

Tariff policy reversed again? Be careful on Friday.Yesterday, Trump and the US Trade Court ruled that the US International Trade Court had stopped the tariff policy. Gold once fell to a low of 3245, while the US dollar rushed all the way to a high of 100.5. Then it reversed, and gold began to rectify and rise. As of now, it has once touched a high of 3330, close to a rebound of $85.
Today, it reversed again. The US Court of Appeals allowed Trump's tariff policy to continue to take effect temporarily. And impose tariffs on most areas of the global economy, including allowing tariffs of up to 15% within 150 days to address trade imbalances with other countries. Compared with the tariff policy that was deemed illegal this week, this step is more legally defensible.
Looking at the current gold, it is likely that gold will fall sharply today. After gold fell yesterday, everyone wanted to short gold, but gold rebounded all the way.
So, today, Friday, is an opportunity for short-selling strategies. The short positions have been eliminated, so gold has every reason to fall, and it will fall sharply.
Once it falls below 3280 in the downward trend, it will test the low point of yesterday near 3250. If it breaks through 3250 again, it will go directly to the low point near 3200. The current short-selling strategy has little to do with technical analysis, it is completely a test of human nature.

Gold price analysis on May 29Not beyond the previous analysis of the D candle confirming the decrease and maintaining the trend of the candle on May 27
After touching the breakout zone of 3257, Gold is reacting to increase again and there is a high possibility that there will be buying force in the market today
3275 is the reaction zone that Gold is facing in front of this increasing force when breaking 3275 will head to 3285 and this is an important breakout zone with a large number of sellers accumulating in this zone. Breaking 3285 is considered a temporary break of the downtrend and waiting for the next reaction zones for SELL strategies around 3302 and 3314
The support zones with a tendency to react to prices and are also targets for SELL signals are noted in the resistance zone of this morning's Asian session around 3256. Two notable support zones today for bottom-probing signals are noted around 3238 and 3220.

Gold is still washing out, beware of a fall below 3326!
📊Comment Analysis
After gold fell in the Asian session, the entire European session rebounded continuously, and the US session hit the 3318 line. Overall, it is still a wide range of shocks and washes out. No matter whether it rises or falls, it is not continuous, and the fluctuation range is large, which is difficult to grasp in short-term operations.
The current rise cannot be regarded as a strong trend. The characteristic of the shock market is repetition. The 4H cycle opens at 3326 as a watershed. Beware of a fall below this position in the US session. You can try to go short near 3320/3325. At present, it is a key position to bet on the short position. If it goes up, it will be 3340/3350. The rise in a short period of time is too large, and once it falls back, the strength will be the same.
⭐️ Note: Labaron hopes that traders can properly manage their funds
- Choose a lot that matches your funds
- Profit is 4-7% of the fund account
- Stop loss is 1-3% of the fund account

GOLD ROUTE MAP UPDATEHey Everyone,
Please see update on our 1H chart route map from yesterday.
Another great day on the charts with our analysis playing out like we said.
Yesterday we stated; no EMA5 lock above 3317, forcing a rejection back to the retracement range.
We then stated that we are expecting continued reactions within this retracement range, inline with our plans to buy dips. Our updated levels and weighted levels help us track downward movements and catch bounce setups.
- This played out perfectly with the reaction from the retracement range into 3317. We will now look for a lock above this level for a continuation or failure to lock will follow with a rejection back into the lower Goldturns for support and bounce.
We'll continue to buy dips using our key support levels, targeting 20 to 40 pip moves. As always, each level structure provides consistent bounce zones, offering great opportunities for both entry and exit. If you backtest the levels we’ve shared every week over the past 24 months, you’ll see how effectively they work with or against short to mid term swings and trends.
Remember:
Swing ranges yield bigger bounces than weighted levels — that’s the key difference.
BULLISH TARGET
3389
EMA5 CROSS AND LOCK ABOVE 3389 WILL OPEN THE FOLLOWING BULLISH TARGETS
3428
EMA5 CROSS AND LOCK ABOVE 3428 WILL OPEN THE FOLLOWING BULLISH TARGET
3478
EMA5 CROSS AND LOCK ABOVE 3478 WILL OPEN THE FOLLOWING BULLISH TARGET
3517
BEARISH TARGETS
3352 - DONE
EMA5 CROSS AND LOCK BELOW 3352 WILL OPEN THE FOLLOWING BEARISH TARGET
3317 - DONE
EMA5 CROSS AND LOCK BELOW 3317 WILL OPEN THE FOLLOWING BEARISH TARGET
3282
EMA5 CROSS AND LOCK BELOW 3282 WILL OPEN THE FOLLOWING BEARISH TARGET
3233
EMA5 CROSS AND LOCK BELOW 3233 WILL OPEN THE SWING RANGE
3185
3146
As always, we’ll keep you all updated with real time analysis and management of active setups throughout the week. Thank you for your continued support, your likes, comments, and follows mean a lot!
Mr Gold
GoldViewFX

Gold starts a new trend? What is the reason?Gold prices rebounded, and the phenomenon of "buying on dips" appeared after hitting the low of the week earlier. In addition, the US Trade Court ruled that President Donald Trump's tariffs on major trading partners exceeded his authority, which attracted market attention. Investors' focus has gradually shifted to the US core inflation data to be released this week.
So far, the price of gold has risen by 0.91%, and the price has fluctuated around 3315. It hit the lowest point since May 20 during the European and Asian sessions.
The cyclical market presents a three-wave pattern. The first two periods showed a trend of rising first, then falling, and then rising again. It is currently entering the third period. The current rally has basically ended and will usher in a small decline.
I believe that the current rise in gold is partly due to technical covering, while economic uncertainty continues to support gold prices amid ongoing US debt problems and global trade tensions.
In addition, there are reports that the United States has ordered a large number of companies not to export goods to China without permission, and revoked the export licenses that some suppliers have obtained.
The current market is focusing on the US GDP data to be released later and the core personal consumption expenditure price index to be released on Friday. These two data will become an important basis for judging the future interest rate path of the Federal Reserve.
I will also pay attention to the release of news in a timely manner so as to update you in time on the impact of news on gold prices. Please be patient, traders.

XAUUSD TECHNICAL OUTLOOK 29-05-2025📣Gold Under Pressure XAUUSD CMP $3316.81
✅XAUUSD movement 29-05-2025: $3289-$3245-$3321 =$120 Movement Witnessed.
🔴Gold remains under pressure after a sharp turn from morning crash, which has triggered fresh volatility across commodities in USA session.
⏳ Despite safe-haven appeal, XAUUSD faces bullish momentum after a correction, driven by renewed appetite for risk assets and shifting market flows.
📉 Technical Outlook (1H):
• Bearish below $3305
• Next downside targets: $3280 → $3265 → $3250
• A break below $3255 could accelerate the decline toward $3240-$3220
🔁 Bullish Shift Trigger:
• A confirmed 1H close above $3319 may invalidate the bearish bias and target $3340+
📊 Key Levels:
• Pivot: $3305
• Support: $3280 – $3265 – $3250
• Resistance: $3327 – $3339 – $3351

Top and bottom conversion, short position continues?📰 Impact of news:
1. The International Trade Court ruled that Trump exceeded his authority, and the previous tariffs may be suspended
2. Ukraine submitted a ceasefire document to Russia
3. Pay attention to the initial jobless claims data during the US trading session
📈 Market analysis:
The U.S. Court of International Trade in Manhattan blocked Trump’s “Liberation Day” trade measures, ruling that Trump had overstepped his authority by imposing sweeping tariffs on countries that export more to the United States than they import without authorization from Congress. This means that most of Trump's tariffs will be suspended. But at the same time, the recent geopolitical impact cannot be ignored. In addition, the initial jobless claims data will be released during the U.S. trading session today. Independent traders must set stop losses.
From a technical point of view, the 1H level chart of gold shows that the Bollinger Bands open downward, and the gold price is near the lower track, showing a weak pattern in the short term. Considering that 3285 is the previous low point, there is also a possibility of suppression at 3285. Therefore, we should pay close attention to the resistance range of 3285-3295. If the gold price in the Asian and European sessions can stabilize below 3295, then we can rely on the 3285-3295 range to enter the market and short. On the contrary, if the pullback today stands above 3300, then we should not chase the short easily.
🏅 Trading strategies:
SELL 3285-3295
TP 3270-3260-3250
If you agree with this view, or have a better idea, please leave a message in the comment area. I look forward to hearing different voices.
OANDA:XAUUSD FX:XAUUSD FOREXCOM:XAUUSD FOREXCOM:XAUUSD FXOPEN:XAUUSD TVC:GOLD

Analysis and layout of gold trend in the US market📰 Impact of news:
1. Initial jobless claims data is positive
2. The White House is tough on the court ruling: Trump will win! Three trade agreements are close to being reached
📈 Market analysis:
I think the current rebound should not be directly judged as a unilateral trend. From a technical point of view, in the 4H cycle, the upper 3320-3325 line has a certain suppression force in the short term. If the gold price runs below 3325, we need to be alert to the risk of a high rebound. We can try to arrange short orders based on the 3320-3325 range, and bet on the high selling opportunities in the volatile market. Independent trading with a good stop loss. However, it should be noted that if the price quickly breaks through the 3330 line in the short term and stands above it, it is expected to rise to the 3340-3350 area. At the same time, I think the support below can first look at the 3300 line, with a focus on the 3290-3285 line support.
🏅 Trading strategies:
SELL 3320-3325
TP 3310-3300
BUY 3295-3285
TP 3300-3310-3320
If you agree with this view, or have a better idea, please leave a message in the comment area. I look forward to hearing different voices.

Don't define the price of gold
💡Message Strategy
The U.S. International Trade Court ruled that Trump's tariffs exceeded his authority. Once the ruling was made, market risk appetite quickly rebounded, driving global risk assets up and safe-haven assets such as gold came under selling pressure. The price of gold fell to $3,245 during the Asian trading session, hitting a 10-day low.
In addition to the weakening of risk aversion, the minutes of the Federal Reserve's May meeting reinforced the market's expectation that it would "maintain interest rates unchanged for a long time". In addition, the generally strong US economic data released this week caused the US dollar index (DXY) to return to the 100 mark, which put continued pressure on gold, a non-interest-bearing asset.
📊Technical aspects
Technically, gold price fell below the short-term rising trend line and the 200-period moving average of the 4-hour chart, and the short-term trend turned bearish. If it falls below the key support of $3,245 (50% Fibonacci retracement level), it may further point to $3,215 (61% retracement) or even $3,200 and $3,180. The upper rebound resistance is located at $3,300, $3,325 and $3,350 respectively.
From the daily chart, gold (XAU/USD) closed negative for the fourth consecutive day. The price has effectively fallen below the lower track of the short-term rising channel and continued to run below the 10-day and 15-day moving averages, indicating that the short-term momentum has weakened. The MACD fast and slow lines have a dead cross, and the green column is enlarged, further confirming the short signal.
Currently, the vicinity of $3245 is the support of the previous shock range. Once it is lost, the 61.8% Fibonacci retracement level of $3215 will be tested below, and even approach the psychological integer level of $3200.
If the gold price is supported in this area, it is expected to build a staged bottom; on the contrary, if it falls below $3200, it will look down to the $3150-3110 area. The short-term rebound needs to pay attention to the pressure level near $3300, which is also the dense intersection area of the previous moving averages. The overall structure suggests that the shorts are dominant.
💰 Strategy Package
Short Position:3310-3320,3340-3350

Exploded, gold fell as expected
💡Message Strategy
The minutes of the Federal Reserve meeting showed that the risk of rising unemployment and inflation has increased, and the interest rate cut is expected to cool down again. In addition, Trump claimed that the US-Iran nuclear agreement may be reached "in the next few weeks" and warned Israel not to attack Iran for the time being. Hamas claimed that it had reached an agreement with the US Middle East envoy on the outline of the Gaza ceasefire. The risk aversion sentiment cooled down, causing gold to open directly down in the morning.
📊Technical aspects
The 1-hour level shows that the short-term gold price expanded its rebound and once formed a trend of stepping back on the hourly 60-day moving average. The current gold price fell again and continued to intensify the overall hourly moving average, which was arranged in a relatively regular downward divergence, maintaining a short-term bearish guidance reference. The current hourly RSI is oversold.
The 4-hour level shows that the current gold price has fallen sharply, forming a downward breakthrough trend of the four-hour 60-day moving average, gradually forming a bearish performance of the four-hour indicator, and the four-hour RSI is oversold. There is a strong demand for gold prices to fall in the short term.
💰 Strategy Package
Short Position:3250-3260

USD/JPY 1H Analysis – Channel Breakout and Buy SignalOverview:**
The USD/JPY chart shows a **bullish breakout from a descending channel**, supported by technical indicators like the Ichimoku Cloud and a strong demand zone. This setup suggests a potential bullish reversal and upward momentum.
*Key Technical Points:**
* **Descending Channel Breakout:**
Price action has broken out of a falling channel, indicating a shift in market sentiment from bearish to bullish.
* **Strong Support Zone:**
Around 143.28 – 143.73, the price found significant support, which aligns with a previous demand zone. This area held firm, helping trigger the breakout.
* **Ichimoku Cloud:**
Price is emerging above the Ichimoku Cloud, signaling a potential start of an uptrend. If the price maintains above the cloud, bullish momentum may strengthen.
* **Resistance Levels:**
* **First Resistance:** Near 146.00 – a critical area to watch for short-term profit-taking.
* **Second Resistance:** Around 148.00 – a more extended target if bullish continuation holds.
---
### **Trading Idea:**
**BUY USD/JPY** on successful retest of the breakout or sustained move above the Ichimoku Cloud.
* **Entry:** 144.30–144.40 zone
* **Target 1:** 146.00
* **Target 2:** 148.00
* **Stop Loss:** Below 143.20 (under the support zone)
---
Conclusion:**
The chart presents a classic **bullish channel breakout** supported by the Ichimoku indicator and price action at a strong support zone. As long as the price holds above the breakout level and Ichimoku Cloud, the upside targets at 146 and 148 remain valid.
Let me know if you want this formatted as a trade plan or journal entry.
To ensure you do not miss the upcoming analysis, be sure to follow me!
Please leave a remark and a like!
