Market situation unclear? Check out this analysis📰 Impact of news:
1. ADP data is significantly positive
2. Trump: "Mr. Too Late" Fed Chairman Powell must cut interest rates now
📈 Market analysis:
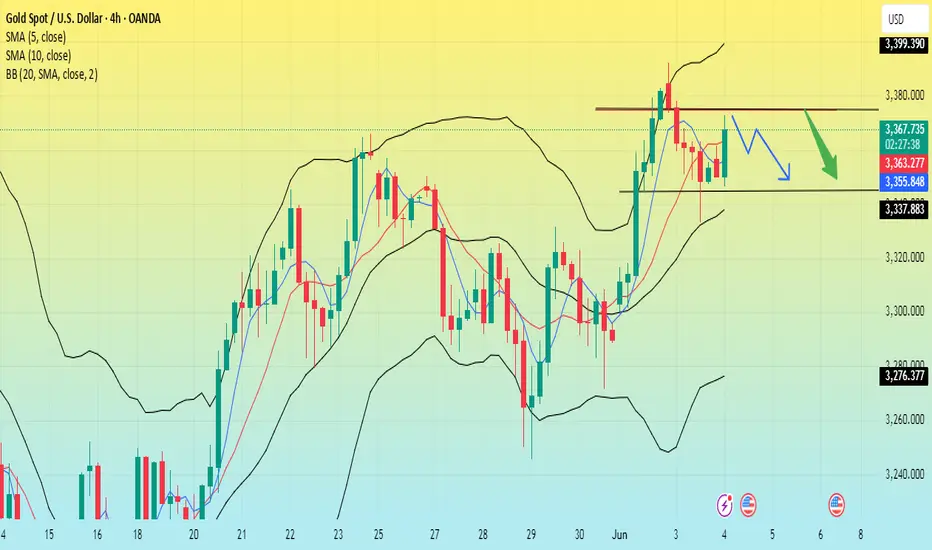
The ADP data is significantly bullish, but we cannot rule out that this is an illusion created by the market, because although the daily line has formed a golden cross, it has not fully released the bullish momentum, and has not been able to exert force in the bullish upward trend. Therefore, I prefer to go long at a low position in the US market rather than chasing it immediately. At the same time, the upper 3365 may become a short-term strong pressure level. If the gold price encounters resistance here, the US market will usher in a retracement, and then it will be our time to go long.
🏅 Trading strategies:
SELL 3360-3365
TP 3340-3330
BUY 3330-3317
TP 3360-3370-3400
If you agree with this view, or have a better idea, please leave a message in the comment area. I look forward to hearing different voices.
TVC:GOLD FXOPEN:XAUUSD FOREXCOM:XAUUSD FX:XAUUSD OANDA:XAUUSD
Goldprediction

Gold fluctuates, with downward support at 3325
📌 Driving events
The number of ADP jobs in the United States in May was 37,000, expected to be 110,000, and the previous value was 62,000.
📊Comment analysis
Views on the trend of gold in the US market!
After a day of swinging, gold is still fluctuating between 3372 and 3340. After opening high and closing low on Monday, gold has been fluctuating for two days. The ADP data will be released tonight. Whether it can break the trend of the volatile market tonight depends on the release of the ADP data. If it is still the case, we can only wait for the big non-agricultural data on Friday. In the face of this volatile trend, Labaron still recommends maintaining the previous operation strategy.
The support below is 3330-25. If it breaks down, we will talk about it. If it still remains above this level, we will still operate with the oscillating trend. After all, in the face of the current trend of neither long nor short continuity, a single direction will only make you lose all your profits. For the current decline, we should first look at the support of 3330-25!
⭐️ Note: Labaron hopes that traders can properly manage their funds
- Choose the number of lots that matches your funds

XAU/USD (Gold vs USD)📏 Trendlines:
Red descending trendline = consistent lower highs → selling pressure increases.
Horizontal red support line (~3349) = price tested multiple times, but no strong bounce.
📦 Chart Patterns:
Multiple bear flag formations marked in green = typical continuation patterns in downtrends.
Suggests repeated attempts to rally are being sold into.
🟣 Support & Resistance:
Immediate resistance: Downtrend line (~3355–3360).
Key support level: 3349 (horizontal red line).
Breakdown target: 3332.685 (blue horizontal line) and further to ~3310 zone.
🧭 Price Projection:
🚨 Expect a potential pullback to the trendline (~3355), which may reject again.
📉 If 3349 support breaks, a strong drop to 3332 is likely.
Final bearish target: ~3310 level, aligning with the magenta arrow.
📌 Conclusion:
⚠️ Bias: Bearish under 3355.
🧨 Watch for breakdown confirmation below 3349 to trigger short positions.
🕵️♂️ Be cautious of false breakouts; wait for candle close confirmation.

Gold trend analysis and layout before ADP data release📰 Impact of news:
1. May ADP data
2. The geopolitical situation worsens
📈 Market analysis:
Today, the gold price in the Asian session hit the 3370 line and then began to fall. Before the release of the ADP data, the gold price is likely to fall into a volatile pattern. The upper short-term resistance is 3370-3380. Pay attention to whether it can break through 3392, which will determine whether the short-term gold price can reach 3400. Pay attention to the support below 3350-3345, and focus on the 3330 line support. Once it falls below 3330, the gold price may reach 3317. If the ADP data is released and stabilizes near 3317, and then quickly closes the long lower shadow. Then you can rely on the 3317 to enter the market and do more. As long as it rebounds to above 3330 again, then the high point near 3390 above will definitely not be maintained. On the contrary, if gold falls below the 3330 and 3317 levels during the US trading session, don't go long easily. Participate in the high-altitude and low-multiple cycle during the European session. If it retreats to 3355-3345, consider going long with a light position and look at 3360-3370. If it touches 3375-3390 and is under pressure, consider shorting. Focus on ADP data!!
🏅 Trading strategies:
BUY 3355-3345
TP 3360-3370
SELL 3375-3390
TP 3350-3340
If you agree with this view, or have a better idea, please leave a message in the comment area. I look forward to hearing different voices.
OANDA:XAUUSD FX:XAUUSD FOREXCOM:XAUUSD FXOPEN:XAUUSD TVC:GOLD

Gold awaits data storm
The international gold market is playing out a wonderful duel between long and short forces. The following data will guide gold to continue to start a new direction, so what should we do?
💡Message Strategy
Employment data: complex signals of long and short interweaving
The latest US JOLTS employment data for April presents a strange picture of "ice and fire". On the one hand, the number of job vacancies unexpectedly increased by 191,000, far exceeding market expectations. This eye-catching data was called "surprisingly strong performance" by Joseph Capurso, an analyst at the Commonwealth Bank of Australia. But on the other hand, the number of layoffs surged by 196,000, the largest increase in nearly nine months, exposing the potential fragility of the labor market.
Trade Cloud: Continuing Fermentation of Geopolitical Risks
The current global trade situation is like a sword of Damocles hanging over the market. The White House has signaled that President Trump may hold key talks with the leaders of major Asian countries this week, and this news brings a glimmer of hope to the market.
Policy fog: The Fed's cautious dance
Market participants are focusing on the key data that will be released one after another. Before the release of the non-farm payrolls report on Friday, the ADP private employment data on Wednesday night will become an important indicator. Analysts generally believe that these data will provide more clues for judging the direction of the Fed's policy, which will in turn affect the investment logic of the gold market.
📊Technical aspects
Monday's pull-up seemed to be the start of a new round of bulls, but yesterday there was a sharp retracement again. If we look at it from a unilateral rise, the retracement has been too large, and it has obviously destroyed the rising pattern. If we count the rising point from the low point of 3260 last Thursday to the high point of 3390 in the morning yesterday, the increase has reached more than 140 US dollars, and it is still within the range of weekly and monthly levels. This is why it is not recommended to chase the rise directly.
At present, gold cannot form a continuous rise, so 3390 is likely to be the high point of this round of highs, and it will start to fall again, still with weekly level range fluctuations and high-level adjustments.
The US dollar stabilized and rebounded. It continued to rebound yesterday. After testing the support near 90 in the morning today, it rose again. In addition, under the expectation that the Federal Reserve will not cut interest rates in June, the US dollar is likely to continue to fall in June, which will create time for gold to adjust. Therefore, gold does not have the conditions for a breakthrough in the short term. Once the US dollar accelerates its rebound, gold still has the possibility of another sharp drop.
💰 Strategy Package
Short Position:3365-3370,3375-3380

| Gold | And Gold Alone : Buy The Best | Accept No Substitute | | Gold | And Gold Alone : Buy The Best | Accept No Substitution |
Gold
Accept No Substitute.
Never fall into the "Catch-Up Game Trap."
Silver is presently such a Trap.
Gold will continue to Outperform Silver
Don't let a Dealer convince you otherwise
Buy Strength, Sell Weakness
Buy The Best, Winner takes all
Gold / > United States Dollar
Gold / > US Dollar Index
Gold / > Swiss Franc
Gold / > Great British Pound
Gold / > Euro
Gold / > Japanese Yen
Gold / > Bitcoin
Gold / > Silver
Bitcoin / < Gold
Bitcoin Total Market Cap / < Gold
Silver / < Gold
Pro Tip : Rarely a good bet, if your Broker is paying carry for you to hold it.
It's in the Detail
🌟

GOLD - cut n reverse area? short below only#GOLD.. market just reached at his today most expensive region that is around 3345-46 to 3350-51
keep close that region and keep in mind that is our cut n reverse region because below that we can expect a drop towards our tringle neck line.
dont be lazy here.
good luck
trade wisely

Simple yet effective strategy for the American sessionHello everyone. Also a long-time trader who has just joined the tradingview platform. Hope you are interested and interact with me.
Gold is reacting in the candlestick area of the US session. The possibility of a bounce from this 3352 area is quite high.
And in the US session, if it breaks 3361, it can reach 3375. If this 3352 area is broken, the possibility of a corrective downtrend will continue and we will wait for a sell break of 3352, the target can reach 3325.

Gold Price Analysis :Bullish Breakout Anticipated After fakeout.This 30-minute chart for Gold Spot against the U.S. Dollar (XAU/USD) shows a strong consolidation followed by a sharp upward movement. After testing multiple support levels, price bounced strongly from the 3,325 zone and is currently trading at around 3,360.775.
The green zones represent key demand and support areas, where buyers have historically stepped in. Resistance is seen near the 3,400 level. The blue arrow indicates a bullish projection toward the 3,400 resistance zone.
Fakeout & Trap Explanation: A notable fakeout is visible just before the price bounced—this occurred when the price briefly broke below a support level (around 3,345), which may have triggered stop-losses and short entries. However, this move quickly reversed, trapping bears and forcing them to cover their positions, creating a bear trap.
This type of liquidity grab is often engineered by larger market participants to accumulate long positions at better prices. The swift recovery and momentum suggest a bullish continuation toward the next resistance zone near 3,400, as indicated by the arrow.
Conclusion: If the price holds above the mid-level support (~3,345–3,350), we may see further bullish momentum. Watch for a breakout and close above the recent highs for confirmation of trend continuation.

Trade Idea: XAUUSD Long (BUY STOP)Direction: Long
Order Type: Buy Stop
Entry: 3366.50 (above recent local resistance and reclaiming structure)
Stop Loss: 3352.00 (below M15/M3 structure and recent low)
Take Profit: 3402.00 (previous swing high zone and just under H4 resistance)
Risk-Reward Ratio: ~2.57R
⸻
🧠 Trade Rationale
H4
• Price bounced from a higher low around 3320–3330, still respecting the long-term uptrend.
• Price is now reclaiming the 20/50 SMA cluster, which could act as dynamic support.
• Momentum is neutral-to-positive with MACD poised for a bullish crossover.
M15
• Price reclaimed 20 SMA and is now curling back above the 50 SMA.
• Clean bullish engulfing structure forming, indicating buyer re-entry.
• RSI is mid-50s with room to expand upward.
M3
• Strong, steady micro uptrend forming higher lows and consolidating under resistance near 3366.
• Increasing volume on upward moves, suggesting healthy interest from buyers.
⸻
🛡️ Risk Management & Execution
• Entry confirmation: Only enter if price breaks above 3366.50 on strength — avoid premature triggers.
• Invalidation Window: Trade becomes invalid if price closes below 3350 on a 15-minute candle. This would break both M3 and M15 structure.
• SL to BE: Move SL to break-even after price reaches 3377 and forms a micro higher low on M3 or support-resistance flip.
FUSIONMARKETS:XAUUSD

Gold price returns to 3400?
📣 Gold Information
Gold prices gave up some of Monday's gains on Tuesday, falling more than 0.80% as strong U.S. labor market data reinforced expectations of a strong economy and put pressure on the non-yielding metal. As of writing, XAU/USD was trading around $3,348, hitting an intraday high of $3,392.
Investor sentiment picked up after the latest U.S. Job Openings and Labor Turnover Survey (JOLTS) showed a sharp increase in job openings in April, indicating a continued tight labor market. The optimistic data came this week, which will see a series of key employment reports released, including the ADP employment change data for May released on Wednesday and the much-anticipated non-farm payrolls data on Friday, both of which could affect expectations of Fed policy.
📊Comment Analysis
Gold prices maintain bullish momentum, tariff momentum coupled with current unfavorable economic data
💰Strategy Package
🔥Sell Gold Area: 3411-3413 SL 3418
TP1: $3400
TP2: $3390
TP3: $3380🔥
Buy Gold Area: $3332-$3330 SL $3325
TP1: $3345
TP2: $3358
TP3: $3370
⭐️ Note: Labaron hopes that traders can properly manage their funds
- Choose a lot size that matches your funds
- Profit is 4-7% of the capital account
- Stop loss is 1-3% of the capital account

GOLD H1 Chart Update For 4 June 25Good Morning Traders,
As you can see that market is in swing range since starting the week but right now main strong 3400 resistance remains intact, Once market clearly breaks 3400 then it will move towards 3420 or even 3440
Intraday swing trading range is 3440-3480
If market break 3325 level successfully then it will move towards 3310 or even 3290
Scalping range 3345-55 for buy side
Good Luck
Disclaimer: Forex is Risky

Asian session main long and auxiliary short operation
📣Gold information
There are two main reasons for the rise in international gold prices: First, global trade frictions have intensified. Trump said that he would raise tariffs on steel and aluminum. The EU strongly opposed it and prepared to implement countermeasures. Brazil is also ready to counter, and the market is worried that the United States will resume the "big stick" of tariff policy; second, in terms of geopolitical conflicts, the market is worried that the conflict between Russia and Ukraine will escalate again. Overall, the medium- and long-term rise in gold has not changed, and there is still uncertainty as to whether it can successfully break through the resistance level in the short term.
📊Comment analysis
Today, we need to pay attention to the support effect of the moving average. The current 5-day moving average is near 3340, and the 10-day moving average is near 3325. These two positions constitute important support areas for the short-term correction of gold prices. In terms of upper resistance, pay attention to yesterday's high of 3392. If the gold price can break through this resistance level upward, it means that the upward momentum is strong, and it is expected to continue the strong trend and further open up the upward space.
In terms of points, pay attention to the support near yesterday's low of 3333 below, and the resistance near 3360 and 3370 above.
💰Strategy Package
🔥Sell Gold Zone: 3365-3370 SL 3375
TP1: $3355
TP2: $3340
TP3: $3325
🔥Buy Gold Zone: $3325-$3330 SL $3320
TP1: $3345
TP2: $3355
TP3: $3365
⭐️ Note: Labaron hopes that traders can properly manage their funds
- Choose the number of lots that matches your funds

Gold-Asian market rises, what is the trend?Event summary:
On Wednesday in the Asian market, spot gold fluctuated slightly and is currently trading around $3,370/ounce.
There are two reasons for the strong rise in the Asian market: 1. Ukraine directly blew up 41 Russian fighter jets; 2. The tariff storm re-emerged, and Trump is expected to impose a 50% tariff on steel and aluminum. The tense international situation and tariff storm have become important factors that disrupt the market.
Market analysis:
The four-hour chart shows that the current price is still running above the middle track of the Bollinger Band channel, and the MA10-day moving average and the 5-day moving average are running above 3,340. Due to the wide fluctuations in the market, short-term participation is the main option. Intraday callbacks are still mainly low and long.
Gold rebounded directly in the early trading, and the center of gravity of the low point of the rebound is also constantly moving up. From the current market, the short-term gold price has stabilized above the top and bottom conversion position of 3,340, and it also remains above the rising trend line, and the bulls are strong.
In the early trading, the gold price fell back to the lowest level of 3346, and it formed a Yang-enclosing-Yin pattern, which means that the bulls' energy is relatively strong. We only need to pay attention to two points in the early trading, namely the key level of 3330 and the short-term support level of 3346. If it falls back to around 3350 during the trading session, we will start to go long.
Operation strategy:
Short at 3375, stop loss at 3385, target 3340-3320;
Long at 3345, stop loss at 3333, target 3370-3400;
GOLD conditions seem to remain bearish: Pay attention to hintsFor now, we can see that Gold’s bullish momentum has stalled and since Friday Gold has been under pressure from 3325. Not surprisingly though, the market structure performed as expected this past week.
I believe that short-term price action in gold may remain choppy next week due to Trump’s temporary tariff measures so caution is advised.
My bias is still the same as before, I think that on Monday the market will open bearish likely pushing price lower initially.
As you can see in my previous analysis, the forecasted move played as expected:
So this being said I plan to react based on how price behaves at support of 3270-3250 on the lower side in the short term.
If price tags the support as shown on my chart, I’ll be watching for a possible rebound toward 3300. This range in particular should not be overlooked . This area aligns with the point of control, and given how price often gravitates back to high-volume zones after sharp moves, a recovery to that level would be a natural reaction.
The key point lies in how the market will open and how price will behave, as well as the overall sentiment.
Gold's next move won’t be random, there are strong confluences at play that will guide and give us hints, so it’s up to us to stay attentive.
If we were to break upside above the $3,330 level, then we can see more bullish outlook next
The other scenario, to be taking into account would be to start with a strong bullish candle and reach 3330 before a drop.
Wishing you a profitable trading weekend ahead. This is just a forecast and should not be considered financial advice.

XAU/USD selling below 3364 or Buy next impulseI believe this is a corrective move ,since 5th wave leg rejected from 0.707.
so, planning to sell below 3364 and holding till 3340.
if 5th wave extends then it won't break 3364 and sustains.
Im on sell side
