Gold trading rhythm is perfectly matchedIn the previous strategy, we recommended maintaining a high-selling and buying-low strategy for gold. We accurately predicted the high point near 3397 and arranged short positions near 3395. It then fell steadily to around 3371. Judging from the current gold trend, gold rose and then fell in the European session, touching around 3397, which is exactly the pressure level of the upward channel trend line. The Bollinger Bands in the 4H cycle closed, and the indicators temporarily showed signs of differentiation, but the overall market was resistant to declines at high levels. The current short-term support is around 3375-3370. If it does not break the short-term, it will still be volatile. If it falls below, the strong support of 3360 will be seen. The upper pressure levels are 3385, 3398-3400. In terms of operation, we still maintain a high-altitude, low-multiple short-term strategy. I will give the specific operation ideas at the bottom, remember to pay attention in time!
Goldpreis

Opportunities only come to those who are preparedThe market expects the probability of the Federal Reserve cutting interest rates in September to be over 70%, with some institutions even predicting as high as 93.6%. Fed officials have recently released dovish remarks. If the rate cut is implemented, it will reduce the opportunity cost of holding gold, which is good for gold prices. The US has imposed tariffs on India and Switzerland, exacerbating global trade tensions and boosting demand for gold as a safe haven. The deadlock in the Iran nuclear talks and the shipping risks in the Red Sea have increased market risk aversion. Focus is on US initial jobless claims data and speeches by Fed officials. If the data is stronger than expected, it may suppress expectations of a rate cut and be bearish for gold. If the US dollar strengthens or geopolitical risks ease, gold prices may come under pressure and fall. Today, gold mainly showed a high-level fluctuation trend, hitting a high of $3397.25/oz in European trading before falling sharply. It is currently trading around $3382. Although gold prices are still in an upward channel, they have recently shown a high sideways trend. The market lacks unilateral driving factors. Gold can be shorted at high levels. It is recommended to short gold in batches around the highs of 3390-3405.

The triangle pattern is about to break through and hit 3400#XAUUSD
Although the price of gold was too high last night due to the rise in risk aversion, the upward momentum weakened significantly in the evening, and it fluctuated sideways at a high level. Gold is currently consolidating within a triangle pattern, with a short-term price increase reaching the triangle's boundary. A break above 3385 could lead to significant intraday gains. Meanwhile, the downside is defending short-term support at 3365. As long as this support level remains intact, the bullish trend remains intact. If the European session gives an opportunity to fall back to the 3375-3365 support area without breaking, you can consider going long and look at 3395-3405, and if it breaks, look at 3415.
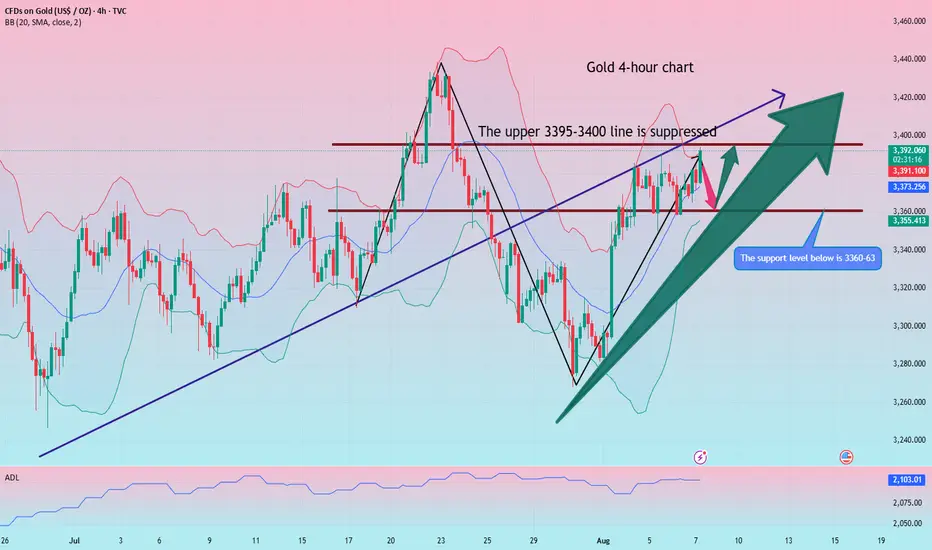
Strike with precision and win in the gold trading market!Gold continues to fluctuate in an upward structure, with lows gradually rising, showing that the bulls are still in a dominant position. The current key support has moved up to the 3360 line. Before this position is effectively broken, the overall idea is to maintain a low-long strategy. It should be noted that the current market has been consolidating at a high level for three consecutive days, and has the basis for further strengthening. It is not advisable to wait for a sharp pullback at this time, but to pay attention to the continuity opportunities of direct pull-ups. It is recommended to seize the strong continuation opportunities in the current period in terms of operations, and strategically postpone it to the European and American trading sessions for simultaneous execution. Specifically pay attention to the long order layout opportunities in the support area of 3375-3360, and the upper resistance is around 3390-3405. Overall, we should flexibly participate in the high-altitude and low-long rhythm in this range. It is recommended to wait and see in the middle position, chase orders cautiously, and wait patiently for key points to enter the market.

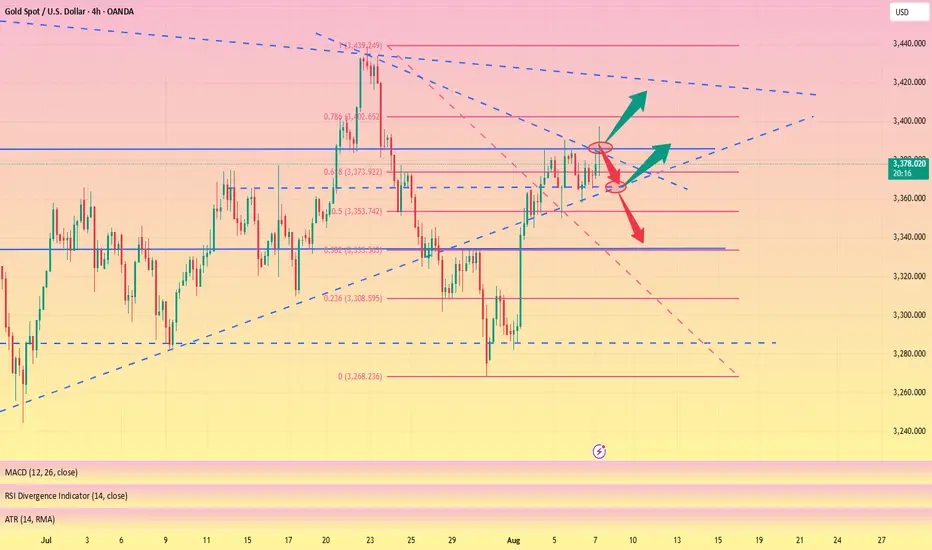
The best ambush point for short positions below gold 3400.The daily structure of gold still maintains a bullish dominant pattern. The upper target is the upper Bollinger band of 3400. If it breaks through this position, the upside space will be further opened up. The 4-hour Bollinger band is gradually closing, and the price is fluctuating in the range of 3400-3360. In the short term, it is still treated with range thinking. Before an effective breakthrough, the operation can adopt a high-altitude and low-long strategy. Gold is currently at a critical node of change. If it rises and falls in the evening, it may release a temporary peak signal. The area below 3400 is expected to become an opportunity for the layout of medium-term short positions. The overall recommendation is to remain cautious, respond flexibly to changes in rhythm, and strictly control risks.
Gold operation suggestion: You can continue to try short selling in the 3390-3400 range, with the target at 3380-3370.

Gold range fluctuates, continue to be bullish after falling back
Yesterday, gold prices initially declined before rising, continuing the previous day's deep V-shaped rebound pattern. Prices came under pressure at 3378 in the Asian and European sessions, weakening and fluctuating downward. The European session continued its downward trend, breaking through 3360 to reach around 3358 before stabilizing and recovering. In the US session, bullish momentum continued to rebound, breaking through 3380 before falling back under pressure and weakening. The price finally closed around 3367, closing in a mid-yin-yang pattern of volatile adjustment. Overall, gold prices retreated again to test support near 3360, effectively establishing a wide range of bullish and bearish fluctuations in the short term. Further gains are expected today, challenging above 3390. However, given the recent volatile pattern of gold prices, it's not advisable to chase gains or sell losses in the short term. If your current trading is not ideal, I hope Yulia can help you avoid investment pitfalls. We welcome your communication.
According to the 4-hour chart, support is currently focused around 3365-60, while resistance is expected around 3395-3400. We should maintain a high-short-low-buy cycle within this range. In the intermediate range, we should be cautious in following orders and patiently wait for key entry points. I will provide detailed trading strategies during the trading session, so please stay tuned.
Gold Trading Strategy:
Go long on gold if it retraces to the 3360-65 level, with a stop loss at 3353 and a target of 3390-3395. Continue holding if it breaks below this level.
The market trend is still there, go long on the pullback#XAUUSD
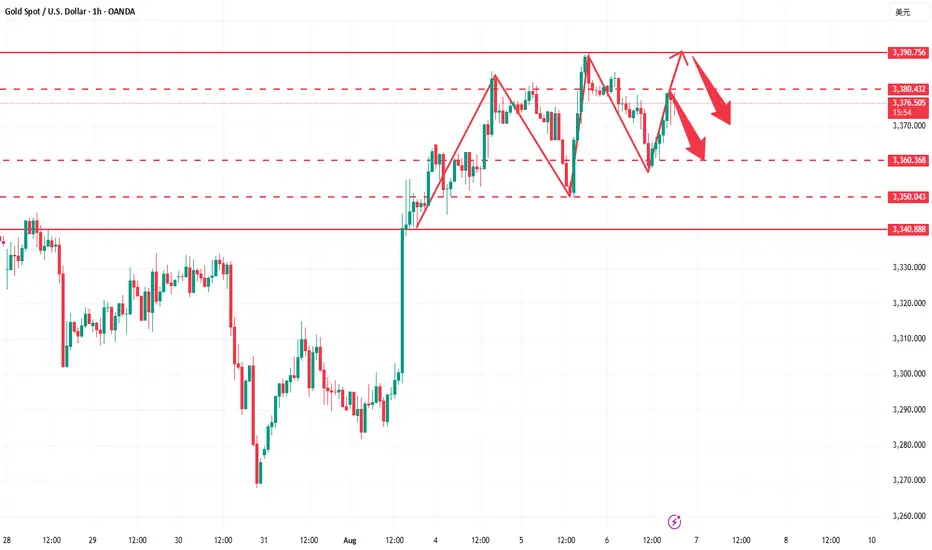
Yesterday, gold experienced a V-shaped reversal: it was blocked at the 3382 line in the morning and then fluctuated and fell, then it fell to the support near 3349 and stabilized and rebounded, then rebounded to near 3390 in the evening and closed with a doji on the daily line. Judging from the overall trend, the bullish pattern has not changed.
Gold has limited room for decline in the short term, and a sharp drop is unlikely. Today's market tends to adjust and correct first before continuing to rise. The adjustment is only short-term, and is more to give everyone enough opportunities to get on board. The focus of the market below is 3375-3360, with the target looking at yesterday's high around 3390-3395. A break is expected to extend to the 3400-3420 area.
🚀 BUY 3375-3360
🚀 TP 3390-3395

Gold fluctuates repeatedly. How can we avoid detours?Gold currently lacks sustained bullish momentum. The monthly chart has formed four consecutive upper shadows, indicating significant market pressure at high levels. Bulls are hesitant to take risks and lack the appetite for aggressive action, leading to a typical volatile pattern of rapid rises and equally rapid declines in gold prices. Yesterday's price action further confirmed this pattern. Although gold prices briefly reached a new high after bottoming out and rebounding, they were unable to consolidate above that level and subsequently retreated rapidly. Currently, the 3380-3390 area has become a key short-term resistance level, but repeated attempts to retest it have led to heavy selling pressure. Meanwhile, the 3370 area, a trading-intensive zone, poses significant downside risks for gold if it breaks below it, potentially extending the range to 3355-3340. Technically, resistance is concentrated in the 3380-3390 area, while support lies at 3355-3340. Short-term volatility is largely locked within this range. We recommend maintaining a volatile strategy of buying high and selling low.
Regarding trading strategies, we recommend placing short positions in batches within the 3375-3390 area, targeting 3360-3345. Pay attention to position control and stop-loss settings during this process. If the price rebounds to the support area and stabilizes, consider short-term long positions to flexibly respond to the intraday rhythm.
Correction first and then rise during the day, TP3400Yesterday, gold hit the bottom near 3350 and then quickly rose to break the high. It fell back slightly in the evening and closed with volatility. The daily line closed with a long lower shadow bullish line. The short-term correction process has been completed, and there is still momentum for an upward impact. The overall structure is still a bullish trend. Focus on 3365-3355 below. As long as the bullish thinking above this level remains unchanged, any decline will provide an opportunity to enter the market. The target can be around yesterday's high of 3390. Once it breaks through 3390, the gold price is expected to reach 3405-3415.
OANDA:XAUUSD

Gold continues to rise! Gold prices hit a two-week high!Market News:
In early Asian trading on Friday (August 8), London gold prices surged to $3,408, reaching a more than two-week high since July 23. Intensified global trade tensions and growing expectations of a September Federal Reserve rate cut have fueled risk aversion and demand for precious metals, providing strong support for spot gold. Geopolitical uncertainty has also fueled the rise in international gold prices. This recent rally in gold was primarily driven by Trump's renewed tariff campaign. Trump has officially imposed tariffs on goods from nearly 200 countries, with rates ranging from 10% to 50%. Meanwhile, signs of a slowing US economy are reinforcing market expectations of a shift to easing policy by the Federal Reserve. Gold's role as a safe-haven and inflation-fighting asset has been further strengthened. While there may be short-term technical correction risks, the overall market remains strong. Looking ahead, three major catalysts require close attention: potential fluctuations in policy expectations triggered by the Federal Reserve Chairperson's nomination hearing on August 21st, the specific implementation of retaliatory tariffs against the US by India and other countries, and potential energy market volatility following the Putin-Trump summit. Until these variables become clear, gold's price fluctuations around the $3,400 mark may become the new normal, but each pullback is likely to attract more safe-haven funds.
Technical Analysis:
Gold's technical outlook suggests a continued trend-buying structure, with the price fluctuating upward to reach a new monthly high of $3,409. The daily chart closed with a bullish cannonball pattern of two positives and one negative, maintaining a strong buy structure on both the daily and weekly charts. The RSI indicator is pointing upward above its mid-axis, while the 10-day and 7-day moving averages are opening upward, with the price converging within the upper middle Bollinger Bands. The Bollinger Bands on the short-term hourly and four-hour charts are also opening upward, with the price converging within the upper middle Bollinger Bands. The moving average system has formed a golden cross, with the price on the four-hour chart gradually moving upward from the low of the 10-day moving average. Gold continued to favor buying low during Friday's pullback, with resistance at key new highs supporting selling high. In the short term, there will still be some volatility, so we recommend avoiding buying high and selling low. A light position can be entered near support levels. Looking at the hourly chart, if it holds above 3385, it could head towards 3390 or even 3400. Strong resistance above remains near 3416. Current support is 3360, with volatility expected if it remains below. A break below could see yesterday's low of 3358 or even 3350. Strong support below is near 3330.
Trading strategy:
Short-term gold: Buy at 3367-3370, stop loss at 3359, target at 3390-3410;
Short-term gold: Sell at 3416-3419, stop loss at 3428, target at 3390-3370;
Key points:
First support level: 3370, second support level: 3358, third support level: 3345
First resistance level: 3400, second resistance level: 3416, third resistance level: 3428

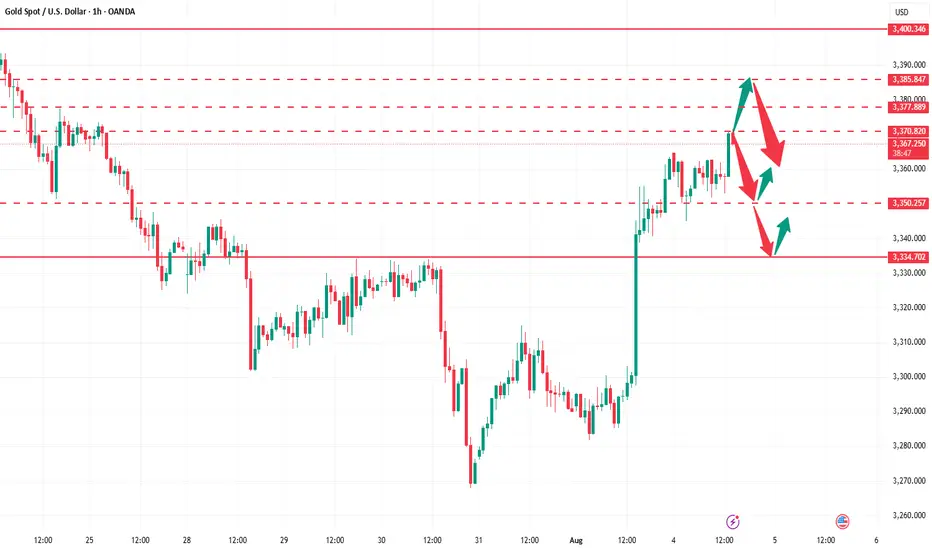
The shot at the critical moment is the real trading opportunityGold bottomed out and rebounded yesterday, breaking the high slightly to touch 3390 before falling back. The daily line closed with a small bullish cross overnight, and the upward momentum has slowed down. Today it tends to fluctuate at a high level. In the 4H cycle, the Bollinger band is closing, and the overall bulls continue to run upward. The big positive line directly pulls up, which is relatively strong. The overall market is resistant to declines. Therefore, the big cycle does not expect a big drop for the time being, but the short-term trend fails to continue further. It is safe to maintain a pullback and go long. Pay attention to the support below 3365-3350. Go long after it stabilizes. First look at yesterday's high of 3390. If it breaks, there is a probability of going to 3400 or even around 3415, but be careful of a high rush and fall.

What you see are fluctuations, what I see are opportunities!Gold prices are rising as expected, with long positions perfectly fulfilled and periodic profits successfully secured. Currently, prices are once again encountering resistance at 3390. A clear bearish engulfing pattern has formed on the short-term hourly chart, suggesting weakening short-term momentum and increasing risk of a pullback. From a cyclical perspective, today marks the fifth trading day of gold's rebound, and technically, a periodic adjustment is necessary. A break below 3370 today will essentially confirm the establishment of a short-term top, and the market structure may shift into a phase of decline. Regarding trading recommendations, we recommend continuing to short on rallies around 3390 as a key resistance level, with short-term targets focused on 3370-3360. A subsequent break below this level with significant volume could open up further downside potential. Market sentiment is shifting rapidly at this time, so it is crucial to strictly enforce risk management discipline, avoid blindly chasing orders, and maintain a flexible and forward-looking strategy.

Gold surges! Gold prices rise for four consecutive days!Market News:
Spot gold prices fluctuated narrowly in early Asian trading on Wednesday (August 6), currently trading around $3,380 per ounce. London gold prices continued their upward trend on Tuesday, with international gold prices continuing to rise, reaching a near two-week high. This marked four consecutive days of gains, demonstrating strong upward momentum. Amid rising market expectations for a Federal Reserve rate cut and Trump's upcoming announcement of key Fed appointments, gold's safe-haven and policy-sensitive properties have resurfaced, making it a prime target for capital inflows. The core logic behind gold's current rally remains centered around expectations of a shift in the Federal Reserve's monetary policy. Traders generally expect two rate cuts this year, with the first likely to occur in September. Several regional Federal Reserve chairmen have also signaled dovish sentiment, boosting gold prices. Furthermore, stable US Treasury yields and a weaker US dollar index have also bolstered gold's gains. Amidst weakening economic data, a shift in Federal Reserve policy, geopolitical tensions, and government intervention, gold has once again taken center stage in investors' attention. Whether it's short-term expectations of interest rate cuts, uncertainty surrounding the Fed's personnel, or the combined effects of medium- to long-term debt, policy, and global uncertainty, gold's dual attributes of "hedge and safe haven" continue to strengthen. Closely monitor expected changes in CPI data, progress in trade negotiations, and Fed appointments, and pay attention to speeches by Fed officials!
Technical Analysis:
Gold's technical outlook remains positive on both the daily and weekly charts, with consecutive daily gains. The price is trading within the upper middle Bollinger Band, with the 10-day and 7-day moving averages forming a golden cross. The RSI is trading above its mid-axis, and the MACD momentum bar is showing strong volume above its zero axis. On the short-term four-hour and hourly charts, the price is trading within the upper middle Bollinger Band, with the moving averages forming a golden cross and the RSI pointing upwards. The trading strategy remains unchanged: buy low on pullbacks, with selling high as a secondary strategy. Gold fell before rising yesterday, breaking through the intraday high during the US trading session and rising as high as 3390, closing with a doji with upper and lower shadows. As expected in the early review, the current trend shows no change in the buying trend, with the moving averages in a buying pattern. However, the four-hour chart is approaching the acceleration line, creating downward pressure. Therefore, it is in a short-term buying risk zone, and buying at high levels is no longer advisable! The hourly chart is flat, closing below the upper line. Although it hasn't broken below the moving average, the indicator has turned. Today's forecast is a repeat of yesterday's, with a correction followed by an upward trend. Therefore, the overall outlook is for a correction followed by continued upward movement!
Trading strategy:
Short-term gold: Buy at 3357-3360, stop loss at 3349, target at 3380-3400;
Short-term gold: Sell at 3390-3393, stop loss at 3402, target at 3360-3350;
Key points:
First support level: 3370, second support level: 3362, third support level: 3350
First resistance level: 3390, second resistance level: 3398, third resistance level: 3408

XAU/USD(20250806) Today's AnalysisMarket News:
The US non-manufacturing PMI fell to 50.1 in July from 50.8 in June, below the expected 51.5. The ISM New Orders Index fell to 50.3 in July from 51.3 in June, with export orders contracting for the fourth time in five months.
Technical Analysis:
Today's Buy/Sell Levels:
3373
Support and Resistance Levels:
3413
3398
3389
3358
3348
3333
Trading Strategy:
If the market breaks above 3389, consider entering a buy position, with the first target at 3398. If the market breaks below 3373, consider entering a sell position, with the first target at 3358.

Wait for a pullback and then test the previous high#XAUUSD
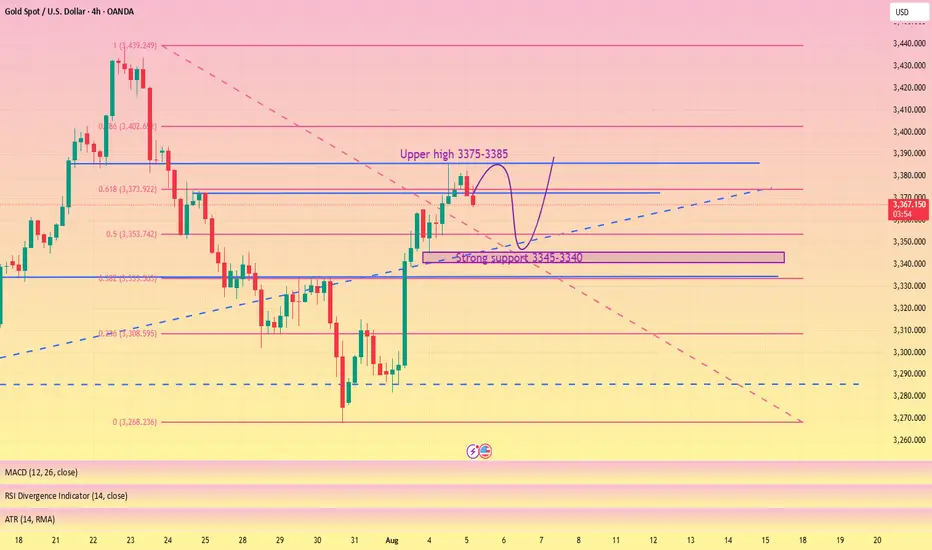
The gold market closed positively on the daily chart, with strong support near 3345-3340 below. The market trend is still dominated by bulls,🐂 but the daily moving average support is too far from the high point. It is not ruled out that it may retreat to the moving average support near 3345-3340,📊 and then rise again.🚀
From the monthly chart, 🌙although the monthly chart closed positive, the market is generally converging at a high level. Upper resistance remains, and a breakout is unlikely without breaking through this resistance level (no further discussion will be given).📉
Judging from the weekly chart, the Bollinger Bands have shrunk, and the MACD indicator has formed a death cross with large volume, indicating weak fluctuations at the weekly level.😩
Judging from the daily chart, 📊the current technical indicators are tending to the zero axis, and the rapid upward correction of the smart indicator indicates that the price fluctuation tends to rebound. The current focus is on yesterday's high around 3385. It is expected to break through 3430. The lower support Bollinger band middle track and moving average tend to stick together around 3346-3340.🌈
Judging from the hourly chart and 4H chart, 📊the overall rhythm tends to fluctuate and fall. The short-term pressure from above is around 3375-3385, and a break above will definitely lead to an increase.📈
On the whole, pay attention to yesterday's NY starting point near 3365-3360, and the strong support below is 3346-3340. The hourly and 4H charts tend to fluctuate and fall, so for short-term trading we need to short on rallies. 📉
Intraday trading suggestions are as follows:
1. Consider going long currently around 3365-3360📈, targeting 3374-3380🎯. If it breaks through, look for 3400.
2. Go long if it retraces below 3355-3340, targeting 3375-3385. Wait for further adjustments.🐂
3. If the price first reaches the resistance level of 3375-3385 and holds, consider going short with a small position and anticipate a pullback towards 3365-3355.🐻
In gold trading, timing is key!Gold has currently reached a high of around 3385. The technical retracement and correction is also an affirmation of the bulls, and the current support below will continue to move up. From the perspective of the large range of the daily line, there is no large unilateral trend, and the overall box consolidation pattern has been formed. It once rose to 3385 yesterday, but failed to stand firm, indicating that the pressure from above is still quite large. If it can break through 3400, the next target may be 3430; otherwise, it may start a round of deep adjustment. There is a need for technical adjustment, so it is not advisable to chase the rise too much. If your current operation is not ideal, I hope I can help you avoid detours in your investment. Welcome to communicate with us!
Judging from the structure of the 4-hour gold chart, the key support area below is around 3350-3340. If it falls back to this area and stabilizes during the day, you can continue to rely on this area to arrange long orders. The overall bullish thinking remains unchanged. The short-term resistance above is around 3375-3385. If it breaks through, it will further test the key suppression zone of 3390-3400. I will prompt the specific operation strategy at the bottom. I suggest you keep paying attention and follow up in time.
Gold operation strategy: Go long when gold falls back to around 3350-3340, with the target at 3370-3380.
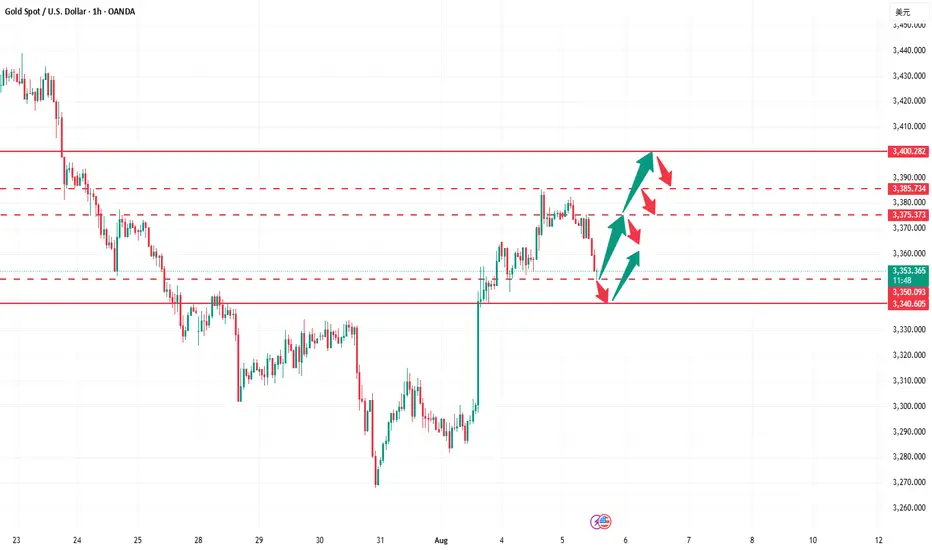
How to seize the best entry point for gold?Gold continued its bullish trend from last Friday, rising to a high of 3385 yesterday. However, the upward momentum failed to sustain, and new highs were not reached during today's Asian and European trading sessions. The short-term bullish trend has ended, and the market is showing signs of correction. Currently, gold is facing downward pressure in the short term, and the short-term trend is volatile. Strategically, we can watch for a rebound to the 3375-3385 area during the European trading session and try to participate in short-term short selling. The target is below 3365-3355. The long-term structure remains bullish. Therefore, if the price falls back to the 3355-3340 area and stabilizes, we can still consider entering long positions to continue the medium-term uptrend. In terms of trading, we should pay attention to the rhythm of the market, betting on rebound resistance with short-term short positions and then going long on dips, maintaining flexibility.

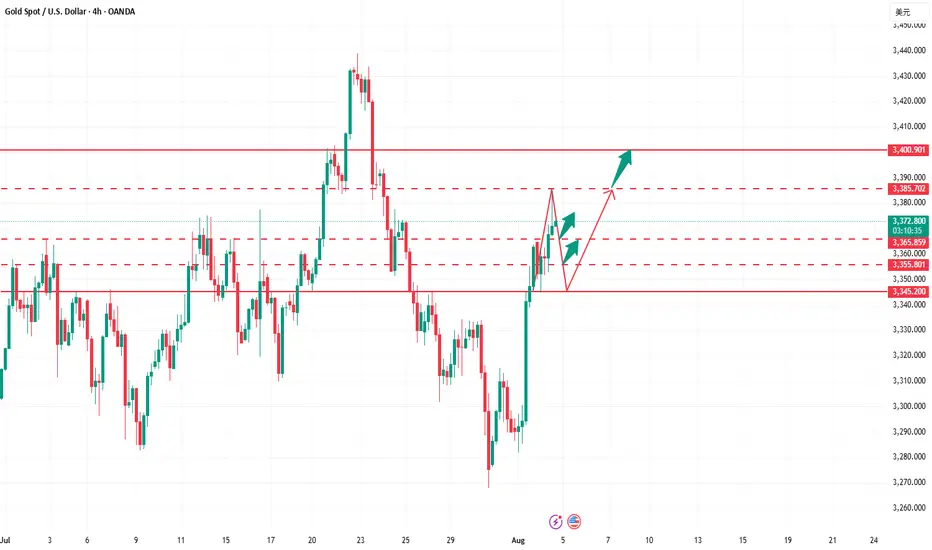
Go long on the pullback and head straight to new highs!Gold fell back and stabilized at 3345 yesterday, and continued to rise during the US trading session, reaching a high of 3385. The overnight daily line closed positive again, which is in line with our expectations, so there is still room for growth. We will continue to take a bullish approach today. In the 4H cycle, the Bollinger opening is in the stage of large volume, and the consecutive positive lines are rising steadily based on the moving average. The support below is 3370-3360, and the intraday watershed is at 3360. The operation is mainly to go long on pullbacks. First look at the pressure of the 3385 high point. If it breaks, continue to look at 3395 and 3410.
Gold operation suggestion: go long on gold around 3370-3360, and look at 3385 and 3400.

XAU/USD) Bearish Trend Read The captionSMC Trading point update
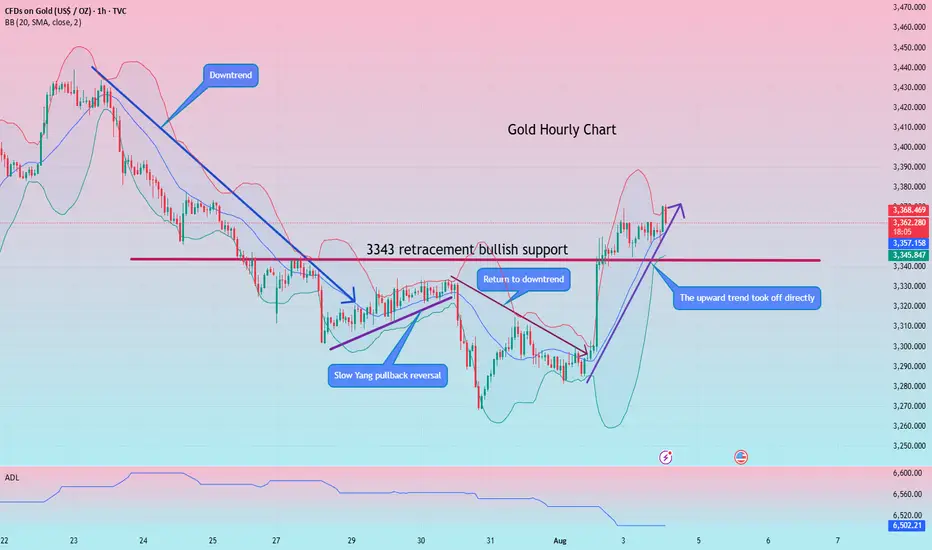
Technical analysis of Gold (XAU/USD) on the 1-hour timeframe, suggesting a potential short-term sell setup targeting a key support zone.
---
Analysis Summary
Asset: XAU/USD (Gold Spot)
Timeframe: 1H
Current Price: 3,371.56
Bias: Bearish pullback toward lower support
---
Key Technical Insights
1. FVG (Fair Value Gap):
Price tapped into a premium supply zone / FVG (highlighted in yellow at the top), showing rejection.
This zone likely acted as a liquidity grab, triggering potential reversal.
2. Structure Shift (SS):
Minor bullish market structure appears to be breaking down, signaling a shift in momentum.
3. Target Point:
Price is expected to revisit the support zone at 3,330.77, where prior accumulation and a bullish order block exist.
This also aligns with the 200 EMA around 3,340.48, adding confluence.
4. RSI (14):
RSI is currently at 54.86, indicating neutral momentum with room for downside.
---
Target Point
Target Zone: 3,330.77 (Key support and potential long re-entry area)
---
Trade Idea
Direction Entry Zone Stop-Loss Target
Sell 3,370–3,375 Above 3,390 3,330
Mr SMC Trading point
---
Summary
Gold is showing signs of short-term exhaustion after filling the FVG zone and is likely to pull back toward the 3,330 support area, making it a potential intraday short opportunity. The structure break, EMA, and RSI support this retracement.
Please support boost 🚀 this analysis)

How to accurately capture golden trading opportunities?Bullish trend is still the main trend of gold at present. After rising to 3368 at the opening today, it fell under pressure and fluctuated. Technically, it has tested the pressure level and needs to be adjusted. The overall high-level carrying capacity has also declined, so it is not advisable to chase the rise too much. In terms of operation, it is recommended to wait for the price to stabilize before buying more. Judging from the current gold trend, the upper short-term resistance is in the 3380-3385 area, and the key pressure is at the 3395-3400 line; the lower short-term support is in the 3365-3355 area, and the key support is in the 3350-3345 range. The overall suggestion is to arrange long orders on dips around the support area, and try to maintain a stable wait-and-see attitude in the middle position. I will prompt the specific operation strategy at the bottom, please pay attention in time.
Gold Trading Strategy: Buy in batches as gold retreats to the 3365-3350 area, targeting the 3380-3385 area. If this resistance zone is broken, hold and look for upward movement.
Gold rises for three consecutive days! Buy the dip or hold on?Market News:
Spot gold prices fluctuated at high levels in early Asian trading on Tuesday (August 5), currently trading around $3,380 per ounce. Driven by weak US economic data, rising expectations of a Federal Reserve rate cut, and intensifying global trade tensions, international gold prices continued their upward trend from last Friday, marking their third consecutive day of gains. Driven by expectations of a Fed rate cut, geopolitical risks, and a weakening US dollar, gold maintains strong upward momentum in the short term. From a medium- to long-term perspective, gold's investment value remains significant. Global economic uncertainty, ongoing trade conflicts, and the potential resurgence of inflationary pressures all provide solid support for gold. Investors should pay close attention to the US June trade balance and July ISM non-manufacturing PMI data, which will be released this trading day.
Technical Analysis:
Last week, gold closed with a long lower shadow, a bullish candlestick pattern. This is a clear sign of stabilization, and the price remains firmly within the middle band. This week, the upward trend may continue, with repeated attempts to test the resistance point derived from the lower band of the previous upward trend. This maintains a bullish outlook for the medium- to long-term trend, and represents a period of strength within this bullish trend. The daily short-term trend also remains bullish. The recent three-month consolidation period is a correction, with the lows gradually moving higher. The longer the sideways trend, the stronger the potential for a bull market continuation, both in terms of strength and timing, once it breaks higher. Last Friday, a strong bullish candlestick pattern formed at the bottom, stabilizing the 5-day moving average and returning to the converging triangle channel. This suggests a continued bullish outlook today. A pullback confirms support at the lower band of the converging triangle, approximately 3345-48, also the 10-day moving average. After testing support in today's Asian session, support is indeed present. Focus on the upper band around 3410.
Trading strategy:
Short-term gold: Buy at 3362-3365, stop loss at 3354, target at 3380-3400;
Short-term gold: Sell at 3407-3410, stop loss at 3419, target at 3370-3350;
Key points:
First support level: 3370, second support level: 3363, third support level: 3350
First resistance level: 3397, second resistance level: 3410, third resistance level: 3422

Gold is rising slowly, so can we adjust our direction?
When we first entered the market, we saw slogans everywhere, such as "Investing is risky, enter with caution." However, few people actually put this into practice. In the gold market, risk control comes first, followed by investment mentality, and finally, trading methods and strategies. Only by protecting your principal can you achieve profitability; otherwise, everything is just empty talk.
A logical explanation for gold's medium-term upward trend!
Gold rebounded sharply last Friday due to the weaker-than-expected US non-farm payroll report, and the market quickly adjusted its expectations for the Federal Reserve's policy direction, shifting to a more dovish stance. Although the market reaction seemed to indicate very weak data, the overall situation was not as bad as expected. The problem is that the market had previously bet on strong data, and pricing in a more hawkish outlook following the Fed's interest rate meeting has led to even weaker data, so even slightly weaker data could trigger a rapid repricing.
Next, the market's focus will turn to key economic data and speeches by Federal Reserve officials, particularly in the run-up to the September FOMC meeting. As long as incoming data remains benign, Fed Chairman Powell is expected to open the door to a September rate cut at the Jackson Hole annual meeting. From a broader perspective, gold is expected to maintain its upward trend as real interest rates are expected to continue declining. However, a short-term correction is still possible if interest rate expectations become hawkish.
A Gold Trend Perspective!
Unfortunately, gold prices only reached a low of 3350 today before rising again. With no signs of a pullback near the US market close, our bullish dip buying opportunity at 3343 is somewhat difficult to enter. It appears that the upward trend will continue to test the key resistance level of 3380. If there are no dip buying opportunities, consider shorting!
The current hourly chart has broken through the support level, leading to a choppy morning session. The upward trend is likely to test the resistance level of 3380, while the support level of 3350 is key today. For the time being, we will use this range for range trading in the evening session. If there are any further market fluctuations, we will provide a new strategy in real time!
Gold: Short around 3380-82, defend at 3390, target at 3352-55! If it retreats back to around 3350 but does not break through, you can enter a long position!
Why do you always miss the real opportunities?Judging from the current gold trend, gold rose to a high of around 3368 and then entered a narrow range of fluctuations. Our previous long plan failed to continue to hold at the high level. Although some brothers may feel regretful, the market is always full of variables. We must flexibly adjust our thinking according to market changes. At present, there is a need for a retracement on the technical side. This retracement is not a trend reversal, but provides space for subsequent bullish momentum. Overall, the bullish trend is still dominant, but the current price is approaching the important pressure area of 3370-3385. The short-term carrying capacity has weakened, and it is not advisable to chase highs blindly. It is recommended to be cautious at high levels in operations. In the short term, it can be given priority to try to intervene with short positions in batches in the 3370-3385 area, waiting for a technical correction. If it subsequently retraces to the key support area of 3350-3335 and stabilizes, you can consider the long position layout again and continue to participate in the main bull trend.
Gold operation suggestion: short in batches in the 3370-3385 area, with the target at 3355-3350. If it falls back to the 3350-3335 area and stabilizes, consider entering a long position at the right time.