Gold's decline under pressure is in line with expectations! Gold market trend analysis:
Gold technical analysis: This week, gold prices fluctuated, opening at 3332. So far, the high is 3500 US dollars and the low is 3260 US dollars. On Monday, it soared by 100 US dollars. On Tuesday, it continued to rise to 3500 highs in the Asian session and then fell back. On Tuesday and Wednesday, it plummeted by nearly 240 US dollars. The volatility slowed down on Thursday. The overall intraday fluctuations remained within 3367-3288. Today, the weekly line closed. The weekly line will compete for the closing of the Yin-Yang cross K line. The short-term is more intense. From the consolidation on Thursday, there is no further decline, which also leaves room and suspense for today's weekly closing. If the weekly line closes lower, it is expected to adjust further next week. Pay attention to the closing strength and weakness of the weekly K line this week.
Today's opening trend of the gold market is like yesterday. The Asian session started the upward mode, rising all the way to around 3370 US dollars. However, it encountered strong resistance here, and then turned downward and started a decline. It is worth noting that today's gold price not only failed to break through this key resistance level, but also fell below the low hit in yesterday's European and American sessions, falling to a low of US$3,287 before rebounding.
In view of the important trend of gold price breaking the key point, the market will most likely continue the short-selling idea in the future. From the current market structure, the position of $3260 has become the focus of the market. Investors need to pay close attention to whether the gold price can reach or even fall below this point. Once it effectively falls below, the short-selling trend will be further strengthened, and the market may usher in a deeper adjustment.
From the hourly level, yesterday's low was at $3306, and the rebound just now showed an obvious stop signal at this position. Based on this, the current short-term suppression level can refer to $3315, and the upper level is $3328. For short-term investors, you can consider waiting for the gold price to rebound to around $3315 to arrange a short order and continue to be bearish on the gold price. The first thing to pay attention to below is the support of the low point just touched at $3287. If this support level is lost, the next key support level will be $3260, the first low point on the previous downward journey. If $3260 is also effectively broken, the short-selling force will be further released, and the gold price may face a larger decline. On the whole, today's short-term operation strategy for gold is to short on rebound and long on pullback. The upper short-term focus is on the 3315-3320 resistance line, and the lower short-term focus is on the 3285-3260 support line. Friends must keep up with the rhythm.
Gold operation strategy reference: short gold rebound near 3310-3320, target near 3290-3285, break to see 3260 line.
Gold pullback near 3270-3260 long, target near 3290-3310, break to see 3330 line.
Goldpreis

Falling into range oscillation, just get the rhythm pointAnalysis of gold market trend
On Thursday, the gold price remained in the 4H channel, and the middle and lower tracks were in the range of 3370-3260, with overall resistance to decline and correction; this trend is also normal;
1: In the early stage, the market fluctuated rapidly with a hundred points rise and fall, and the kinetic energy consumption was large, so the short-term trend returned to the consolidation trend later;
2: The fundamentals stopped, the technical demand was corrected, and the two resonated, and the gold price could only fluctuate and consolidate in the range; the analysis framework given yesterday was treated according to two intervals; they were 3370-3260 and 3370-3480; the strong and weak dividing point was 3370 above and below;
We can also see that at the position of 3370, the gold price has been under pressure for 2 consecutive times and fell for 2 consecutive times; it can be seen that the strong and weak dividing point of the position above and below 3370!
At present, the market:
1: Trend: There is no trend for the time being, and the range is high, the large range is 3480-3260; the bull trend is stagnant, and the bear trend stops falling. The trend cannot be judged for the time being;
2: Fundamentals, the future fundamentals will focus on the US debt crisis, trade war tariffs, and subsequent war issues, two core things; and uncertain fundamentals
Today's market:
1: 4 hours, the stochastic indicator golden cross, the main long signal; in terms of form, slow bull rise; the current pressure position of the central axis is near 3370, and the probability of breaking upward is relatively high; therefore, the 4-hour can be treated as a shock rise; but the overall situation remains in the large range of 3480-3260!
2: In the daily K-line, the stochastic indicator diverges periodically, and the death cross is downward, which is a bearish signal; however, the high-level sell-off forms a sideways resistance to the decline, and the sideways support is in the range of 3280-3260; the MACD double-line golden cross is glued, and there is no death cross; the indicators in the daily K-line are contradictory, so the long and short trends are difficult to continue, and more range oscillations and high-level consolidation signals are given;
To sum up: Today's short message is still processed according to the 4-hour range; 3370-3260 range and 3370-3480 range; if it stabilizes at 3370, the range processing will be changed; you can take a pullback to do more, and bet on the 4-hour range oscillation upward, and gradually break through the position of 3370;

Gold remains volatile, good opportunity for two-way operation
💹Fundamental analysis
Recently, many Fed officials have called for patience.
Regarding tariffs, they have repeatedly emphasized that although the increase in import costs has pushed up prices, the high prices are caused by shrinking consumption, declining employment and shrinking family wealth.
The final inflation increase may be lower than market expectations.
Is the current Fed in a dilemma?
On the one hand, we need to guard against economic downturn, and on the other hand, we need to be vigilant about inflation caused by tariff policies.
📊Comment analysis
On Thursday, the gold price rose rapidly to $3,365 in the Asian session, and then the European and American sessions were dominated by fluctuations. The current market fluctuations are not large, mainly based on corrections. This is also a temporary rest since the gold price plummeted from $3,500, giving everyone the opportunity and time to reorganize their ideas.
In addition, gold hit $3,370 again in the Asian session today. Recently, the Asian session is obviously larger than the European and American sessions. The main fluctuations are collectively in the Asian session. Whether this rebound will form a reversal depends on the breakthrough of $3,385. The bull market in the big direction has not encountered a breakout. What we need to pay attention to every day is the current intraday fluctuations, not the medium- and long-term layout.
💰Strategy Package
Long position:
Actively participate at 3,300 points, with a profit target of around 3,340 points
Short position:
Actively participate at around 3,360 points, with a profit target of around 3,320 points
⭐️ Note: Labaron hopes that traders can properly manage their funds
- Choose the number of lots that matches your funds
- Profit is 5-10% of the fund account
- Stop loss is 1-3% of the fund account

How to break through the gold shock patternOperation suggestionsTechnical analysis of gold: The current gold price is in a stalemate stage of long-short game. On the one hand, the path of the Fed's easing policy has been basically clear, and the US dollar is facing correction pressure; on the other hand, the stable global risk sentiment and the strong performance of the stock market have weakened the attractiveness of gold as a safe-haven tool. The repeated signals of global trade negotiations have also made the market direction unclear. From a technical point of view, gold has received support after the correction to the 26.3% Fibonacci retracement level near 3317 this week, and has returned to above $3,300 in the short term. The upper resistance focuses on the position of 3380. Once it breaks through, it will open up the space leading to the 3400 mark.
From the daily chart of gold, yesterday's gold price fell sharply and recorded a large real body Yin line K-line pattern. The peak pattern of the previous price high is more obvious, suggesting that the upper pressure effect is strong. The MACD indicator double line began to turn downward, increasing the risk of further correction in the short term. However, the MA5 and MA10 moving averages have not turned downward yet. You can pay attention to the support and defense of the moving average. From the 4-hour gold chart, the gold price has been fluctuating and falling since it came under pressure at the 3500 level. The current price has fallen back to the 3260 level, with a short-term decline of 240 US dollars. Although there has been a rebound during the day, the upward trend has been destroyed. The MACD indicator has issued a dead cross signal, suggesting that the correction trend may have started.
Gold fell after rising in the Asian session, and fell below the support levels of 3351 and 3330. Now the market rebounded near 3314, which is also in line with our analysis of the long and short trends. In the big trend, the gold rally did not exceed 3380, so there is still a downward demand, that is to say, it can only be regarded as a rebound during the decline. In the short term, this wave of gains stopped at 3367. Now it broke through 3351 and pierced 3316 to rebound. The main focus on the upper side is the support-to-resistance level of 51, followed by 3342. Specifically, you can wait for the area near 3345 to go short and see the gold price break the previous rebound low of 3314 to 3300. If it breaks down effectively, you can move the protection loss down to see the position of the rebound turning point of 3283 and 3260. On the whole, the short-term operation strategy of gold today is to short on rebound and long on callback. The short-term focus on the upper side is 3350-3370 resistance, and the short-term focus on the lower side is 3300-3280 support.

Gold fluctuates and is under pressure, the trend is bearish!Gold market trend analysis:
Gold technical analysis: Gold fell by $240 in two trading days, but the rebound was also very strong, from yesterday's low of 3260 to 3367 in the early trading. The current volatility is still large, and the high and low points of $100 often appear. It is normal to fluctuate by dozens of dollars at random. So pay attention to the market. There is no shortage of opportunities. Just grab what you can grasp.
From a technical perspective, yesterday's closing was negative, slightly piercing the MA10 moving average, and losing the trend support line mentioned yesterday. Originally, today's technical theory should continue to be under pressure from the MA5-day, and the rebound confirmed that trend line, which can continue to be bearish, that is, 3338-40; but today's Asian session saw a strong wave of upward rush, reaching 3367 directly, which was quite unexpected. It was basically stimulated by short-term risk aversion news, and then it began to rise and fall, and then returned to below 3340; as long as the closing cannot break through and stand above the MA5-day resistance, it is still in a downward adjustment; today, it is still bearish, and the gold layout long orders were successfully harvested at 3316. Gold rebounded to 3343 and continued to be short. Gold fell again and harvested, and won two consecutive victories again. At present, the gold rebound is limited, and the US market rebound is still short.
Gold's 1-hour moving average has formed a dead cross, so the moving average has not turned upward, so there is still downward momentum, and the rebound can continue to be shorted. After the Asian session hit a high and fell, gold rebounded several times and fell back under pressure near 3345. The US session rebounded below 3345 and continued to be shorted. It can still be shorted near the rebound of 3340. At present, gold is just a rebound. If there is no special risk-averse news, it is still difficult to go up directly. At least it must fluctuate first, and it is still bearish and volatile now. On the whole, the short-term operation strategy for gold today is to short on rebounds and to go long on pullbacks. The short-term focus on the upper side is 3368-3370 resistance, and the short-term focus on the lower side is 3260-3285 support. Friends must keep up with the rhythm.

Gold still has the risk of adjustment in the short termAnalysis of gold market trend:
From the daily level, gold rose strongly during the trading session on Tuesday, touched the key price of 3500, then fell under pressure and finally closed with a negative line. This trend of rising and falling shows that the selling pressure from above is heavy, and the bulls are strongly blocked by the bears at high levels. Then, gold continued to fall on Wednesday and closed with a negative line again, forming a technical pattern of two consecutive negative lines. This continuous decline further confirms that the short-term bears are dominant.
From the 4-hour gold chart, the gold price has maintained a fluctuating decline since it was under pressure at the 3500 line. The current price has fallen back to the 3260 line at its lowest, and the short-term decline has reached 240 US dollars. Although there has been a rebound during the day, the upward trend has been destroyed. The MACD indicator double line has issued a dead cross change signal, suggesting that the callback trend may have started. Pay attention to the pressure effect of the 3368 line during the day. For the current market, the rebound is just a flash in the pan, and it rebounded sharply again, reaching the highest point near 3367 and then retreated. It is currently maintained near 3330. In fact, the market is actually at a loss for long and short positions, and is simply unable to withstand its huge shocks. For the Asian session's highs and falls, we support it according to the shock retracement. For example, if the European session rebounds again near 3358-60, we will continue to try to short, with the target at 3320-10, and a loss of 3370. The market amplitude is so drastic that I need to strictly implement good operating habits, try with a light position, strictly stop loss, and don't have a fluke mentality! On the whole, today's short-term operation strategy for gold is to rebound and short, supplemented by callbacks. The short-term focus on the upper side is 3368-3370, and the short-term focus on the lower side is 3260-3285. Friends must keep up with the rhythm.

US policy news triggers huge shock in gold Analytical StrategyThe short-term 4-hour middle track 3380 line has been lost, becoming a key counter-pressure point. As long as the price cannot stand on this position again, it will maintain a downward correction trend. If it falls below 3292, the gains and losses of the 66-day moving average 3260 will be concerned. The 1-hour level K line is under pressure from ma10 and ma5 and continues to fall. After last night's consolidation and pull-up, the current K line has re-run above ma10, and at the same time, macd forms a golden cross below the zero axis. This wave of 200 US dollars of rapid exploration has almost corrected most of the overbought situation. If the price continues to fall, or with the help of bottom divergence, it will slowly brew a short-term bottom. Today's gold rebound reminds that attention should be paid to the resistance below 3340, and the limit is below 3356. If it is not under pressure, it will still be bearish adjustment. Strong support is at 3260 or 3245. After the position stabilizes, it will begin to consider bottom-fishing. For today's short-term operation of gold, it is recommended to focus on rebound shorting and supplemented by callback longing. The short-term focus on the upper side is 3350-3370 first-line resistance, and the short-term focus on the lower side is 3300-3280 first-line support.

Gold------Buy near 3310, target 3360-3387Gold market analysis:
Gold has been bought and sold back and forth in the past two days. We need to follow the trend and the rhythm to make a profit. Yesterday, the buy order of gold we arranged was hit, and then the trend changed immediately to follow it. We arranged to sell at 3323, 3326 and 3337 to make a profit. Today's gold is expected to be washed out. Buying is not continuous, and selling is not continuous. If the rhythm is not controlled well to chase the rise and fall, it will also be washed out of the market. In the short term, we need to find opportunities in the 15-minute chart and the 30-minute chart, so that it is easy to follow it. From a large cycle perspective, the long-term trend of gold is still buying, and the weekly buying pattern has not changed. If there is no accident, gold will continue to hit new highs in the later period. In the later period of these two days, we need to watch more and do less to avoid market risks.
Pay attention to the small support and cycle position near 3310 in the Asian session. If this position stabilizes above 3300, it will rise again. Buying will see the suppression of 3387. There is a technical big step back near 3387. We estimate the space of 3300-3387 in the Asian session. Find the rhythm. If it stabilizes, buy it again. If it breaks 3310 and rebounds, sell it and see a new decline. The selling target will see the previous low point near 3326.
Support 3310-3300, pressure 3362 and 3387, the strength and weakness watershed of the market 3330
Fundamental analysis:
Trump's sudden change of style has caused gold to plunge all the way, and the European and American markets have risen sharply. In the short term, it suppresses gold and in the long term, it suppresses the US dollar.
Operation suggestion:
Gold------Buy near 3310, target 3360-3387

Gold may continue to fall in the short term
Trading sometimes does require some luck, but in the long run, good luck and bad luck will offset each other. To continue to succeed, you must rely on skills and apply good principles. Always remember; "Trading gold: half science, half art, all discipline."
📌 Driving events
The continued uncertainty of President Donald Trump's tariff policy and its broader impact on global economic growth have exacerbated market anxiety. These factors have triggered a new wave of safe-haven demand, pushing investors back into the gold market.
📊Commentary analysis
Gold prices are still facing selling pressure and are consolidating below the downward trend line. Trading prices are around 3,300 or lower.
💰Strategy Package
Short position:
Participate around 3320-30 points, profit target around 3290-80 points
⭐️ Note: Labaron hopes that traders can properly manage their funds
- Choose the number of lots that matches your funds
- Profit is 4-7% of the fund account
- Stop loss is 1-3% of the fund account
Is the gold price rally over?Market news:
In early Asian trading on Thursday (April 24), spot gold rebounded sharply and is currently trading around $3,355/ounce, supported by bargain hunting. London gold prices continued to fall from record highs on Wednesday, falling nearly 3% to a low of $3,260/ounce, a stunning plunge. U.S. President Trump's remarks not only appeased investors and encouraged risky assets, but also hit international gold. Due to the possible easing of tensions between China and the United States, and U.S. President Trump's statement that he does not intend to fire Federal Reserve Chairman Powell, risk appetite has improved, the overall financial market atmosphere has improved, and the U.S. dollar has also rebounded from Trump's criticism of Powell for not cutting interest rates for several consecutive days. This has suppressed gold prices. After gold prices were blocked and fell back at the 3,500 mark, more short-term long profit-taking also dragged down international gold prices. This trading day will release the initial monthly rate of durable goods orders in the United States in March and the number of initial jobless claims in the United States as of the week ending April 19. Investors need to pay attention to them. In addition, they need to continue to pay attention to relevant news about the international trade situation and geopolitical situation.
Technical Review:
Gold Since 2025, the bull market of gold has been obvious. In just one quarter, it has reached the 3500 mark, and the increase has jumped by about 30%, which further illustrates the severe global economic situation and the risks brought by regional political turmoil, thus prompting investors to choose to buy gold to avoid inflation! After the gold white plate fell yesterday, the European plate continued to adjust widely, and the long and short battles were obvious. Subsequently, the short-term correction continued to intensify. The United States was afraid of breaking down again to 3260, the largest correction from the recent high! As time goes by, Huang is facing the closing of the monthly and weekly lines today. In the short term, we believe that the correction is likely to end soon, and there will be another pullback at any time. Pay attention to the 3380 inflection point for the pullback, and the inflection point breakthrough will be tested again at any time! At present, from the market, we can clearly see that the long-term gold bull market is not reduced. The short-term correction may be for better stretching later. Therefore, we should pay attention to the correction strength in the short term. From the 4-hour chart, the current long MACD of Huang Jin is gradually decreasing, and it is about to switch to short position. However, the KDJ indicator signal bottom divergence, and the big golden cross is expected. Obviously, the most important thing is to look at the Asian market trend and the closing of the next white market of gold!
Today fenxi:
The gold daily line fell by 240 US dollars in a row. At present, 3500 is temporarily under short-term pressure. Whether the adjustment is over or not is still uncertain. The short-term 4-hour middle track 3380 has been lost and has become a key counter-pressure point. As long as it does not stand on it again, it will maintain a downward correction. After breaking 3292 below, it is the 66-day moving average of 3260 to see the loss! The 1-hour K-line was under pressure from ma10 and ma5, and continued to fall. After last night’s consolidation and pull-up, the K-line is now running above ma10 again, and the macd is under the zero axis. This wave of 200 US dollars’ rapid decline has almost corrected most of it. If it continues to fall, or with the help of bottom divergence, it will slowly brew a short-term bottom! Today is also a critical day for gold. After the bottom of 3260, will the adjustment end and continue to rise, or will it just rebound? Then today’s strength is very important. If gold continues to rise directly today without a major correction, it means that gold may start to fluctuate and rise again.
Operation ideas:
Short-term gold 3315-3318 buy, stop loss 3306, target 3360-3380;
Short-term gold 3387-3390 sell, stop loss 3400, target 3320-3330;
Key points:
First support level: 3326, second support level: 3300, third support level: 3288
First resistance level: 3350, second resistance level: 3376, third resistance level: 3400

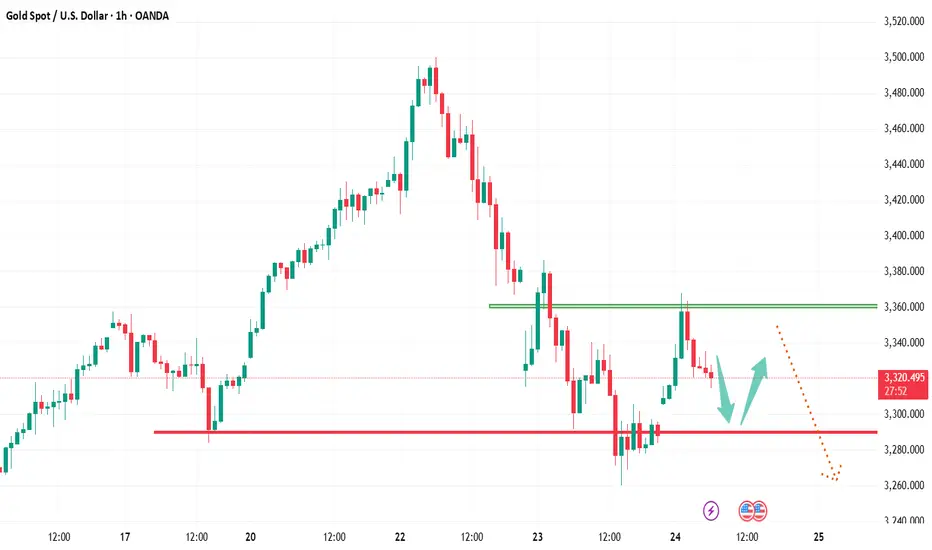
Gold peaked and plummeted, entering a correction mode!Analysis of gold market trend:
Technical analysis of gold: Today, the highest price of gold is 3386, and the lowest price of US market is 3260, which is also a drop of 126 points. Although gold has continued its decline, it is not like yesterday. The decline is accompanied by a rebound. The trend of Asian market is a back and forth, and the trend of European market is also a back and forth. Needless to say, the US market fell after the opening and the current rebound, the overall rhythm is bearish, but it is not as clean as Tuesday. This trend reflects the opposition of market sentiment. After the risk aversion subsided, the gold price fell from the high of 3500, but after the long position was sold at a high level, some people still took over at a low level, so it led to a rebound trend after the decline.
Now from the daily chart, the daily K is likely to close with an upper shadow line as on Tuesday. Now the upper shadow line has been formed, so the closing price should be below the opening price of 3320. Now we need to pay attention to whether the lower shadow line can continue to spread downward. In other words, after this wave of rebound in the US market, there will be another wave of decline, and there will be a small rebound; returning to the short-term trend, in 1 hour, after the gold price fell below the two key positions of 3356 and 3285 today, the support moved down to around 3245. Although there was a rebound in the US market, it is likely to go to the range of 3228 to 3245 before rebounding, so the support references are 3260 and 3245; on the other hand, the resistance level, now the gold price pierces 3285 and then rebounds, and is now trading near this. The only reference is 3315 in the Asian session, and then up is the European session rebound high of 3340. If it is effectively crossed here, the bearish outlook will be suspended.
The direction of the end of the session is bearish. The steady operation is to intervene in short orders near 3320 to protect the area near 3330. Of course, you can intervene in short orders near 3310 to see if it can reach the range of 3260 to 3245. This is up to you. Even if it touches this range and rebounds later, I do not recommend participating in long orders. Overall, today's short-term operation strategy for gold is to focus on rebound shorting. The short-term focus on the upper side is 3315-3320 line resistance, and the short-term focus on the lower side is 3260-3245 line support. Friends must keep up with the rhythm.

The rise of the US dollar index suppressed gold.From the perspective of technical analysis, the gold daily chart shows a large negative line pattern and then forms an inverted hammer reversal prototype structure. Today, the key support level below has moved down to the 3300 integer mark area. In the US hourly chart cycle, after the gold price short-term touched the price of 3290 US dollars/ounce, the technical indicators showed oversold repair characteristics, suggesting the existence of technical rebound momentum. The upper resistance level of the current price range is locked in the 3350-3360 US dollars/ounce area, and the core defense level below is still 3300 US dollars/ounce. I think if this support level is effectively broken, it may trigger a technical bottoming out of the price in the 3250 US dollars/ounce area.
It is worth noting that the US dollar index has a short-term technical retracement. This kind of currency market fluctuation may provide a phased rebound support for the gold price through the exchange rate transmission mechanism. However, we need to be alert that the gold price has fallen below the 23.6% Fibonacci retracement level of the upward trend started from $2,900/ounce. If the 38.2% retracement level of $3,289/ounce is confirmed to be lost, it may trigger the resonance of technical stop loss orders and programmatic trading systems, forming further selling pressure. The current market structure shows typical characteristics of long-short game. It is recommended to pay close attention to the significance of gains and losses of $3,300/ounce for trend judgment.
Operation strategy: 1. It is recommended to short gold when it rebounds around 3,310, with the target at 3,290.3250

How is gold going? What to do now?After reaching the psychological high of $3500, it entered a correction phase, which was also affected by the slight easing of the US-China tariff conflict...
After failing to hit the 3250 area of concern, gold prices will be slightly stronger. Meanwhile, the market is looking forward to the US PMI data. Earlier, gold prices hit an all-time high of $3500, but fell back on hopes of a easing of the US-China trade war and the US Treasury Secretary's remarks about a possible "detente".
The dollar recovered in the correction, but investors doubted Trump's predictability and gold prices began to pull back at this time. The focus is on the S&P Global PMI index: the results of this index may affect expectations for the federal funds rate and bring a new direction to the market.
From a technical point of view, gold prices are in a correction and confirm the bearish structure. But any unexpected remarks from Trump may attract a lot of buying.
Quaid data analysis:
Upward resistance: 3340, 3360
Downward support: 3280, 3250
Quid believes that buying can be considered when retesting the support level or closing above 3370.
Traders, do you agree with Quaid's idea? Please leave your thoughts. I'll be happy that way.

Gold shorts are rampant! Can the 3300 mark be maintained?Yesterday, the international gold price fell from 3,500 USD/ounce to 130 USD, breaking through several important support levels. As of today, the lowest price reached 0.328, around 3291, which has given up all the gains this week. Focus on 0.382, 3291, within the day. If there is no break, the bulls will resist. After the break, the bears will continue to attack and look at around 3243-3228.
Spot gold today's operation strategy and key points analysis
Core view: The daily pressure adjustment continues, pay attention to the effectiveness of 3293 support in the short term, and the 3228-3240 area may become the end point of the adjustment;
The rebound is mainly high-altitude, pay attention to the 3340-3356 resistance area, and maintain a bearish outlook before stabilization;
1. Spot gold intraday operation plan
Resistance and short-selling area
Rebound: 3340-3356-3471 (4-hour middle track and MA5 daily resistance golden section 0.236)
Strategy: If the rebound is under pressure near 3340 (hourly chart K-line closes negative or stagflation signal), try shorting with a light position, stop loss above 3358, and target 3293-3280.
Aggressive short order: If the rebound is unable to break through 3335 (MA10 hourly moving average), you can enter the market in advance.
Support and potential bottom-picking area
First support: 3291 (Daily MA10 382 retracement)
Observation signal: If it rebounds and recovers 3291 after a rapid decline, you can short (light position), stop loss 3285, target 3340.
Strong support area: 3228-3240 (50% retracement, previous starting point)
Strategy: When it touches around 3228 for the first time, combined with bottom divergence or long lower shadow, try long with light position, stop loss 3210, target 3280-3300.
Breakthrough market response
Unexpectedly break through 3358: If the hourly chart closes at 3358, short orders will be temporarily exited, pay attention to the counter-pressure of 3380 (4-hour middle track), and short orders can still be tried.
Potential opportunities for bottom-picking in the market: focus on 3240-3228-3167
IV. Summary
Main idea: rebound high and high, focus on 3340-3356-3371*, if it does not break, continue to adjust;
Bottom-picking opportunity: wait for the stabilization signal in the 3228-3240-3167 area, and it is safer to trade on the right side;
Short-term trading depends on the system, and the market depends on the level. Short-term trading is high frequency, fast in and fast out. It is obviously impossible to pursue a high success rate in this model. Therefore, it can only rely on the system to win. There is a clear trading system, stop loss and stop profit system and risk control system. As long as these are done well, short-term trading can also make money. Moreover, short-term trading is a compulsory course for every trader. The market is the core of the real path to profitability, leapfrogging and successful trading, which requires considerable accumulation and precipitation, including the accumulation of mentality, funds, and technical level, and the market is also the path that every trader must reach and must eventually reach and move towards.

3280 becomes the key for bulls!The previous surge in gold prices was mainly due to the market pricing of "stagflation" risks, but as this risk is gradually eliminated, gold may experience a significant correction, especially considering that "long gold" has become one of the most crowded trades in the market, and its parabolic rise is an obvious signal.
From a larger cycle perspective, gold is still in an upward trend, because the actual yield may continue to decline under the background of the Fed's easing policy. But in the short term, if the good news about tariffs continues to be released, the price of gold may fall further, and the market will adjust according to the new environment.
Views on gold tonight!
In fact, the market has a warning for today's retracement. After all, yesterday's closing line was a big negative line, so there must be a continuation in the trend of gold. Moreover, after yesterday's gold rose to the 3500 line, the trend weakened, and the market fell all the way to break the 3400 mark and the 3300 mark, and fell to the lowest 3290 line! To be honest, this round of decline is still quite strong. After breaking the continuous positive, the market ushered in the suppression of the market retracement, and at present, there is still a trend of continuation! In my opinion, the key entry point for long orders today is the previous starting point of 3280. The short-term retracement of gold is obviously continuing, and in the medium and long term, gold is still bullish. So our entry point is actually relatively simple. When it retreats to 3280, we can directly enter the market. There are still many opportunities for long orders. The retracement is not the peak!

GOLD UPDATEHello friends
As you can see in the picture, everything is clearly defined.
After a strong rise, we see a double top pattern at the top of the channel, which indicates that we should gradually wait for a correction.
Now, how far will the correction continue? In the picture, we have identified the support levels that the price can reach.
*Trade safely with us*

Trump sends out a major signal of tariffs, gold prices plummet
📌 Driving events
On Tuesday evening, local time, US President Trump said that he had no intention of firing Federal Reserve Chairman Powell. Trump also said that tariffs on Chinese imports would be "substantially" reduced from the current 145%.
In addition, Trump said that he would not take "tough measures" against China during the tariff negotiations, and was "optimistic" that he could reach an agreement with it "fairly quickly" and "substantially reduce" the huge 145% tariff imposed on Chinese imports.
Because of President Trump's erratic tariff policy changes, investors' confidence in the outlook for the US economy continues to weaken.
📊Commentary analysis
The slowdown and decline in gold prices are inevitable. The profit-taking mentality and the cooling of news on tariffs and Russian-Ukrainian military operations led to a decline in gold prices.
💰Strategy Package
Short position:
Actively participate at 3350 points, profit target is around 3290 points
⭐️ Note: Labaron hopes that traders can properly manage their funds
- Choose the number of lots that matches your funds
- Profit is 4-7% of the capital account
- Stop loss is 1-3% of the capital account

The gold market suddenly "changed its face"Gold plunged down from the high of 3500 yesterday, mainly due to the fact that US President Trump said at the swearing-in ceremony of Atkins, chairman of the US Securities and Exchange Commission, on Tuesday local time that he had no intention of firing Fed Chairman Powell, although he was disappointed that the Fed did not cut interest rates faster. The cooling of risk aversion directly affected the gold price, which once fell to $3366, and then closed near 3382, with the largest drop of 134 points on Tuesday. This wave of gold correction is still continuing. After opening today, it fell straight to 3315. Although it has completely recovered the decline, I think the short position still has continuity, so today's operation strategy is still mainly high-altitude.
Gold is currently trading below 3357. There are signs of a rebound in gold prices at the beginning of the European session. Now the upper suppression level can be moved down. The short-term suppression reference is 3330 here, followed by the second highest point on the way up to 3357; the lower support focuses on the vicinity of 3285, and after effectively breaking it, it can focus on the vicinity of 3245. Now the gold price is trading near the Asian low of 3315. The prudent operation idea is to short at 3331 to protect the gold price near 3320 and wait for the gold price to reach 3285. After the break, wait for the rebound to 3300 and then go short to 3245. It is not recommended to participate in long orders.
Gold is down 100 points, but it still remains high and short.Technically speaking:
① Yesterday's daily line hit a high and fell back to close with a hanging neck line with a long upper shadow, which represents a short-term peak signal. Today's opening opened low and rebounded to repair the gap, which can determine the bottom support in the short term. Therefore, today's range has become a large range of 3313-3500.
From the daily Fibonacci retracement extension line, the current support is around 3291, that is, the range of 3291-3371, and the middle 0.236 is located at 3370.
②The 4-hour indicator macd is dead cross at a high level and runs with large volume, and the smart indicator sto is running near oversold, which means that the 4-hour market is still volatile and weak. In the short term, pay attention to the middle track and the moving average MA5 and MA10 corresponding to the 3403-3358-3404 line, and the short-term moving average MA30 corresponds to the 3350 line. From the 4-hour perspective, the current range is 3291-3371.
③ The current MACD of the hourly line is dead cross with shrinking volume, and the dynamic indicator STO is hooked upward, which represents the rebound trend of the hourly line. At present, we focus on the MA60 moving average, the middle track and the MA30 moving average, which currently correspond to the 3397-3354-3405 line, but will gradually move down over time.
In summary: short-selling in the area near the upper pressure of 3321-3351-3371, and maintaining high altitude as the main theme
Summary: In the short term, the high altitude callback is the main focus, and the key support level is arranged in batches for long orders to follow the long-term trend.

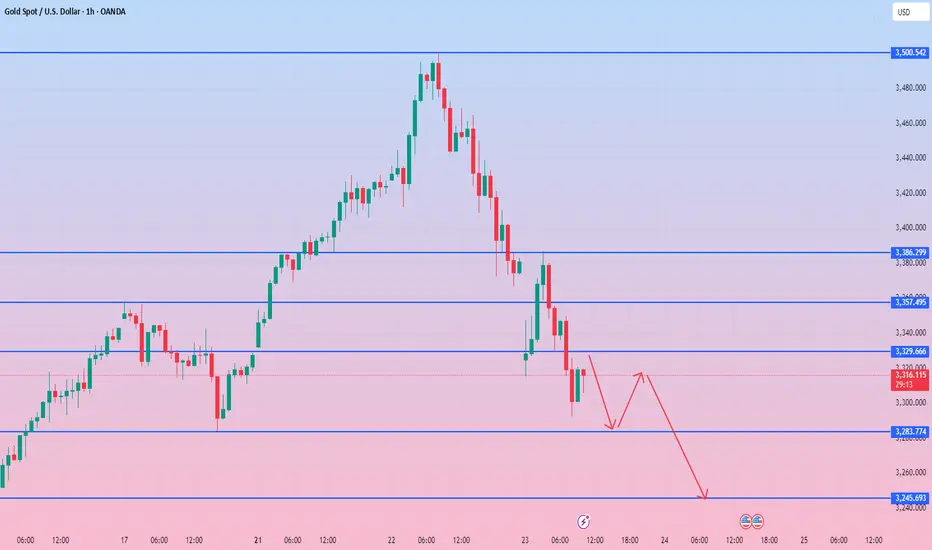
XAU/USD) orderblok key Support Analysis Read The ChaptianSMC Trading point update
technical analysis of Gold Spot against USD (XAUUSD) on the 1-hour timeframe. Here's a breakdown of the key ideas presented:
Chart Analysis Summary:
1. Price Zones:
Supply Zone (Resistance): Around the 3,355–3,365 level.
Demand/Support Zone (Doer Block Support Level): Around 3,282–3,291.
2. Current Price Action:
Price is currently at $3,331.96, close to the supply zone, and bouncing between the zones.
There’s a sharp downtrend, which seems to be slowing down near the support level.
3. Projected Move:
The chart suggests a short-term dip back into the demand/support zone, followed by a bullish reversal.
Target Point: A move back up toward $3,498.36, which is marked as a significant resistance.
4. Technical Indicators:
RSI (Relative Strength Index): Currently around 36.64 and recovering, suggesting potential bullish divergence or an oversold condition.
200 EMA: Around $3,291.52, providing dynamic support — aligning with the lower demand zone.
Mr SMC Trading point
Trade Idea:
Buy Setup (Long Trade):
Entry: Near 3,282–3,291 (support zone).
Target: 3,498.36.
Stop Loss: Below the support zone (~3,270).
Overall Idea:
This is a reversal-based setup. The price is expected to retest the support before launching a bullish leg toward the target. The confluence of the EMA, support zone, and RSI near oversold adds weight to the potential for a bounce.
Pelas support boost 🚀 analysis follow)

Analysis of gold short-term operation ideasGold price is currently trading below 3330. The downward trend in Asian session broke through the 3315 position in the morning. Our short position also successfully harvested a wave of big profits. Gold price showed signs of rebound in early European session. Now the upper pressure level can be moved down. The short-term pressure level is 3318, followed by the second highest point on the way up at 3357. The lower support level focuses on 3285. After effectively breaking through, we can focus on 3245. Now gold price is trading near the early low of 3315. The prudent operation idea is to go short at 3320 for protection at 3331 and wait for the gold price to reach 3285. After the break, wait for the rebound to 3300 and go short again to see the position of 3245. Long positions are not recommended.

Can the 3370 support level turn the tide?The Asian session low of 3413 rebounded to 3500 under pressure, and then fell back to 3370 in the evening, with a single-day fluctuation of more than 100 points. Since the 14-day bull market started at 2959 on April 7, the gold price has soared 500 points, and the short-term overbought has triggered technical correction pressure. The current market presents a strong pattern of "buying on every correction", and even if there is a long upper shadow, the bullish sentiment still dominates the market.
From a technical perspective, the support near 3370 is crucial. If it holds, the bullish trend will continue; otherwise, a break may trigger a deeper adjustment. Although there is short-term profit-taking pressure, the overall market is bullish. It is recommended to pay attention to the key support level of 3370 and be alert to low-long opportunities in repeated fluctuations.

Gold intraday high V reversal looks to continueToday's market analysis and interpretation:
First, the gold daily level: After closing with a full increase of 100 US dollars yesterday, it continued to rise by nearly 90 US dollars today. The daily line may not feel the acceleration, but from the weekly line, the trend of continuous large positives for nearly three weeks and an increase of more than 500 US dollars, it seems to be accelerating to the top; although the overall bullish trend this year will not be affected at all, in the short term, some bulls may flee due to the accelerated pull, that is, profit-taking, which is often more likely to happen; In addition, yesterday's research report focused on interpreting the trend of 2956 to 3500. It is very likely to cycle the previous wave of 2832 to 3167. The maximum retracement of 618 division position just confirms the previous top and bottom support of 3167. In addition, from the wave shape, if 2832-3167 belongs to the first wave, 3167 to 2956 belongs to the second wave, and the third wave is calculated by 1.618 times the first wave, it is exactly 3498, which is today's intraday high of 3500. Then the fourth correction wave may be brewing in the follow-up, which is generally the third wave 382 or 50 division, and it generally will not fall below the first wave high of 3167. Therefore, in the next few days, if 3500 cannot be broken through again, the correction will focus on the 382 division support 3292 and the 50 division support 3228. The limit is that it is unlikely to fall too far from 3167, and then Waiting for the opportunity of band bullishness, each squat adjustment is to further continue the bullish trend;
Second, gold 4-hour level: the current MA5-day moving average support is barely holding up temporarily, and the top is a bearish pattern of "evening star" with a large Yin wrapped in Yang. It needs to be combined with the subsequent K-line pattern. If there are continuous Yins and large Yins continue to appear, then this cycle will begin to be under pressure, and the MA10-day support of 3428 and the middle track of 3378-72 will be gradually tested below;
Third, gold hourly level: Asian session continues to rise sharply, but the European session suppresses the 3500 line and falls back, temporarily supporting the middle track. The inability of the European session to attack increases the risk of further downward adjustment tonight; once the middle track is effectively lost, it will continue to fall. Finally, tonight, we can gradually see the 66-day moving average, which is also the lower track of the white channel in the figure, about 3380; The short-term resistance is the 10-day moving average and the white channel counter-pressure point, concentrated at 3470-3480, which happens to be the 618 division point of the European session's decline and rebound; therefore, pay attention to 3470-3480 tonight. If it cannot withstand the pressure, it will continue to decline and gradually look at 3428 and 3411. The strong support is in the range of 3380-3370 tonight. If it stabilizes here, it will rebound to confirm the middle track, and the ups and downs will be huge.
